Low-luminosity Active Galaxies and their Central Black Holes
Abstract
Central black hole masses for 118 spiral galaxies representing morphological stages S0/a through Sc and taken from the large spectroscopic survey of Ho et al. (1997) are derived using -band data from 2MASS. Black hole masses are found using a calibrated black-hole – bulge luminosity relation, while bulge luminosities are measured by means of a two-dimensional bulge/disk decomposition routine.
The black hole masses are correlated against a variety of parameters representing properties of the nucleus and host galaxy. Nuclear properties such as line width (FWHM([N II])), as well as emission-line ratios (e.g., [O III]/H, [O I]/H, [N II]/H, and [S II]/H), show a very high degree of correlation with black-hole mass. The excellent correlation with line-width supports the view that the emission-line gas is in virial equilibrium with either the black hole or bulge potential. The very good emission-line ratio correlations may indicate a change in ionizing continuum shape with black hole mass in the sense that more massive black holes generate harder spectra.
Apart from the inclination-corrected rotational velocity, no excellent correlations are found between black-hole mass and host-galaxy properties.
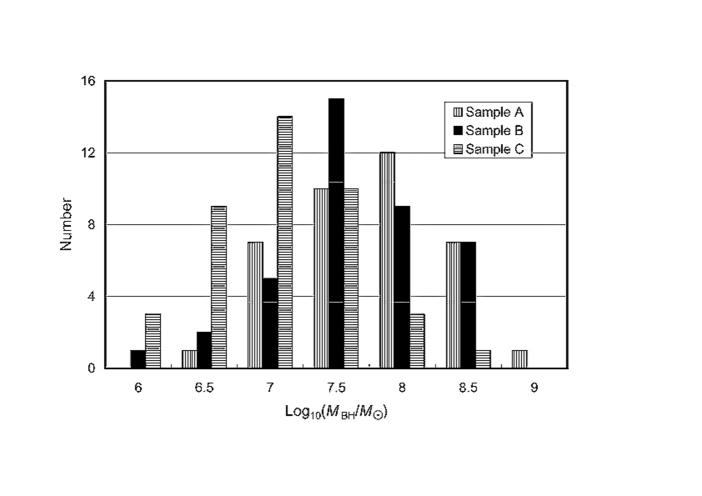
Significant differences are found between the distributions of black hole masses in early-, mid- and later-type spiral galaxies (subsamples A, B and C) in the sense that early-type galaxies have preferentially larger central black holes, consistent with observations that Seyfert galaxies are found preferentially in early-type systems. The line-width distributions show a marked difference among subsamples A, B and C, in the sense that earlier-type galaxies have larger line widths. There are also clear differences in line ratios between subsamples A+B and C that likely are related to the level of ionization in the gas. Finally, a -band Simien & de Vaucouleurs diagram shows excellent agreement with the original -band relation, though there is a large dispersion at a given morphological stage.
1 Introduction
Activity in galactic nuclei is almost certainly the result of the accretion of gas onto supermassive black holes (Rees, 1984). While the bolometric luminosity of some active galactic nuclei (AGNs) can approach and even exceed the luminosity of their host galaxies in the case of the brightest Seyfert galaxies and QSOs, it has been recognized for some time that there are AGNs of considerably lower luminosity. A large-scale spectroscopic survey by Ho et al. (1997) (hereafter, HFS), for example, discovered that approximately 86% of all galaxies brighter than an apparent magnitude of +12.5 contain detectable emission-line nuclei, and 43% of all galaxies that fall in its survey limits can be considered ‘active’. For galaxies with an obvious bulge component, this rises from 50% to 70% for early type galaxies, i.e., ellipticals, lenticulars, and bulge-dominated spirals (S0/a-Sbc).
There is now excellent evidence that supermassive black holes (BH) are found in the centers of dozens of nearby galaxies (Kormendy, 2004), including our own (Ghez, 2004). Moreover, there is a rather tight correlation between the mass of the BH and the velocity dispersion of the spheroidal stellar component in which it is situated (e.g., Ferrarese & Merritt 2000, Gebhardt et al.2000, Gebhardt et al.2003) and a good correlation between the mass of the bulge and BH. Under the assumption that this relation extends to all relatively bright, nearby galaxies, it is possible to probe the relationship between BHs and the host galaxies harboring low-luminosity AGNs. By studying this population in some detail, it is hoped that a greater insight will be achieved into how nuclear activity originates and is maintained.
In this paper, we use near-infrared -band imaging data from the Two Micron All Sky Survey (2MASS)111http://www.ipac.caltech.edu/2mass for 118 spiral galaxies (from S0/a to Sc) in the HFS sample to measure bulge luminosities and hence derive BH masses. There are definite advantages to working in the near infrared for our purposes: compared with the optical band, extinction effects in the -band are considerably reduced (e.g., Schlegel et al., 1998), while the composite spectral energy distribution of bulge stars is well represented in the -band (e.g., Bendo & Joseph, 2004). Correlations are sought between the BH mass and a number of properties of the galaxy, including structural properties, as well as properties of the nucleus, including ‘active’ and ‘non-active’ parameters. Comparisons of the distributions of the various parameters as a function of morphological type are also explored.
Section 2 describes the dataset which forms the basis of this study. Section 3 provides details on the bulge-disk decomposition of the 2MASS data, as well as the calibration of the -band bulge-BH relation. In section 4, we discuss the good-to-excellent correlations between BH mass and various galaxy and nuclear parameters as well as comparisons of the various distributions, while we offer opinions on the reasons for these correlations in section 5, the summary and conclusion.
2 The HFS Palomar Survey
We selected 118 galaxies from among the 486 nearby galaxies observed in the high-quality HFS spectroscopic survey carried out with the 5 m telescope at Mt. Palomar. A primary goal of the HFS study was to uncover ‘dwarf Seyfert nuclei’ and to determine their luminosity function. The authors selected galaxies from the Revised Shapley-Ames Catalogue of Bright Galaxies (RSA; Sandage & Tammann, 1981) and the Second Reference Catalogue of Bright Galaxies (RC2; de Vaucouleurs et al., 1976) subject to the criteria that the total apparent magnitude and declination . Incompleteness of the RSA catalog sets in near mag and becomes increasingly more severe by mag. The Palomar AGNs have a median (narrow) luminosity of erg s-1 (HFS). Typical Seyfert nuclei in the Markarian catalog emit erg s-1 in (Barth et al. 1999). Galaxies with erg s-1 are considered ‘low-luminosity’ or ‘dwarf’ AGNs.
2.1 Our sample
Galaxies in our sample were selected from HFS and divided into three subsamples according to morphology or Hubble stage parameter, . Subsample A includes only early-type spirals, S0/a and Sa galaxies, with . Subsample B includes intermediate-type spirals, Sab, Sb, Sbc galaxies, with , while subsample C includes late-type spirals, Sc galaxies, with .
Galaxies which do not have photometry from 2MASS are not included in our sample. Galaxies in the Virgo cluster are excluded if their projected angular separations to either of the two Virgo centers (i.e., M87 and NGC 4472) is , in order to reduce possible uncertainties resulting from environmental effects. (Only four galaxies were rejected based on this criterion.) Sample C galaxies that appear only to have a disk component are excluded as well. (About 15% of the galaxies of the appropriate morphological type were rejected from Sample C because they did not have a perceptible bulge component.) In our final sample, subsample A contains 38 galaxies, while subsamples B and C contain the first 40 galaxies from the HFS catalog satisfying the other selection criteria.
The data (Table 1) for the survey galaxies taken from HFS include emission-line parameters and host galaxy parameters. Distances were adopted from Tully(1988) and are derived from a Virgo infall model (Tully & Shaya, 1984) based on km s-1 Mpc-1, the value of the Hubble constant used throughout this paper. Refer to HFS for details concerning the measurement and reduction techniques.
2.2 2MASS data
The Two Micron All Sky Survey (2MASS) consists of exposures for 98% of the sky simultaneously in (1.24 ), (1.66 ), and (2.16 ). The total integration time of each image is 7.8 s with point-source sensitivity limits (10 ) of 15.8 (0.8 mJy), 15.1 (1.0 mJy), and 14.3 (1.4 mJy) mag at , , and , respectively. The extended source sensitivity limits (10 ) are 14.7 (2.1 mJy), 13.9 (3.0 mJy), and 13.4 (4.1 mJy) mag at , , , respectively.
Total magnitudes for all of our galaxies were taken from the Extended Source Catalog along with galaxy positions, photometry and basic shape information. The All Sky Extended Source Image Server provides full-resolution images in the angular size ranging from to . Galaxies larger than or are collected in the 2MASS Large Galaxy Atlas. The plate scale of the 2MASS data is 1 arcsec pixel-1. For our 118 sample galaxies, 69 were taken from the All Sky Extended Source Image Server and 49 from the Large Galaxy Atlas.
2.3 Measurement of Black Hole Mass
A variety of methods have been used to measure black-hole masses in galactic nuclei. Primary methods employ either stellar or gas kinematics to derive dynamical masses. Stellar dynamical techniques are used because stars are always present and their motions are subject to the gravitational potential. But they can be used only for nearby galaxies since high spatial resolution is required to measure the velocity dispersion of stars around the center of the galaxy (e.g., Kormendy, 2004). These techniques are not suitable for bright ellipticals and when a dust disk is present. Biases and systematics of the stellar kinematics technique can prove severe as well (e.g., Valluri et al., 2004). Gas dynamics from water maser clouds can provide good BH mass measurements (e.g., Greenhill et al., 1995; Moran et al., 1999); unfortunately, masers are not sufficiently common. Gas dynamics of nuclear dust/gas disks can be used in early type galaxies where stellar dynamical studies fail. But as Kormendy & Richstone(1995) have noted, gas, unlike stars, will respond to non-gravitational forces, and the motions of gas clouds may not always reflect the underlying gravitational potential. Another primary method for the measurement of black-hole masses is reverberation mapping (e.g., Blandford & McKee, 1982; Wandel et al., 1999; Kaspi et al., 2000).
Secondary methods include scaling relationships based on reverberation methods (e.g., Peterson et al., 2004).
2.4 BH Mass vs. Bulge Correlation
The mass of the central BH correlates well with the -band luminosity of the bulge component of its host galaxy, and it correlates even more strongly with the velocity dispersion of the bulge. Tremaine et al. (2002) and Gebhardt et al.(2003) demonstrated a strong correlation between the mass of the BH and the velocity dispersion of the host galaxy using high quality data from 31 nearby galaxies selected from Ferrarese & Merritt(2000), Gebhardt et al. (2000), Merritt & Ferraress(2001), and Kormendy & Gebhardt(2001).
We performed a weighted least-squares -BH mass fit using 2MASS magnitudes for 16 elliptical galaxies whose black hole masses (with uncertainties) and distances were taken from the compilation of Ferrarese & Ford (2005) and reproduced in Table 2:
| (1) |
(Three elliptical galaxies from Ferrarese & Ford (2005) were not included in the fit: NGC 2778 has an S0 light profile, the radius of the sphere of influence for NGC 821 is much smaller than the spatial resolution, and Cyg A is in a very rich cluster environment.) Compared with the -band fit provided in Ferrarese & Ford(2005), the -band relation has only a slightly smaller dispersion. The linear correlations in the -band and the -band fits are illustrated in Figure 1.
Equation (1) is derived under the assumption that elliptical galaxies behave as pure spheroids; i.e., scale as spiral galaxy bulges and so the total magnitudes from the XSC can be used directly. The absolute magnitudes are calculated from the apparent magnitudes using the distances provided in Tonry et al. (2001) with the appropriate Hubble constant change. Our relation is consistent with that derived by Marconi & Hunt(2003) who used both elliptical and spiral galaxies. We chose not to include spiral galaxies in our calibration, preferring to minimize uncertainties introduced by bulge-disk decomposition.
3 Bulge-Disk Decomposition
It is necessary to decompose the bulge and disk luminosities before using the bulge luminosity-BH mass relation to estimate the BH mass for each of our sample spiral galaxies. We chose to employ a two-dimensional bulge-disk decomposition technique on the 2MASS -band images. There is evidence that this technique is more robust than one-dimensional surface-brightness profile fitting, particularly when considering the uniqueness of a fit, and the effects of asymmetric light distributions.
We used GALFIT (Peng et al. 2002) to decompose galaxies into a spheroidal bulge following a Sérsic profile (Sérsic, 1968) and an exponential disk (Freeman, 1970). (GALFIT can accommodate as many components as required to generate a cleaner residual image. Unless there is a compelling physical reason to add another component, however, it is best to include only these two components.) A model galaxy image is created based on initial input parameters that can be convolved with a Point Spread Function (PSF) image before comparison with the actual galaxy image. Fitting proceeds iteratively until convergence is achieved, which normally occurs when does not change by more than 5 parts in for five iterations. (See Peng et al. (2002) for the discussion of the profile functions and fitting parameters.)
Only the Sérsic profile and the exponential profile were used for a galaxy fit unless there was clear evidence from the residual image for the existence of another component. Fewer than 16% of galaxies in our sample showed a more complicated structure. A mask was used in the centers of the 18 Seyfert galaxies in our sample to avoid possible contamination from the nuclear point source, something that will be discussed later.
3.1 Using GALFIT
Initial values for many of the parameters used in the fitting process could be taken from the 2MASS FITS image header, including the galaxy’s X and Y centers and zero point magnitude. The total magnitude of the galaxy was taken from the 2MASS XSC. The initial value for the bulge magnitude was estimated from the empirical relationship (Simien & de Vaucouleurs, 1986):
| (2) |
and
| (3) |
where
| (4) |
is the magnitude difference between the spheroid component and the total galaxy, is the Hubble morphological parameter. is the bugle-to-disk luminosity ratio, , where is the bulge-to-total luminosity ratio, and .
The PSF images were generated from 2MASS images using tasks in the DAO Crowded-Field Photometry Package (DAOPHOT) of IRAF222IRAF is distributed by the National Optical Astronomy Observatories, which are operated by the Association of Universities for Research in Astronomy, Inc., under cooperative agreement with the National Science Foundation.. A convolution radius of 20 seeing disks was used (Peng, private communication).
The initial value for , the Sérsic index, was taken to be 4, i.e., a de Vaucouleurs bulge. The axial ratio was taken from the 2MASS XSC, fitted to the isophote. The position angle was also taken from the 2MASS XSC. The shape parameter, , was fixed at 0.
Initial estimates for the bulge and disk scale radii, and (), were taken from the 2MASS XSC. and are sensitive to the background level. An ill-defined background level can cause an unreasonably large or small , which will affect the bulge parameters as well. 2MASS XSC images are individually background-subtracted using a weighted cubic polynomial smoothing technique on angular scales larger than our images Jarrett et al. (2000). Unable to provide a better background estimate, we set the sky value to 0 during the fitting process. The vast majority of galaxies had larger than the effective seeing disk; . Fewer than 3% had less than one seeing disk. Since the Sérsic index ‘n’ and are coupled — small always has small Graham (2001) — we accepted the best-fit that is larger than 0.5 kpc Graham (2001) and less than .
The 4 Seyfert 1s and 14 Seyfert 2s galaxies in our sample are the only objects whose derived bulge magnitudes could possibly have been compromised significantly by a central component (though no obvious point source was observed in the spatial profiles of these galaxies). Without knowing a priori the relative contribution of the point source, it seemed prudent to insert a circular mask of radius (slightly larger than the FWHM of the PSF) at the center of each Seyfert galaxy. Only data outside of this mask were used in the fit. Some empirical experiments showed that while masking might lead to systematically fainter bulges given the relatively low spatial resolution of 2MASS data, the average difference is within the uncertainty reported by GALFIT. Two tests were also performed to investigate how changes if the fit is perturbed somewhat from the best fit by varying the Sérsic index . In the majority of cases, varying by factors of two leads to bulge luminosity differences less than 10%. The bulge luminosity is then fairly robust.
GALFIT’s output includes uncertainties for each parameter in an output file. The uncertainties provided by GALFIT are equal to or slightly larger than the uncertainties determined through extensive modeling (Peng et al. 2002). There clearly are limitations in determining parameter errors, and uniqueness is never guaranteed. A good fit occurs, very frequently, when is minimized. But since depends on the number of degrees of freedom of the fit, it is difficult to decide upon an optimal fit based solely on , especially when some parameters are fixed or constrained during the fitting. Other criteria that were used to assess the quality of the fit include assessing: a) the physical reasonability of the parameter(s), b) the smoothness of the residual image, c) the surface brightness profiles to see if the sum of the components fits the actual galaxy well, and d) the differences between the total magnitude of the models and actual galaxies to ensure they are small and not systematic. For our sample, 63% of galaxies have magnitude differences within 0.1, while fewer than 11% have differences larger than 0.2.
Bulge-disk decomposition can be problematic in edge-on systems for a variety of reasons. Fortunately, only 6% of our sample galaxies have inclination angles greater than 75∘.
The GALFIT results are given in Table 3. From the GALFIT results, the total brightness of the bulge and the disk are converted to absolute magnitudes, while the scale lengths are converted to kiloparsecs using distances provided in HFS. From the absolute bulge magnitude, the BH mass can be derived. Table 4 gives the final results including the BH mass, the absolute magnitudes of the bulge, disk and the total galaxy, and the structure parameters (i.e., the scale lengths) of each component of the galaxy.
Uncertainties of the estimated BH masses include the uncertainty in the slope of the logarithm of the BH mass - bulge correlation, the formal uncertainties in the decomposition of the bulges, and the distance uncertainties (which provide the largest contribution). When considered together, the uncertainty in the logarithm of the black hole mass is 0.27 or about a factor of 2.
4 Discussion
In this section we describe the correlations found in this dataset and discuss their possible physical significance.
4.1 Correlations
A linear least-squares technique was used to search for correlations between parameters. In particular, we assessed the significance level or probability, , that a linear correlation coefficient of the appropriate magnitude could happen by chance from a random distribution.
The most significant correlations are provided in Table 5. An excellent correlation has , a good correlation has , while a poor correlation has .
It should be noted that quantities recorded in HSF as either upper or lower limits were not used when computing any correlation coefficient. Since the number of values with upper or lower limits are fewer than 10% for any parameter set considered herein, excluding galaxies with upper or lower limits is not expected to change our results significantly.
The nuclear properties, i.e., the emission-line ratios and the FWHM([N II]), are all well correlated with the BH mass, but they are not correlated with host galaxy properties except for the bulge luminosity which was anticipated.
The excellent correlation between emission-line width and BH mass () may provide support for the model in which the emission lines are generated by gas in the nucleus in virial equilibrium as has been hypothesized for more luminous systems (e.g., Nelson & Whittle, 1996; Boroson, 2003). If gas clouds are in virial equilibrium within a radius , then the three-dimensional dispersion velocity follows:
| (5) |
where is the mass within the radius , and is the gravitational constant. Figure 2 shows the correlation between the BH mass and the FWHM([N II]). The FWHM of an emission line is related to the three-dimensional velocity dispersion FWHM. It is not clear from these data, however, whether the BH or the bulge dominates the gravitational field in which the emission-line material moves. If the gravitational field is dominated by a BH with a mass about solar masses, a line width of 200 km s-1 will result from gas clouds at pc. If the gravitational field is dominated by a solar mass bulge of radius 2 kpc, a FWHM of 200 km s-1 arises from gas at 1 kpc.
Adequate spatial resolution is required to determine which component, the BH or the bulge, dominates the gas-cloud motion.
The reason for the unanticipated good correlations between emission-line ratios and BH mass shown in Figure 3 could be because the shape of the ionizing continuum is changing, i.e., is growing harder, with BH mass, but this is only speculation.
The far-infrared (FIR) color indices do not appear well correlated with BH mass, though the FIR luminosity does. This could be because the far-infrared emission likely results from dust heated either by nuclear star formation or by the active nucleus itself. More information is required to decide between the two mechanisms.
More information is also needed to explain the good correlation shown in Figure 4 between the narrow emission-line luminosity and the BH mass correlation because narrow emission could arise in gas photoionized by the nucleus and/or from nuclear star formation.
The BH mass and the inclination-corrected rotation velocity are also strongly correlated, with . This is not surprising since is a measure of the total mass within the H I radius of its host galaxy. This is shown in Figure 5. Because the rotation velocity normally is measured at a radius much greater than the bulge scale length, this correlation might point to relations among the mass of the dark matter halo, the mass of the bulge, and the mass of the central black hole. A correlation of this kind was first noticed by Ferrarese (2002).
No other significant correlations were found between the Sérsic index and other structure parameters (i.e., and ). The reason for this is likely because the Sérsic index was not always a free parameter in our analysis.
4.2 Distributions
The distributions of various parameters as a function of Hubble stage among the three samples, A, B, and C, were compared using the non-parametric Kolmogorov-Smirnov (K-S) test (Press et al., 1997). In the following, is the probability that two unrelated distributions would be this similar by chance. A small value of indicates there is a significant difference between two distributions. Data reported as upper or lower limits were not used in our calculations. Table 6 shows the results of the K-S test among three samples. (A, B) is the probability between the distributions of sample A and sample B; (A, C) is the probability between sample A and sample C; and (B, C) is the probability between sample B and sample C.
The , Mbul distributions show a strong difference between samples A and C, and B and C in Figure 6. This almost certainly means that the bulges (and therefore black holes) are more massive in sample A and B galaxies, than sample C. This likely also explains why AGNs are found preferentially in early type galaxies as the following calculation illustrates.
Using data from local clusters, de Lapparent (2003) and Sandage et al. (1985) have quantified the luminosity functions of early-type and late-type spiral galaxies. In particular, they suggest that the differential luminosity function, , is Gaussian with , where is the space density of a particularly morphological type of spiral galaxy, Mo is the mean absolute magnitude, and is the dispersion of the luminosity function in magnitudes. In clusters such as Virgo, Centaurus and Fornax, the space densities of Sa+Sb and Sc galaxies are similar, while their average absolute magnitudes differ in the sense that Sa+Sb galaxies are brighter than Sc galaxies by 1.4 magnitudes in optical bands.
The average absolute magnitudes of galaxies in our samples A, B and C, however, are similar to within uncertainties: , and . The average distances of each sample are also identical to within uncertainties. The average bulge luminosities are different, however, among the samples: for sample A; for sample B, and for sample C. While our sample was not intended to be complete in any sense, and it should be recalled that 15% of Sample C galaxies were not included in this study because they lacked a perceptible bulge, the sample is primarily representative of the field rather than a cluster environment.
We can estimate the relative number of Sa+Sb galaxies compared with Sc galaxies under the assumption that their luminosity functions and parameters are as described above. Using Equation(1), for a given BH mass, the absolute magnitude of the bulge can be computed. The ratio of the space densities of Sa+Sb to Sc galaxies with bulges as bright or brighter (or equivalently, black hole masses as great or greater) than this can then be calculated. Table 7 shows the results of this exercise.
It is clear in a statistical sense that spiral galaxies with central BH masses in the range of classical AGNs (i.e., ) occur overwhelmingly in early-type systems. Comparing these data with the relative number of classical AGNs is problematic; one would have to understand how accretion rates depend on morphological type, and make allowances for the heterogeneous ways these systems are discovered.
A comparison was also made between given by Simien & de Vaucouleurs’ empirical relationship (Simien & de Vaucouleurs, 1986) from Equation (4) and (2) where are from the GALFIT measurements herein. The original Simien & de Vaucouleurs’ relation was measured in the band, while our sample allows us to measure the new Simien & de Vaucouleurs’ relation in the band. Following Simien & de Vaucouleurs’ formalism, the best-fit relation is shown in the following cubic equation, where
| (6) |
The results are illustrated in Figure 7; the solid line is taken from the Simien & de Vaucouleurs’ relation in the band (Simien & de Vaucouleurs, 1986), the dashed line is the new relation in band, while our empirical data are illustrated with 1- standard deviations. It can be seen that there is excellent agreement between the and -band data and that there is a very large scatter at each morphological stage.
The FIR luminosities show significantly different distributions among samples A and B&C. FIR emission is normally considered to originate from dust heated by stars and/or an active nucleus. Sample A and B have more activity in their nuclei, while sample C galaxies have more gas and star formation (most of them being H II region galaxies). Sample B galaxies perhaps show both mechanisms are present.
The FWHM([N II]) distributions are different in all three populations. In Figure 8 we show the mean FWHM([N II]) for each Hubble stage and the accompanying standard deviation. In early-type galaxies with , BHs may contribute to the line width, i.e., the more massive the BH, the broader the random velocities and hence emission lines. For later-type galaxies with , the FWHM appears almost constant, possibly reflecting the rotational and random velocities of the bulges alone. The [O III]/H and [N II]/H ratios show clear differences between samples A&B and C galaxies. These ratios indicate the ionization level in the emission-line gas and so the relative contribution of nonthermal vs. thermal radiation.
The inclination-corrected rotation velocities are different in samples A&B and C. The reason is likely because samples A and B galaxies have more massive bulges than C galaxies.
The G-band distributions show that sample A&B are similar, while sample C is different. The G-band begins to become significant in early or mid-F spectral type stars, and becomes prominent in late-F to K stars. It is weak in early-type stars and star-forming regions. The difference among the distributions, although not strong, could provide an indication that the integrated populations are different in these subsamples. Sample C galaxies generally have a weaker G-band that is indicative of a younger population.
As expected, there are no statistically significant differences involving galaxy density , the projected angular separation between the galaxy and its neighbor , and the inclination of the disk with distance.
We also investigated the role played by the level of nuclear activity among the various parameters. Of 118 galaxies, 19 are classified as Seyferts, 26 as LINERs, 57 as H II region galaxies, and 15 as transition objects (HFS). In most correlations and distributions, H II region galaxies can be clearly distinguished from the other galaxies, but there is no significant grouping among the other (AGN) categories.
5 Summary and Conclusions
Through the calibration of the black hole — bulge luminosity relation, we determined the central black hole masses for 118 spiral galaxies using 2MASS data for a variety of morphological stages from the spectroscopic survey of HFS. The bulge luminosities were measured using GALFIT, a two-dimensional bulge/disk decomposition routine.
Nuclear properties such as line width (FWHM([N II])), as well as emission-line ratios (e.g., [O III]/H, [O I]/H, [N II]/H, and [S II]/H), showed a very high degree of correlation with black hole mass. The excellent line-width correlation provides strong support that the emission-line gas is in virial equilibrium with either the black hole or bulge potential. The very good emission-line ratio correlations seem to suggest that more massive black holes give rise to harder ionizing radiation.
The only non-trivial host-galaxy parameter that correlated well with black-hole mass is the inclination-corrected rotational velocity. This may suggest that the black hole-bulge relation may also extend to the dark matter halo.
The sample was divided into three subsamples, A, B, and C according to host-galaxy morphology. Significant differences were found among the distributions of black hole masses in the subsamples in the sense that early-type galaxies have preferentially larger central black holes. This is consistent with observations that Seyfert galaxies, for example, are found preferentially in early-type systems. The line-width distributions also illustrated clear differences among subsamples A, B and C, in the sense that earlier-type galaxies have larger line widths, widths that could have a significant contribution by the central black hole, as well as the bulge potential.
Marked differences were found between subsamples A+B and C for emission-line ratios, differences that could be attributed to the level of ionization in the gas in the sense that late-type galaxies have a larger thermal component. Finally, a -band Simien & de Vaucouleurs diagram showed excellent agreement with the original -band relation, with a considerable dispersion at every morphological stage.
The authors would like to thank the Natural Sciences and Engineering Research Council of Canada for support, as well as C.J. Ryan for insightful discussions. This publication makes use of data products from the Two Micron All Sky Survey, which is a joint project of the University of Massachusetts and the Infrared Processing and Analysis Center/California Institute of Technology, funded by the National Aeronautics and Space Administration and the National Science Foundation. This work was based on research carried out by X.Y.D. in partial fulfillment of an M.Sc. thesis.
References
- Barth et al. (1999) Barth, A. J., Filippenko, A. V., & Moran, E. C. 1999, ApJ, 525, 673
- Bendo & Joseph (2004) Bendo, G. J. & Joseph, R. D. 2004, AJ, 127, 3338
- Blandford & McKee (1982) Blandford, R. D. & McKee, C. F. 1982, ApJ, 255, 419
- Boroson (2003) Boroson, T. A. 2003, ApJ, 585, 681
- Bower et al. (1998) Bower, G. et al. 1998, ApJ, 492, L111
- Cappellari et al. (2002) Cappellari, M. et al. 2002, ApJ, 578, 787
- de Vaucouleurs et al. (1976) de Vaucouleurs, G., de Vaucouleurs, A., & Corwin, J. R. 1976, Second Reference Catalogue of Bright Galaxies. (Austin: The Univ. of Texas Press.)
- de Lapparent (2003) de Lapprent, V. 2003, A&A, 408, 845.
- Erwin et al. (2004) Erwin, P., Graham, A. W., & Caon, N. 2004, in Coevolution of Black Holes & Galaxies, ed. L. C. Ho (Cambridge: Cambridge Univ. Press), 12
- Ferrarese et al. (1996) Ferrarese, L., Ford, H. C., & Jaffe, W. 1996, ApJ, 470, 444
- Ferrarese & Ford (1999) Ferrarese, L. & Ford, H. C. 1999, ApJ, 515, 583
- Ferrarese & Merritt (2000) Ferrarese, L. & Merritt, D. 2000, ApJ, 539, 9
- Ferrarese (2002) Ferrarese, L. 2002, ApJ, 578, 90
- Ferrarese & Ford (2005) Ferrarese, L. & Ford, H. 2005, Space Science Reviews, 116, 523
- Freeman (1970) Freeman, K. C. 1970, ApJ, 160, 811
- Gebhardt et al. (2000) Gebhardt, K., et al. 2000, AJ, 119, 1157
- Gebhardt et al. (2003) Gebhardt, K., et al. 2003, ApJ, 583, 92
- Ghez (2004) Ghez, A. M. 2004, in Coevolution of Black Holes & Galaxies, ed. L. C. Ho (Cambridge: Cambridge Univ. Press), 53
- Graham (2001) Graham, A. W. 2001, AJ, 121, 820
- Greenhill et al. (1995) Greenhill, L. J., et al. 1995, ApJ, 440, 619
- Ho et al. (1997) Ho, L. C., Fillippenko, A. V., & Sargent, W. L. W. 1997, ApJS, 112, 315
- Jarrett et al. (2000) Jarrett, T. H., et al. 2000, AJ, 119, 2498
- Kaspi et al. (2000) Kaspi, S., et al. 2000, ApJ, 533, 631
- Kormendy (2004) Kormendy, J. 2004, in Coevolution of Black Holes & Galaxies, ed. L. C. Ho (Cambridge: Cambridge Univ. Press), 1
- Kormendy & Gebhardt (2001) Kormendy, J. & Gebhardt, K. 2001, AIP Conf. Proc. 586, 20th Texas Symposium on Relativistic Astrophysics, ed. J. C. Wheeler & H. Martel (New York: AIP), 363
- Kormendy & Richstone (1995) Kormendy, J. & Richstone, D. 1995, ARA&A, 33, 581
- Macchetto et al. (1997) Macchetto, D. F., et al. 1997, ApJ, 489, 579
- Marconi & Hunt (2003) Marconi, A. & Hunt, L. K. 2003, ApJ, 589, 21
- Merritt & Ferraress (2001) Merritt, D. & Ferrarese, L. 2001, ApJ, 547, 140
- Moran et al. (1999) Moran, J. M., Greenhill, L. J., & Herrnsten, J. R., JApA, 20 165
- Nelson & Whittle (1996) Nelson, C. H. & Whittle, M. 1996, ApJ, 465, 96
- Peng et al. (2002) Peng, C. Y., et al. 2002, AJ, 124, 266
- Peterson et al. (2004) Peterson, B. J., et al. 2004, ApJ, 613, 682
- Press et al. (1997) Press, W. H., et al. 1997, Numerical Recipes in C. (Cambridge: Cambridge Univ. Press.)
- Rees (1984) Rees, M. J. 1984, ARA&A, 22, 471
- Sandage & Tammann (1981) Sandage, A. & Tammann, G. A. 1981, A Revised Shapley-Ames Catalog of Bright Galaxies. Washington: Carnegie Institution of Washington.
- Sandage et al. (1985) Sandage, A., Binggeli, B., & Tammann, G.A. 1985, AJ, 90, 1759
- Schlegel et al. (1998) Schlegel, D., J., Finkbeiner, D. P., & Davis, M. 1998, ApJ, 500, 525
- Sérsic (1968) Sérsic, J. L. 1968, Atlas de Galaxias Australes (Córdoba: Obs. Astron., Univ. Nac. Córdoba.)
- Simien & de Vaucouleurs (1986) Simien, F. & de Vaucouleurs, G. 1986, ApJ, 302, 564
- Tonry et al. (2001) Tonry, J. L., et al. 2001, ApJ, 546, 681
- Tremaine et al. (2002) Tremaine, S. et al. 2002, ApJ, 574, 740
- Tully (1988) Tully, R. B. 1988, Nearby Galaxies Catalog (Cambridge: Cambridge Univ. Press.)
- Tully & Shaya (1984) Tully, R. B. & Shaya, E. J. 1984, ApJ, 281, 31
- Valluri et al. (2004) Valluri, M., Merritt, D., & Emsellem, E. 2004, ApJ, 602, 66
- van der Marel & van den Bosch (1998) van der Marel, R. P. & van den Bosch, F. C. 1998, AJ, 116, 2220
- Verolme et al. (2002) Verolme, E. K., et al. 2002, MNRAS, 335, 517
- Wandel et al. (1999) Wandel, A., Peterson, B. M., & Malkan, M. A. 1999, ApJ, 526, 579


| Galaxy Name | Log(H) | FWHM([N
II |
H/H | [O
III |
[N
II |
|||
|---|---|---|---|---|---|---|---|---|
| (km s-1) | (Mpc) | () | ||||||
| (1) | (2) | (3) | (4) | (5) | (6) | (7) | (8) | (9) |
| Sample A | ||||||||
| NGC 1358 | 40.36L | 246 | 3.72 | 11.33 | 2.01 | 0 | 53.6 | |
| NGC 2639 | 39.68L | 401 | 4.06 | 3.46 | 4.25 | 1 | 42.6 | |
| NGC 2655 | 39.55 | 404 | 4.94 | 3.83 | 2.91 | 0 | 24.4 | 628 |
| NGC 2782 | 40.79 | 312 | 6.5 | 1.01 | 0.43 | 1 | 37.3 | 277 |
| NGC 3166 | 39.1 | 344 | 6.50b | 2.71b | 2.57 | 0 | 22 | 156 |
| NGC 3169 | 39.02 | 348 | 5.03b | 2.88b | 2.07 | 1 | 19.7 | 641 |
| NGC 3185 | 39.6 | 232 | 4.91 | 3.42 | 0.70 | 1 | 21.3 | 376 |
| NGC 3190 | 38.82 | 494 | 2.58 | 2.06 | 3.47 | 1 | 22.4 | 629 |
| NGC 3227 | 40.38L | 471 | 2.90b | 5.91b | 1.33 | 1 | 20.6 | 557 |
| NGC 3301 | 39.22L | 412 | 2.73b | 0.33b | 1.16 | 0 | 23.3 | |
| NGC 3593 | 38.15 | 134 | 5.96 | 1.44 | 0.55 | 0 | 5.5 | 251 |
| NGC 3600 | 38.48 | 88 | 3.68 | 1.97 | 0.14 | 1 | 10.5 | 214 |
| NGC 3623 | 37.77 | 366 | 2.85c | 2.33c | 3.23 | 1 | 7.3 | 514 |
| NGC 3718 | 38.46L | 371 | 4.33c | 3.02c | 0.86 | 1 | 17 | 528 |
| NGC 3729 | 39.51 | 204 | 5.19 | 1.05 | 0.51 | 1 | 17 | 284 |
| NGC 3884 | 40.3 | 535 | 2.85 | 2.24 | 2.07 | 0 | 91.6 | 678 |
| NGC 4064 | 39.54 | 114 | 4.53 | 0.1 | 0.27 | 1 | 16.9 | 212 |
| NGC 4235 | 39.25 | 398 | 7.82 | 12.86 | 2.57 | 1 | 35.1 | 336 |
| NGC 4245 | 37.75 | 122 | 2.03b | 0.86b | 0.70 | 0 | 9.7 | 346 |
| NGC 4293 | 38.77 | 260 | 7.54 | 1.72 | 1.41 | 0 | 17 | 419 |
| NGC 4314 | 38.45 | 205 | 3.46 | 0.72 | 1.01 | 1 | 9.7 | 380 |
| NGC 4369 | 39.68 | 112 | 3.08 | 0.4 | 0.37 | 1 | 21.6 | 258 |
| NGC 4378 | 38.8 | 340 | 3.60b | 4.09b | 2.78 | 1 | 35.1 | 700 |
| NGC 4421 | 0 | 16.8 | ||||||
| NGC 4457 | 39.57 | 273 | 3.78 | 0.87 | 1.04 | 0 | 17.4 | 306 |
| NGC 4470 | 39.24L | 131u | 2.86 | 0.41 | 0.29 | 1 | 31.4 | 213 |
| NGC 4594 | 39.7 | 509 | 3.37 | 1.57 | 2.19 | 1 | 20 | 807 |
| NGC 4643 | 38.44 | 144 | 2.72c | 1.34c | 1.79 | 0 | 25.7 | |
| NGC 4665 | 0 | 17.9 | ||||||
| NGC 4772 | 38.49L | 549 | 3.19 | 2.92 | 1.31 | 1 | 16.3 | 515 |
| NGC 5377 | 39.18 | 294 | 4.65b | 2.00b | 2.15 | 1 | 31 | 451 |
| NGC 5448 | 39.47 | 362 | 7.63 | 0.93 | 1.03 | 1 | 32.6 | 456 |
| NGC 5548 | 40.70L | 275 | 1.28 | 10.09 | 0.88 | 0 | 67 | 492 |
| NGC 5701 | 38.50L | 229 | 2.11 | 1.57 | 0.76 | 0 | 26.1 | 262 |
| NGC 6340 | 38.5 | 393 | 2.22b | 1.53b | 1.08 | 0 | 22 | 542 |
| NGC 660 | 38.89 | 210 | 13.65 | 2.53 | 0.85 | 1 | 11.8 | 336 |
| NGC 6654 | 0 | 29.5 | ||||||
| NGC 718 | 38.45 | 202 | 2.04b | 1.30b | 2.60 | 1 | 21.4 | 247 |
| Sample B | ||||||||
| IC 356 | 38.19L | 311 | 7.76c | 2.45c | 1.68 | 2 | 18.1 | 718 |
| IC 520 | 38.92 | 198 | 1.86b | 2.47b | 1.66 | 2 | 47 | |
| NGC 2146 | 39.76 | 139 | 10.24 | 0.48 | 0.45 | 2 | 17.2 | 591 |
| NGC 2273 | 40.41 | 210 | 5.08 | 5.77 | 0.86 | 0.5 | 28.4 | 545 |
| NGC 266 | 39.30 | 326 | 1.68b | 2.38b | 2.36 | 2 | 62.4 | 1004 b |
| NGC 2775 | 2 | 17 | 676 | |||||
| NGC 2985 | 39.02L | 263 | 2.07 | 0.97 | 0.86 | 2 | 22.4 | 516 |
| NGC 3368 | 38.25L | 231 | 7.46b | 1.83b | 1.11 | 2 | 8.1 | 480 |
| NGC 3504 | 40.81 | 205 | 4.34 | 0.53 | 0.59 | 2 | 26.5 | 306 |
| NGC 3705 | 38.66 | 190 | 5.02 | 1.10 | 0.88 | 2 | 17 | 381 |
| NGC 3898 | 38.85L | 232 | 2.88b | 2.10b | 1.48 | 2 | 21.9 | 587 |
| NGC 4151 | 41.22L | 331 | 3.40 | 11.56 | 0.68 | 2 | 20.3 | 198 |
| NGC 4192 | 38.97 | 266 | 13.02b | 1.87b | 1.41 | 2 | 16.8 | 486 |
| NGC 1055 | 37.92 | 79 | 0.66 | 3 | 12.6 | 425 | ||
| NGC 1186 | 40.11 | 256 | 6.37 | 0.54 | 0.53 | 4 | 35.4 | |
| NGC 2268 | 39.76 | 177 | 4.38 | 1.47 | 0.59 | 4 | 34.4 | 499 |
| NGC 2336 | 38.39 | 266 | 4.47 | 2.97 | 1.79 | 4 | 33.9 | 544 |
| NGC 2748 | 39.23 | 152 | 6.11 | 0.28 | 0.35 | 4 | 23.8 | 338 |
| NGC 2841 | 38.53L | 308 | 3.34 | 1.86 | 1.83 | 3 | 12 | 657 |
| NGC 3003 | 39.86L | 87 | 4.74 | 0.51 | 0.27 | 4 | 24.4 | 291 |
| NGC 3043 | 39.08 | 86 | 3.61 | 0.36 | 0.36 | 3 | 39.1 | 287 |
| NGC 3147 | 39.47 | 427 | 5.23 | 6.14 | 2.71 | 4 | 40.9 | 690 b |
| NGC 3162 | 39.34L | 131 | 3.39 | 0.16 | 0.34 | 4 | 22.2 | 330 |
| NGC 3254 | 38.43 | 155 | 6.32 | 9.57 | 1.14 | 4 | 23.6 | 445 |
| NGC 3344 | 38.88 | 128 | 3.74 | 0.86 | 0.42 | 4 | 6.1 | 332 b |
| NGC 3351 | 38.64 | 183 | 4.38 | 0.27 | 0.46 | 3 | 8.1 | 368 |
| NGC 3507 | 39.39 | 232 | 3.81 | 0.98 | 1.10 | 3 | 19.8 | 287 |
| NGC 3583 | 39.36 | 199 | 8.31 | 0.64 | 0.71 | 3 | 34 | 456 |
| NGC 3627 | 38.50 | 220 | 5.92 | 2.90 | 1.44 | 3 | 6.6 | 411 |
| NGC 3628 | 36.87 | 82 | 4.72 | 1.77 | 0.95 | 3 | 7.7 | 476 a |
| NGC 3642 | 39.35L | 167 | 3.21 | 1.32 | 0.71 | 4 | 27.5 | 114 |
| NGC 3675 | 38.19 | 196 | 3.20c | 1.28c | 1.49 | 3 | 12.8 | 490 |
| NGC 3684 | 38.67 | 86 | 3.76 | 0.33 | 0.33 | 4 | 23.4 | 327 |
| NGC 3686 | 39.80 | 96 | 3.43 | 0.13 | 0.31 | 4 | 23.5 | 313 |
| NGC 3756 | 38.09 | 86 | 5.05 | 0.43b | 0.32 | 4 | 23.5 | 344 |
| NGC 3953 | 38.38 | 153 | 4.62 | 1.56 | 1.21 | 4 | 17 | 481 |
| NGC 3963 | 39.61 | 100 | 5.26 | 0.16b | 0.32 | 4 | 42.7 | 330 b |
| NGC 3992 | 38.42L | 264 | 2.09 | 1.99 | 1.73 | 4 | 17 | 591 |
| NGC 4041 | 39.46 | 129 | 6.28 | 0.39 | 0.64 | 4 | 22.7 | 468 b |
| NGC 4051 | 40.04L | 228 | 3.30 | 4.50 | 0.64 | 4 | 17 | 427 |
| Sample C | ||||||||
| IC 467 | 38.30L | 104 | 5.82 | 0.43 | 0.44 | 5 | 27.4 | 320 |
| NGC 514 | 38.46 | 102 | 4.93 | 0.41 | 0.37 | 5 | 32.4 | 440 |
| NGC 628 | 5 | 9.7 | 156 b | |||||
| NGC 783 | 40.21 | 121 | 4.76 | 0.21 | 0.36 | 5 | 68.1 | 188 b |
| NGC 818 | 39.31 | 229 | 6.70 | 0.94b | 0.45 | 4.5 | 59.4 | 503 |
| NGC 864 | 39.80 | 101 | 3.56 | 0.25 | 0.41 | 5 | 20 | 348 |
| NGC 1667 | 40.54L | 365 | 4.01 | 7.58 | 2.38 | 5 | 61.2 | 503 |
| NGC 1961 | 39.81L | 371 | 5.44 | 1.18 | 1.96 | 5 | 53.1 | 885 |
| NGC 2276 | 39.87 | 118 | 6.89 | 0.15 | 0.35 | 5 | 36.8 | 374 b |
| NGC 2715 | 38.49 | 93 | 4.68 | 0.95 | 0.45 | 5 | 20.4 | 48 |
| NGC 2750 | 40.60 | 167 | 3.97 | 0.18 | 0.43 | 5 | 38.4 | 382 b |
| NGC 2770 | 38.86L | 140 | 6.59 | 0.31 | 0.38 | 5 | 29.6 | 357 |
| NGC 2776 | 39.06 | 104 | 3.48 | 0.64 | 0.47 | 5 | 38.7 | 428 b |
| NGC 2967 | 38.30 | 170u | 2.77b | 1.48u | 0.31 | 5 | 30.9 | 290 b |
| NGC 3041 | 38.06 | 167u | 2.75 | 0.55 | 0.44 | 5 | 22.8 | 377 |
| NGC 3198 | 38.37 | 122 | 6.44 | 0.23 | 0.42 | 5 | 10.8 | 339 |
| NGC 3338 | 38.15 | 172u | 0.86b | 0.49 | 5 | 22.8 | 434 | |
| NGC 3359 | 38.18 | 84 | 3.73b | 0.55b | 0.31 | 5 | 19.2 | 314 |
| NGC 3367 | 40.98 | 293 | 4.36 | 0.50 | 0.83 | 5 | 43.6 | 492 |
| NGC 3370 | 38.75 | 142u | 4.12 | 0.24 | 0.33 | 5 | 23.4 | 336 |
| NGC 3430 | 39.04 | 157 | 4.62 | 0.21 | 0.35 | 5 | 26.7 | 407 |
| NGC 3433 | 38.11 | 158 | 1.66b | 0.27c | 0.67 | 5 | 39.5 | 546 b |
| NGC 3486 | 37.79 | 149 | 3.28 | 4.54 | 1.05 | 5 | 7.4 | 338 |
| NGC 3596 | 39.19 | 167u | 3.76 | 0.25 | 0.42 | 5 | 23 | 268 b |
| NGC 3631 | 38.58 | 92 | 3.38b | 0.32c | 0.43 | 5 | 21.6 | 250 b |
| NGC 3655 | 39.47L | 205 | 6.45 | 3.60 | 0.72 | 5 | 26.5 | 404 |
| NGC 3666 | 38.21 | 118 | 4.94 | 0.26 | 0.42 | 5 | 17 | 276 |
| NGC 3726 | 39.20 | 63 | 3.44 | 0.14 | 0.31 | 5 | 17 | 385 |
| NGC 3735 | 39.82 | 274 | 6.31 | 7.14 | 0.85 | 5 | 41 | 509 a |
| NGC 3780 | 37.68c | 179 | 0.59L | 0.86L | 3.17c | 5 | 37.2 | 504 |
| NGC 3810 | 38.27 | 84 | 3.15 | 0.20b | 0.64 | 5 | 16.9 | 369 |
| NGC 3877 | 39.56 | 129 | 5.61 | 0.14 | 0.35 | 5 | 17 | 370 |
| NGC 3893 | 38.74 | 112 | 4.52 | 0.22 | 0.37 | 5 | 17 | 375 |
| NGC 3938 | 37.70b | 88c | 2.82c | 1.76u | 0.53c | 5 | 17 | 212 b |
| NGC 4062 | 37.62L | 97 | 5.38 | 0.41 | 0.45 | 5 | 9.7 | 320 |
| NGC 4096 | 38.15 | 74 | 4.14 | 0.06b | 0.28 | 5 | 8.8 | 330 |
| NGC 4123 | 40.35 | 155 | 5.61 | 0.33 | 0.53 | 5 | 25.3 | 359 |
| NGC 4136 | 38.12 | 137u | 3.42 | 0.66 | 0.33 | 5 | 9.7 | 208 b |
| NGC 4152 | 39.94L | 138 | 4.51 | 0.24 | 0.49 | 5 | 34.5 | 355 |
| NGC 4212 | 39.39 | 131 | 4.72 | 0.14 | 0.41 | 4.5 | 16.8 | 340 |
Note. — Emission-line and host-galaxy parameters were taken from HFS. H and H refer to the narrow emission-line components. Col.(1): Galaxy name. Col.(2): Luminosity of the narrow component of H in units of . Col.(3): FWHM of [N II ]6583. Col.(4): H/H, corrected for Galactic reddening. Col.(5),(6): Dereddened (Galactic and internal) emission-line intensity ratios. The symbols have the following meanings: ‘L’ lower limit; ‘u’ upper limit. Values with uncertainties of are followed by ‘b’, while highly uncertain values with probable errors of 100% are followed by ‘c’. Col.(7): Hubble morphological stage index. Col.(8): Distance. Col.(9): Rotational velocity amplitude corrected for inclination: ‘a’ refers to a lower limit because the inclination is not available; ‘b’ suggests the inclination correction uncertain and is set to 30∘; ‘c’ means possibly confused by another nearby galaxy; ‘d’ indicates the velocity width was measured at 50% of the peak of the H I profile.
| Galaxy | Distance | Reference | ||
|---|---|---|---|---|
| (Mpc) | () | (mag) | ||
| (1) | (2) | (3) | (4) | (5) |
| NGC 5845 | 24.74 | 2.4 | 1 | -22.86 0.21 |
| NGC 221 | 0.77 | 0.025 | 2 | -19.34 0.08 |
| IC 1459 | 28.83 | 26 | 3 | -25.49 0.28 |
| NGC 4374 | 17.72 | 17 | 4 | -25.02 0.11 |
| NGC 4697 | 11.43 | 1.7 | 1 | -23.92 0.14 |
| NGC 4649 | 16.44 | 20 | 1 | -25.34 0.15 |
| NGC 4261 | 31.12 | 5.4 | 5 | -25.20 0.19 |
| NGC 4564 | 14.53 | 0.56 | 1 | -22.88 0.17 |
| NGC 3379 | 10.34 | 1.35 | 6 | -23.80 0.11 |
| NGC 4473 | 15.31 | 1.1 | 1 | -23.77 0.13 |
| NGC 3608 | 22.48 | 1.9 | 1 | -23.66 0.14 |
| NGC 4291 | 25.34 | 3.1 | 1 | -23.60 0.32 |
| NGC 3377 | 10.88 | 1 | 1 | -22.74 0.09 |
| NGC 4486 | 15.75 | 35.7 | 7 | -25.18 0.16 |
| NGC 7052 | 58.70 | 3.7 | 8 | -25.27 0.16 |
| NGC 6251 | 93.00 | 5.9 | 9 | -25.82 0.16 |
Note. — Col.(1): Galaxy name. Col.(2): Distance, from Tonry et al. (2001). Distances of NGC 7052 and NGC 6251 are derived from the heliocentric systemic velocity and km s-1 Mpc-1. Col.(3): BH masses with uncertainties. Col.(4): References for BH masses. 1. Gebhardt et al. 2003 - 2. Verolme et al. 2002 - 3. Cappellari et al. 2002 - 4. Bower et al. 1998 - 5. Ferrarese et al. 1996 - 6. Gebhardt et al. 2000 - 7. Macchetto et al. 1997 - 8. van der Marel & van den Bosch 1998 - 9. Ferrarese & Ford 1999 Col.(5): Bulge magnitude in band from 2MASS XSC with uncertainties.
| Galaxy Name | Func. | or | or | residual flux | ||||
|---|---|---|---|---|---|---|---|---|
| (arcsec) | (percentage) | |||||||
| (1) | (2) | (3) | (4) | (5) | (6) | (7) | (8) | (9) |
| Sample A | ||||||||
| NGC 1358 | Sersic | 10.18 | 4.51 | 2.28 | 0.01 | 8.948 | 9.09 | 14.3 |
| exp | 9.59 | 21.20 | ||||||
| NGC 2273 | Sersic | 9.66 | 3.60 | 5.50 | 0.04 | 8.480 | 8.47 | -1.0 |
| exp | 8.91 | 15.61 | ||||||
| NGC 2639 | Sersic | 9.96 | 8.21 | 4.00 | 1.26 | 8.397 | 8.44 | 4.2 |
| exp | 8.75 | 10.02 | ||||||
| NGC 2655 | Sersic | 7.46 | 19.82 | 3.18 | 4.92 | 6.951 | 6.95 | 0.1 |
| exp | 8.02 | 42.79 | ||||||
| NGC 2782 | Sersic | 10.14 | 3.48 | 2.06 | 0.04 | 8.871 | 8.82 | -4.7 |
| exp | 9.20 | 15.29 | ||||||
| NGC 3166 | Sersic | 8.22 | 6.00 | 2.57 | 0.34 | 7.210 | 7.19 | -1.7 |
| Sersic | 8.83 | 19.44 | 0.70 | |||||
| exp | 8.21 | 39.78 | ||||||
| NGC 3169 | Sersic | 7.52 | 15.70 | 4.17 | 0.99 | 7.283 | 7.13 | -13.2 |
| exp | 8.43 | 44.76 | ||||||
| NGC 3185 | Sersic | 10.66 | 4.90 | 5.50 | 0.02 | 9.145 | 9.00 | -12.8 |
| exp | 9.26 | 22.68 | ||||||
| NGC 3190 | Sersic | 7.99 | 14.24 | 5.50 | 3.75 | 7.457 | 7.40 | -4.9 |
| Sersic | 9.58 | 25.95 | 0.50 | |||||
| exp | 8.77 | 36.19 | ||||||
| NGC 3227 | Sersic | 9.31 | 5.10 | 5.50 | 4.35 | 7.639 | 7.65 | 0.6 |
| exp | 7.91 | 36.57 | ||||||
| NGC 3301 | Sersic | 9.38 | 4.50 | 5.08 | 0.03 | 8.522 | 8.46 | -5.4 |
| exp | 9.07 | 17.00 | ||||||
| NGC 3593 | Sersic | 7.87 | 18.90 | 1.82 | 0.07 | 7.417 | 7.31 | -9.6 |
| exp | 8.31 | 66.22 | ||||||
| NGC 3600 | Sersic | 10.76 | 10.36 | 1.32 | 0.04 | 10.202 | 9.84 | -28.6 |
| exp | 10.44 | 32.96 | ||||||
| NGC 3623 | Sersic | 7.81 | 20.31 | 4.43 | 0.22 | 6.066 | 5.94 | -10.8 |
| Sersic | 8.07 | 34.47 | 0.50 | |||||
| exp | 6.36 | 72.83 | ||||||
| NGC 3718 | Sersic | 8.45 | 17.37 | 5.50 | 1.23 | 7.761 | 7.77 | 0.8 |
| exp | 8.60 | 60.00 | ||||||
| NGC 3729 | Sersic | 10.89 | 8.41 | 2.91 | 2.35 | 8.729 | 8.66 | -6.1 |
| exp | 8.81 | 35.46 | ||||||
| NGC 3884 | Sersic | 11.02 | 2.69 | 3.84 | 0.04 | 9.405 | 9.37 | -3.0 |
| exp | 9.64 | 16.78 | ||||||
| NGC 4064 | Sersic | 9.64 | 17.05 | 1.52 | 0.05 | 8.559 | 8.52 | -3.4 |
| exp | 9.00 | 29.50 | ||||||
| NGC 4235 | Sersic | 10.48 | 2.73 | 3.45 | 6.80 | 8.396 | 8.63 | 24.2 |
| exp | 8.85 | 14.32 | ||||||
| NGC 4245 | Sersic | 9.00 | 10.80 | 3.35 | 0.01 | 8.311 | 8.19 | -10.9 |
| exp | 8.88 | 27.74 | ||||||
| NGC 4293 | Sersic | 8.79 | 31.70 | 5.50 | 0.46 | 7.479 | 7.43 | -4.8 |
| exp | 7.79 | 47.81 | ||||||
| NGC 4314 | Sersic | 8.76 | 10.80 | 2.18 | 28.50 | 7.559 | 7.60 | 3.4 |
| exp | 8.05 | 32.33 | ||||||
| NGC 4369 | Sersic | 10.61 | 4.99 | 0.99 | 0.03 | 8.915 | 8.92 | 0.7 |
| exp | 9.18 | 12.63 | ||||||
| NGC 4378 | Sersic | 9.33 | 5.90 | 3.12 | 0.06 | 8.510 | 8.46 | -4.3 |
| exp | 9.11 | 16.05 | ||||||
| NGC 4421 | Sersic | 9.50 | 18.32 | 5.10 | 0.02 | 8.796 | 8.61 | -15.8 |
| exp | 9.24 | 22.38 | ||||||
| NGC 4457 | Sersic | 8.41 | 5.91 | 4.09 | 0.03 | 7.777 | 7.66 | -10.0 |
| exp | 8.42 | 22.67 | ||||||
| NGC 4470 | Sersic | 11.91 | 8.61 | 0.70 | 0.05 | 10.123 | 9.91 | -17.6 |
| exp | 10.10 | 12.92 | ||||||
| NGC 4594 | Sersic | 6.05 | 35.71 | 5.35 | 1.16 | 4.962 | 5.00 | 3.6 |
| exp | 5.52 | 53.56 | ||||||
| NGC 4643 | Sersic | 7.66 | 18.89 | 3.84 | 0.01 | 7.413 | 7.33 | -7.2 |
| exp | 8.79 | 21.66 | ||||||
| NGC 4665 | Sersic | 8.73 | 9.71 | 2.88 | 0.01 | 7.426 | 7.14 | -23.1 |
| Sersic | 9.06 | 31.37 | 0.77 | |||||
| exp | 7.70 | 49.53 | ||||||
| NGC 4772 | Sersic | 8.76 | 16.11 | 5.50 | 0.06 | 8.358 | 8.12 | -19.6 |
| exp | 9.00 | 34.43 | ||||||
| NGC 5377 | Sersic | 9.49 | 5.51 | 2.67 | 0.01 | 8.358 | 8.25 | -9.3 |
| exp | 8.67 | 30.28 | ||||||
| NGC 5448 | Sersic | 10.58 | 3.20 | 1.95 | 0.06 | 8.794 | 8.68 | -9.8 |
| exp | 8.89 | 25.54 | ||||||
| NGC 5548 | Sersic | 10.20 | 1.55 | 5.49 | 0.08 | 9.387 | 9.60 | 22.1 |
| exp | 10.54 | 6.55 | ||||||
| NGC 5701 | Sersic | 8.92 | 15.19 | 4.59 | 0.05 | 8.141 | 8.06 | -7.4 |
| exp | 8.71 | 22.79 | ||||||
| NGC 6340 | Sersic | 9.77 | 4.80 | 3.42 | 0.05 | 8.391 | 8.38 | -0.6 |
| exp | 8.74 | 16.10 | ||||||
| NGC 6654 | Sersic | 9.92 | 3.60 | 3.14 | 19.53 | 8.593 | 8.70 | 10.6 |
| exp | 9.13 | 17.91 | ||||||
| NGC 718 | Sersic | 9.37 | 7.49 | 5.50 | 0.04 | 8.739 | 8.61 | -11.0 |
| exp | 9.36 | 18.47 | ||||||
| Sample B | ||||||||
| IC 356 | Sersic | 7.63 | 21.02 | 3.55 | 6.85 | 6.039 | 6.04 | -0.3 |
| exp | 6.32 | 47.43 | ||||||
| IC520 | Sersic | 9.79 | 7.77 | 5.50 | 0.02 | 8.723 | 8.65 | -6.4 |
| exp | 9.12 | 15.25 | ||||||
| NGC 2146 | Sersic | 7.27 | 21.81 | 2.66 | 0.90 | 7.063 | 7.01 | -4.8 |
| Sersic | 9.87 | 12.00 | 0.55 | |||||
| exp | 9.13 | 55.21 | ||||||
| NGC 266 | Sersic | 10.79 | 2.66 | 5.50 | 0.04 | 8.673 | 8.62 | -5.2 |
| Sersic | 10.72 | 3.36 | 1.00 | |||||
| exp | 8.97 | 20.97 | ||||||
| NGC 2775 | Sersic | 8.01 | 17.80 | 4.18 | 0.06 | 7.037 | 6.95 | -7.3 |
| exp | 7.47 | 27.90 | ||||||
| NGC 2985 | Sersic | 7.93 | 18.50 | 3.68 | 0.36 | 7.360 | 7.28 | -6.9 |
| exp | 8.15 | 35.19 | ||||||
| NGC 3368 | Sersic | 7.13 | 17.54 | 4.00 | 25.24 | 6.320 | 6.32 | -0.4 |
| exp | 7.01 | 33.00 | ||||||
| NGC 3504 | Sersic | 9.02 | 4.68 | 3.43 | 0.03 | 8.273 | 8.23 | -3.7 |
| exp | 8.95 | 23.42 | ||||||
| NGC 3705 | Sersic | 8.85 | 16.19 | 4.41 | 0.09 | 7.919 | 7.84 | -7.3 |
| exp | 9.21 | 22.58 | ||||||
| exp | 9.06 | 22.78 | ||||||
| NGC 3898 | Sersic | 8.08 | 14.29 | 4.91 | 0.11 | 7.655 | 7.62 | -3.3 |
| exp | 8.77 | 30.30 | ||||||
| NGC 4151 | Sersic | 7.89 | 8.82 | 4.00 | 2.40 | 7.381 | 7.12 | -21.3 |
| exp | 8.32 | 44.08 | ||||||
| NGC 4192 | Sersic | 9.03 | 7.81 | 2.15 | 0.70 | 6.888 | 6.90 | 1.6 |
| exp | 7.07 | 63.11 | ||||||
| NGC 1055 | Sersic | 9.21 | 24.50 | 2.40 | 2.18 | 7.151 | 7.02 | -11.2 |
| Sersic | 8.09 | 49.51 | 0.98 | |||||
| exp | 7.79 | 53.13 | ||||||
| NGC 1186 | Sersic | 10.43 | 10.75 | 5.50 | 0.05 | 8.494 | 8.37 | -10.5 |
| Sersic | 12.63 | 3.42 | 0.87 | |||||
| exp | 8.55 | 26.95 | ||||||
| NGC 2268 | Sersic | 10.30 | 5.20 | 5.50 | 0.05 | 8.587 | 8.55 | -3.5 |
| exp | 8.79 | 15.38 | ||||||
| NGC 2336 | Sersic | 10.25 | 6.38 | 1.59 | 7.67 | 7.702 | 7.74 | 3.3 |
| exp | 7.85 | 30.00 | ||||||
| NGC 2748 | Sersic | 10.61 | 7.12 | 3.18 | 3.51 | 8.778 | 8.79 | 1.5 |
| exp | 9.02 | 15.04 | ||||||
| NGC 2841 | Sersic | 7.36 | 16.65 | 3.86 | 9.65 | 6.062 | 6.00 | -5.9 |
| exp | 6.36 | 64.25 | ||||||
| NGC 3003 | Sersic | 12.17 | 7.92 | 0.87 | 0.02 | 9.481 | 9.48 | -0.5 |
| exp | 9.57 | 29.02 | ||||||
| NGC 3043 | Sersic | 11.98 | 9.98 | 0.82 | 0.05 | 10.450 | 10.35 | -8.4 |
| exp | 10.63 | 14.97 | ||||||
| NGC 3147 | Sersic | 8.91 | 5.82 | 3.66 | 0.91 | 7.409 | 7.44 | 2.6 |
| exp | 7.76 | 21.27 | ||||||
| NGC 3162 | Sersic | 11.58 | 5.52 | 5.50 | 0.01 | 9.472 | 9.34 | -11.3 |
| exp | 9.49 | 17.38 | ||||||
| NGC 3254 | Sersic | 10.09 | 8.19 | 2.12 | 0.03 | 8.802 | 8.77 | -3.0 |
| exp | 9.15 | 41.17 | ||||||
| NGC 3344 | Sersic | 9.50 | 17.30 | 5.50 | 4.10 | 7.437 | 7.17 | -22.1 |
| Sersic | 11.90 | 3.44 | 0.67 | |||||
| exp | 7.30 | 55.33 | ||||||
| NGC 3351 | Sersic | 8.07 | 12.80 | 1.77 | 0.34 | 6.665 | 6.63 | -3.5 |
| Sersic | 9.39 | 40.17 | 1.00 | |||||
| exp | 6.96 | 53.65 | ||||||
| NGC 3507 | Sersic | 10.45 | 6.06 | 4.00 | 0.04 | 8.384 | 8.17 | -18.0 |
| exp | 8.31 | 31.66 | ||||||
| NGC 3583 | Sersic | 9.91 | 6.10 | 5.50 | 0.06 | 8.377 | 8.34 | -3.6 |
| Sersic | 9.88 | 17.80 | 0.50 | |||||
| exp | 9.04 | 17.89 | ||||||
| NGC 3627 | Sersic | 7.61 | 15.70 | 4.72 | 3.60 | 5.881 | 5.75 | -11.2 |
| Sersic | 8.06 | 46.21 | 0.50 | |||||
| exp | 6.14 | 64.39 | ||||||
| NGC 3628 | Sersic | 7.48 | 53.83 | 4.49 | 0.80 | 6.074 | 6.04 | -3.4 |
| exp | 6.37 | 81.99 | ||||||
| NGC 3642 | Sersic | 10.49 | 4.32 | 5.50 | 0.10 | 8.973 | 8.97 | -0.1 |
| exp | 9.28 | 16.42 | ||||||
| NGC 3675 | Sersic | 9.01 | 9.59 | 5.50 | 0.16 | 6.855 | 6.82 | -2.8 |
| Sersic | 9.84 | 11.90 | 0.50 | |||||
| exp | 7.06 | 37.00 | ||||||
| NGC 3684 | Sersic | 11.14 | 10.70 | 2.46 | 14.58 | 9.280 | 9.22 | -5.6 |
| exp | 9.42 | 13.70 | ||||||
| NGC 3686 | Sersic | 11.12 | 8.77 | 4.00 | 0.03 | 8.488 | 8.11 | -29.4 |
| exp | 8.18 | 32.60 | ||||||
| NGC 3756 | Sersic | 13.53 | 8.66 | 5.50 | 0.04 | 8.779 | 8.40 | -29.4 |
| exp | 8.41 | 34.58 | ||||||
| NGC 3953 | Sersic | 9.38 | 6.10 | 2.73 | 0.44 | 7.047 | 6.95 | -8.3 |
| Sersic | 10.02 | 22.84 | 0.50 | |||||
| exp | 7.15 | 49.26 | ||||||
| NGC 3963 | Sersic | 11.29 | 7.30 | 3.40 | 0.04 | 9.296 | 9.16 | -11.4 |
| exp | 9.33 | 19.37 | ||||||
| NGC 3992 | Sersic | 9.30 | 13.44 | 5.50 | 1.85 | 6.937 | 6.81 | -11.2 |
| Sersic | 10.17 | 11.57 | 1.00 | |||||
| exp | 6.98 | 67.22 | ||||||
| NGC 4041 | Sersic | 9.21 | 8.96 | 1.42 | 0.17 | 8.414 | 8.47 | 5.5 |
| exp | 9.24 | 17.92 | ||||||
| NGC 4051 | Sersic | 9.11 | 6.10 | 5.50 | 0.48 | 7.670 | 7.53 | -12.0 |
| exp | 7.82 | 55.77 | ||||||
| Sample C | ||||||||
| IC 467 | Seric | 12.85 | 8.89 | 2.51 | 0.03 | 10.044 | 9.99 | -4.9 |
| exp | 10.07 | 20.22 | ||||||
| NGC 514 | Seric | 12.50 | 3.20 | 3.40 | 0.06 | 9.144 | 9.04 | -8.8 |
| exp | 9.09 | 27.09 | ||||||
| NGC 628 | Seric | 9.37 | 12.43 | 1.35 | 0.61 | 6.845 | 6.68 | -14.5 |
| exp | 6.77 | 63.54 | ||||||
| NGC 783 | Seric | 11.61 | 2.23 | 3.42 | 0.02 | 9.680 | 9.54 | -11.7 |
| exp | 9.72 | 15.55 | ||||||
| NGC 818 | Seric | 12.31 | 1.80 | 2.84 | 0.05 | 9.415 | 9.37 | -3.6 |
| exp | 9.45 | 11.93 | ||||||
| NGC 864 | Seric | 11.48 | 15.60 | 4.68 | 0.70 | 8.528 | 8.33 | -16.8 |
| exp | 8.39 | 40.82 | ||||||
| NGC 1667 | Seric | 10.87 | 4.72 | 5.50 | 0.06 | 8.898 | 8.85 | -4.6 |
| exp | 9.03 | 10.38 | ||||||
| NGC 1961 | Seric | 9.74 | 5.80 | 3.09 | 0.79 | 7.730 | 7.83 | 10.1 |
| exp | 8.04 | 19.40 | ||||||
| NGC 2276 | Seric | 11.83 | 2.90 | 0.78 | 0.07 | 9.077 | 8.99 | -7.9 |
| exp | 9.07 | 17.54 | ||||||
| NGC 2715 | Seric | 12.18 | 15.20 | 5.50 | 0.20 | 8.595 | 8.50 | -8.2 |
| exp | 8.54 | 30.61 | ||||||
| NGC 2750 | Seric | 11.04 | 3.33 | 5.50 | 0.02 | 9.672 | 9.53 | -12.3 |
| exp | 9.84 | 25.19 | ||||||
| NGC 2770 | Seric | 13.16 | 6.15 | 4.51 | 0.40 | 9.573 | 9.56 | -1.2 |
| exp | 9.60 | 18.44 | ||||||
| NGC 2776 | Seric | 11.88 | 3.23 | 2.22 | 5.79 | 9.131 | 9.17 | 3.4 |
| exp | 9.26 | 12.91 | ||||||
| NGC 2967 | Seric | 11.97 | 8.44 | 3.49 | 2.16 | 8.883 | 8.88 | -0.7 |
| exp | 8.94 | 13.48 | ||||||
| NGC 3041 | Seric | 11.76 | 4.50 | 1.25 | 0.04 | 8.738 | 8.63 | -9.7 |
| exp | 8.69 | 33.95 | ||||||
| NGC 3198 | Seric | 10.25 | 14.17 | 5.12 | 0.15 | 7.779 | 7.69 | -7.7 |
| exp | 7.80 | 56.68 | ||||||
| NGC 3338 | Seric | 10.23 | 11.50 | 3.57 | 2.35 | 8.131 | 7.99 | -12.0 |
| exp | 8.14 | 43.51 | ||||||
| NGC 3359 | Seric | 10.52 | 22.85 | 1.29 | 0.07 | 8.621 | 8.61 | -1.4 |
| exp | 8.81 | 35.36 | ||||||
| NGC 3367 | Seric | 11.45 | 4.52 | 5.50 | 8.63 | 8.755 | 8.77 | 1.0 |
| exp | 10.12 | 11.75 | ||||||
| exp | 9.27 | 32.85 | ||||||
| NGC 3370 | Seric | 9.93 | 13.83 | 2.47 | 0.03 | 9.426 | 9.23 | -16.4 |
| exp | 10.04 | 20.74 | ||||||
| NGC 3430 | Seric | 11.85 | 3.90 | 4.71 | 0.03 | 8.896 | 8.79 | -9.1 |
| exp | 8.86 | 20.73 | ||||||
| NGC 3433 | Seric | 12.46 | 3.06 | 1.24 | 0.01 | 9.676 | 9.32 | -28.1 |
| exp | 9.38 | 23.02 | ||||||
| NGC 3486 | Seric | 9.27 | 17.79 | 4.88 | 0.05 | 8.002 | 8.07 | 6.7 |
| exp | 8.51 | 23.67 | ||||||
| NGC 3596 | Seric | 10.63 | 9.08 | 4.16 | 0.06 | 8.697 | 8.58 | -10.1 |
| exp | 8.76 | 22.38 | ||||||
| NGC 3631 | Seric | 9.45 | 7.24 | 1.76 | 0.10 | 7.985 | 7.86 | -11.2 |
| exp | 8.14 | 44.99 | ||||||
| NGC 3655 | Seric | 10.27 | 6.89 | 4.26 | 0.05 | 8.829 | 8.83 | 0.4 |
| exp | 9.17 | 9.89 | ||||||
| NGC 3666 | Seric | 12.84 | 6.18 | 5.50 | 1.19 | 9.228 | 9.37 | 14.4 |
| exp | 9.42 | 11.55 | ||||||
| NGC 3726 | Seric | 10.96 | 12.76 | 3.69 | 0.12 | 7.777 | 7.62 | -13.6 |
| exp | 7.67 | 51.04 | ||||||
| NGC 3735 | Seric | 10.38 | 4.90 | 1.46 | 2.31 | 8.453 | 8.46 | 0.4 |
| exp | 8.66 | 21.96 | ||||||
| NGC 3780 | Seric | 12.51 | 8.40 | 4.02 | 0.04 | 9.037 | 8.75 | -23.5 |
| exp | 8.78 | 23.13 | ||||||
| NGC 3810 | Seric | 9.09 | 18.30 | 3.94 | 0.06 | 7.952 | 7.89 | -5.4 |
| exp | 8.33 | 24.80 | ||||||
| NGC 3877 | Seric | 9.94 | 7.50 | 3.32 | 1.76 | 7.746 | 7.67 | -6.5 |
| exp | 8.80 | 39.58 | ||||||
| exp | 8.38 | 39.53 | ||||||
| NGC 3893 | Seric | 8.82 | 21.23 | 2.97 | 0.00 | 7.891 | 7.81 | -6.9 |
| exp | 8.43 | 35.84 | ||||||
| exp | 8.36 | 25.48 | ||||||
| NGC 3938 | Seric | 10.52 | 6.49 | 1.41 | 0.05 | 7.809 | 7.77 | -3.5 |
| exp | 7.86 | 30.32 | ||||||
| NGC 4062 | Seric | 11.27 | 10.60 | 4.36 | 0.04 | 8.213 | 7.93 | -23.0 |
| exp | 7.98 | 38.58 | ||||||
| NGC 4096 | Seric | 10.15 | 11.90 | 2.04 | 2.08 | 7.806 | 7.75 | -4.7 |
| exp | 7.88 | 51.22 | ||||||
| NGC 4123 | Seric | 10.72 | 4.28 | 5.50 | 0.05 | 8.792 | 8.61 | -15.3 |
| exp | 8.78 | 41.00 | ||||||
| NGC 4136 | Seric | 11.83 | 11.06 | 3.15 | 0.02 | 9.307 | 9.08 | -18.9 |
| exp | 9.17 | 28.24 | ||||||
| NGC 4152 | Seric | 11.70 | 3.10 | 2.51 | 0.03 | 9.629 | 9.58 | -4.1 |
| exp | 9.75 | 9.70 | ||||||
| NGC 4212 | Seric | 10.91 | 6.00 | 5.50 | 0.06 | 8.375 | 8.02 | -27.8 |
| exp | 8.10 | 27.25 |
Note. — Col.(1): Galaxy name. Col.(2): Profile function. Col.(3): Bulge magnitude with the average formal error about 1.4% of the disk magnitude with the average formal error about 0.7%. Col.(4): , half-light effective radius for the bulge component, with the average formal error about 9.3% ; , scale length for the disk component, with the average formal error about 2%; in units of arcsec. Col.(5): Sérsic index. Col.(6): . Col.(7): total magnitude from 2MASS, with the average error about 0.027 mag. Col.(8): total magnitude of the model. Col.(9): Residual flux, .
| Galaxy Name | ||||||
|---|---|---|---|---|---|---|
| (mag) | (mag) | (kpc) | (mag) | (kpc) | ||
| (1) | (2) | (3) | (4) | (5) | (6) | (7) |
| Sample A | ||||||
| NGC 1358 | -24.6 | -23.3 | 1.17 | -23.9 | 5.51 | 8.0 |
| NGC 2273 | -23.6 | -22.5 | 0.50 | -23.2 | 2.15 | 7.6 |
| NGC 2639 | -24.6 | -23.0 | 1.70 | -24.3 | 2.07 | 7.9 |
| NGC 2655 | -24.8 | -24.3 | 2.34 | -23.8 | 5.06 | 8.5 |
| NGC 2782 | -23.8 | -22.6 | 0.63 | -23.5 | 2.76 | 7.7 |
| NGC 3166 | -24.4 | -23.4 | 0.64 | -23.4 | 4.24 | 8.0 |
| NGC 3169 | -24.0 | -23.8 | 1.50 | -22.9 | 4.27 | 8.2 |
| NGC 3185 | -22.4 | -20.8 | 0.51 | -22.2 | 2.34 | 6.9 |
| NGC 3190 | -24.2 | -23.6 | 1.55 | -22.8 | 3.93 | 8.1 |
| NGC 3227 | -23.8 | -22.1 | 0.51 | -23.5 | 3.65 | 7.5 |
| NGC 3301 | -23.2 | -22.3 | 0.51 | -22.6 | 1.92 | 7.5 |
| NGC 3593 | -21.1 | -20.7 | 0.50 | -20.3 | 1.77 | 6.8 |
| NGC 3600 | -19.8 | -19.2 | 0.53 | -19.5 | 1.68 | 6.1 |
| NGC 3623 | -23.1 | -21.4 | 0.72 | -22.8 | 2.58 | 7.1 |
| NGC 3718 | -23.3 | -22.6 | 1.43 | -22.4 | 4.95 | 7.7 |
| NGC 3729 | -22.3 | -20.1 | 0.69 | -22.2 | 2.92 | 6.6 |
| NGC 3884 | -25.3 | -23.6 | 1.19 | -25.0 | 7.45 | 8.1 |
| NGC 4064 | -22.4 | -21.4 | 1.40 | -22.0 | 2.42 | 7.1 |
| NGC 4235 | -24.2 | -22.1 | 0.46 | -23.7 | 2.44 | 7.4 |
| NGC 4245 | -21.5 | -20.8 | 0.51 | -20.9 | 1.30 | 6.9 |
| NGC 4293 | -23.5 | -22.2 | 2.61 | -23.2 | 3.94 | 7.5 |
| NGC 4314 | -22.2 | -21.0 | 0.51 | -21.7 | 1.52 | 7.0 |
| NGC 4369 | -22.6 | -20.9 | 0.52 | -22.4 | 1.32 | 6.9 |
| NGC 4378 | -24.1 | -23.3 | 1.00 | -23.5 | 2.73 | 8.0 |
| NGC 4421 | -22.2 | -21.5 | 1.49 | -21.7 | 1.82 | 7.2 |
| NGC 4457 | -23.3 | -22.7 | 0.50 | -22.6 | 1.91 | 7.7 |
| NGC 4470 | -22.2 | -20.4 | 1.31 | -22.2 | 1.97 | 6.7 |
| NGC 4594 | -26.4 | -25.3 | 3.46 | -25.8 | 5.19 | 8.9 |
| NGC 4643 | -24.5 | -24.2 | 2.35 | -23.1 | 2.70 | 8.4 |
| NGC 4665 | -23.7 | -22.4 | 0.84 | -23.4 | 4.30 | 7.6 |
| NGC 4772 | -22.6 | -22.2 | 1.27 | -21.9 | 2.72 | 7.5 |
| NGC 5377 | -24.0 | -22.8 | 0.83 | -23.6 | 4.55 | 7.8 |
| NGC 5448 | -23.6 | -21.8 | 0.51 | -23.5 | 4.04 | 7.3 |
| NGC 5548 | -24.6 | -23.8 | 0.50 | -23.5 | 2.13 | 8.2 |
| NGC 5701 | -23.8 | -23.0 | 1.92 | -23.2 | 2.88 | 7.9 |
| NGC 6340 | -23.2 | -21.8 | 0.51 | -22.8 | 1.72 | 7.3 |
| NGC 6654 | -23.6 | -22.3 | 0.51 | -23.1 | 2.56 | 7.5 |
| NGC 718 | -22.8 | -22.1 | 0.78 | -22.2 | 1.92 | 7.5 |
| Sample B | ||||||
| IC 356 | -25.1 | -23.5 | 1.84 | -24.8 | 4.16 | 8.1 |
| IC520 | -24.5 | -23.4 | 1.77 | -24.1 | 3.47 | 8.0 |
| NGC 2146 | -24.0 | -23.8 | 1.82 | -21.9 | 4.60 | 8.2 |
| NGC 266 | -25.2 | -23.0 | 0.80 | -24.9 | 6.34 | 7.9 |
| NGC 2775 | -24.0 | -23.0 | 1.47 | -23.5 | 2.30 | 7.9 |
| NGC 2985 | -24.3 | -23.7 | 2.01 | -23.5 | 3.82 | 8.2 |
| NGC 3368 | -23.1 | -22.3 | 0.69 | -22.4 | 1.30 | 7.5 |
| NGC 3504 | -23.7 | -23.0 | 0.60 | -23.0 | 3.01 | 7.8 |
| NGC 3705 | -23.1 | -22.2 | 1.33 | -22.0 | 1.88 | 7.5 |
| NGC 3898 | -23.9 | -23.5 | 1.52 | -22.8 | 3.22 | 8.1 |
| NGC 4151 | -24.0 | -23.5 | 0.87 | -23.1 | 4.34 | 8.1 |
| NGC 4192 | -24.1 | -22.0 | 0.64 | -23.9 | 5.14 | 7.4 |
| NGC 1055 | -23.2 | -21.2 | 1.50 | -22.6 | 3.25 | 7.0 |
| NGC 1186 | -24.1 | -22.2 | 1.84 | -24.1 | 4.63 | 7.5 |
| NGC 2268 | -24.0 | -22.2 | 0.87 | -23.8 | 2.57 | 7.5 |
| NGC 2336 | -24.8 | -22.3 | 1.05 | -24.7 | 4.93 | 7.5 |
| NGC 2748 | -23.0 | -21.1 | 0.82 | -22.7 | 1.74 | 7.0 |
| NGC 2841 | -24.2 | -22.9 | 0.97 | -23.9 | 3.74 | 7.8 |
| NGC 3003 | -22.3 | -19.6 | 0.94 | -22.2 | 3.43 | 6.3 |
| NGC 3043 | -22.4 | -20.8 | 1.89 | -22.2 | 2.84 | 6.9 |
| NGC 3147 | -25.5 | -24.0 | 1.15 | -25.2 | 4.22 | 8.3 |
| NGC 3162 | -22.1 | -20.0 | 0.59 | -22.1 | 1.87 | 6.5 |
| NGC 3254 | -22.9 | -21.6 | 0.94 | -22.6 | 4.71 | 7.2 |
| NGC 3344 | -21.3 | -19.3 | 0.51 | -21.5 | 1.64 | 6.2 |
| NGC 3351 | -22.7 | -21.3 | 0.50 | -22.4 | 2.11 | 7.1 |
| NGC 3507 | -23.0 | -20.9 | 0.58 | -23.0 | 3.04 | 6.9 |
| NGC 3583 | -24.1 | -22.6 | 1.01 | -23.5 | 2.95 | 7.7 |
| NGC 3627 | -23.1 | -21.3 | 0.50 | -22.8 | 2.06 | 7.1 |
| NGC 3628 | -23.2 | -21.8 | 2.01 | -22.9 | 3.06 | 7.3 |
| NGC 3642 | -23.1 | -21.6 | 0.58 | -22.8 | 2.19 | 7.2 |
| NGC 3675 | -23.5 | -21.4 | 0.60 | -23.3 | 2.30 | 7.1 |
| NGC 3684 | -22.4 | -20.6 | 1.21 | -22.3 | 1.55 | 6.8 |
| NGC 3686 | -23.2 | -20.6 | 1.00 | -23.5 | 3.71 | 6.8 |
| NGC 3756 | -22.9 | -18.2 | 0.99 | -23.3 | 3.94 | 5.7 |
| NGC 3953 | -24.0 | -21.6 | 0.50 | -23.9 | 4.06 | 7.2 |
| NGC 3963 | -23.7 | -21.7 | 1.51 | -23.7 | 4.01 | 7.3 |
| NGC 3992 | -24.1 | -21.7 | 1.11 | -24.0 | 5.54 | 7.3 |
| NGC 4041 | -23.2 | -22.4 | 0.99 | -22.4 | 1.97 | 7.6 |
| NGC 4051 | -23.3 | -21.9 | 0.50 | -23.2 | 4.60 | 7.4 |
| Sample C | ||||||
| IC 467 | -22.0 | -19.2 | 1.18 | -22.0 | 2.69 | 6.1 |
| NGC 514 | -23.3 | -19.9 | 0.50 | -23.3 | 4.26 | 6.5 |
| NGC 628 | -22.9 | -20.4 | 0.58 | -23.0 | 2.99 | 6.7 |
| NGC 783 | -24.3 | -22.4 | 0.74 | -24.3 | 5.13 | 7.6 |
| NGC 818 | -24.3 | -21.4 | 0.52 | -24.3 | 3.44 | 7.1 |
| NGC 864 | -22.8 | -19.9 | 1.51 | -23.0 | 3.96 | 6.4 |
| NGC 1667 | -24.9 | -22.9 | 1.40 | -24.8 | 3.08 | 7.8 |
| NGC 1961 | -25.8 | -23.7 | 1.49 | -25.4 | 4.99 | 8.2 |
| NGC 2276 | -23.6 | -20.9 | 0.52 | -23.6 | 3.13 | 6.9 |
| NGC 2715 | -22.8 | -19.2 | 1.50 | -22.9 | 3.03 | 6.2 |
| NGC 2750 | -23.1 | -21.7 | 0.62 | -22.9 | 4.69 | 7.3 |
| NGC 2770 | -22.6 | -19.1 | 0.88 | -22.6 | 2.65 | 6.1 |
| NGC 2776 | -23.7 | -20.9 | 0.61 | -23.5 | 2.42 | 6.9 |
| NGC 2967 | -23.4 | -20.3 | 1.26 | -23.4 | 2.02 | 6.7 |
| NGC 3041 | -22.9 | -19.9 | 0.50 | -23.0 | 3.75 | 6.5 |
| NGC 3198 | -22.2 | -19.8 | 0.74 | -22.2 | 2.97 | 6.4 |
| NGC 3338 | -23.5 | -21.4 | 1.27 | -23.5 | 4.81 | 7.1 |
| NGC 3359 | -22.7 | -20.8 | 2.13 | -22.5 | 3.29 | 6.8 |
| NGC 3367 | -24.3 | -21.6 | 0.96 | -22.9 | 2.48 | 7.2 |
| NGC 3370 | -22.3 | -21.8 | 1.57 | -21.7 | 2.35 | 7.3 |
| NGC 3430 | -23.1 | -20.1 | 0.50 | -23.1 | 2.68 | 6.6 |
| NGC 3433 | -23.2 | -20.4 | 0.59 | -23.5 | 4.41 | 6.7 |
| NGC 3486 | -21.2 | -19.9 | 0.64 | -20.7 | 0.85 | 6.5 |
| NGC 3596 | -23.0 | -21.0 | 1.01 | -22.9 | 2.50 | 7.0 |
| NGC 3631 | -23.5 | -22.1 | 0.76 | -23.4 | 4.71 | 7.4 |
| NGC 3655 | -23.1 | -21.7 | 0.89 | -22.8 | 1.27 | 7.3 |
| NGC 3666 | -21.8 | -18.2 | 0.51 | -21.6 | 0.95 | 5.7 |
| NGC 3726 | -23.2 | -20.1 | 1.05 | -23.3 | 4.21 | 6.5 |
| NGC 3735 | -24.5 | -22.5 | 0.97 | -24.3 | 4.37 | 7.6 |
| NGC 3780 | -23.7 | -20.2 | 1.51 | -23.9 | 4.17 | 6.6 |
| NGC 3810 | -23.0 | -21.9 | 1.50 | -22.7 | 2.03 | 7.4 |
| NGC 3877 | -23.3 | -21.1 | 0.62 | -22.6 | 3.26 | 7.0 |
| NGC 3893 | -23.1 | -22.2 | 1.75 | -22.7 | 2.10 | 7.5 |
| NGC 3938 | -23.2 | -20.5 | 0.53 | -23.2 | 2.50 | 6.7 |
| NGC 4062 | -21.6 | -18.5 | 0.50 | -21.8 | 1.81 | 5.8 |
| NGC 4096 | -21.8 | -19.4 | 0.51 | -21.7 | 2.19 | 6.2 |
| NGC 4123 | -23.1 | -21.2 | 0.52 | -23.1 | 5.03 | 7.0 |
| NGC 4136 | -20.5 | -18.0 | 0.52 | -20.6 | 1.33 | 5.6 |
| NGC 4152 | -22.9 | -20.8 | 0.52 | -22.8 | 1.62 | 6.9 |
| NGC 4212 | -22.6 | -20.1 | 0.49 | -22.9 | 2.22 | 6.5 |
Note. — Col.(1): Galaxy name. Col.(2): Absolute magnitude in band for the total galaxy. Col.(3): Absolute magnitude in band for the galaxy bulge. Col.(4): Half-light radius of the bulge in units of kpc. Col.(5): Absolute magnitude in band for the galaxy disk. Col.(6): Scale length of the disk in units of kpc. Col.(7): Estimated BH mass.
| X | Y | SLOPE | INTERCEPT | r | P |
|---|---|---|---|---|---|
| (uncertainty) | (uncertainty) | ||||
| Log10(MBH/M⊙) | Log10(FWHM([N
II |
0.24(0.03) | 0.50(0.19) | 0.69 | 9.4 |
| Log10(MBH/M⊙) | Log10([O
III |
0.39(0.08) | -2.9(0.58) | 0.49 | 4.8 |
| Log10(MBH/M⊙) | Log10([O
I |
0.58(0.09) | -5.4(0.63) | 0.63 | 4.1 |
| Log10(MBH/M⊙) | Log10([S
II |
0.26(0.04) | -2.2(0.29) | 0.55 | 8.5 |
| Log10(MBH/M⊙) | Log10([N
II |
0.33(0.03) | -2.5(0.25) | 0.69 | 9.6 |
| Log10(MBH/M⊙) | Log10 | 0.30(0.07) | 0.20(0.48) | 0.44 | 1.5 |
| Log10(MBH/M⊙) | Log10 | 0.34(0.08) | 0.01(0.55) | 0.43 | 2.0 |
| Log10(MBH/M⊙) | Log10 | 0.23(0.08) | 1.6(0.56) | 0.28 | 3.6 |
| Log10(MBH/M⊙) | Log10 | 0.23(0.07) | 2.0(0.51) | 0.30 | 1.3 |
| Log10(MBH/M⊙) | Log10 | 0.46(0.13) | 35(0.92) | 0.38 | 5.1 |
| Log10(MBH/M⊙) | 135(20) | -558(141) | 0.61 | 7.81 | |
| Log10(FWHM([N
II |
Log10([O
III |
1.5(0.17) | -3.4(0.41) | 0.65 | 4.1 |
| Log10(FWHM([N
II |
Log10([O
I |
1.8(0.15) | -5.3(0.28) | 0.77 | 3.6 |
| Log10(FWHM([N
II |
Log10([S
II |
1.1(0.09) | -2.5(0.23) | 0.73 | 2.6 |
| Log10(FWHM([N
II |
Log10([N
II |
0.99(0.08) | -2.5(0.17) | 0.78 | 1.2 |
Note. — Col.(1): X dataset when calculating the correlations. Col.(2): Y dataset when calculating the correlations. Col.(3): Slope for the linear least-squares fitting. Col.(4): Intercept for the linear least-squares fitting. Col.(5): Correlation coefficient. Col.(6): Significance level or probability.
| (A,B) | (A,C) | (B,C) | |
|---|---|---|---|
| MBH/M⊙ | 0.42 | ||
| Mbul | 0.29 | ||
| Mdisk | 0.63 | 0.88 | 0.47 |
| Mtot | 0.42 | 0.05 | 0.02 |
| 0.15 | 0.07 | 0.02 | |
| Log10 | 0.60 | 0.05 | 0.17 |
| Log10 | 0.91 | ||
| Log10 | 0.06 | 0.01 | 0.81 |
| Log10 | 0.63 | ||
| Log10 | 0.83 | ||
| Log10 | 0.46 | ||
| 0.55 | 0.40 | 0.69 | |
| 0.47 | 0.98 | 0.27 | |
| 0.15 | 0.02 | 0.13 | |
| FWHM([N
II |
|||
| [O
III |
0.15 | ||
| [O
I |
|||
| [S
II |
|||
| [N
II |
0.04 | ||
| 0.13 | 0.20 | 0.87 | |
| W (G band) | 0.69 | 0.01 | 0.05 |
| 0.19 | 0.14 | 0.44 | |
| 0.54 | 0.07 | 0.09 | |
| (inclination) | 1.0 | 0.91 | 0.51 |
| (distance) | 0.98 | 0.52 | 0.53 |
Note. — Col.(1): Parameter name. Col.(2): Significance of the difference between the distributions of Sample A and Sample B. Col.(3): Significance of the difference between the distributions of Sample A and Sample C. Col.(4): Significance of the difference between the distributions of Sample B and Sample C. If , the two distributions are significantly different.
| Log) | Mbul | (Sa+Sb)/(Sc) |
|---|---|---|
| 6.00 | -18.87 | 1.01 |
| 6.25 | -19.43 | 1.06 |
| 6.50 | -19.98 | 1.20 |
| 6.75 | -20.54 | 1.58 |
| 7.00 | -21.09 | 2.52 |
| 7.25 | -21.65 | 4.63 |
| 7.50 | -22.20 | 8.97 |
| 7.75 | -22.76 | 16.69 |
| 8.00 | -23.31 | 28.12 |
Note. — Col.(1): Central BH mass. Col. (2): Absolute bulge magnitude. Col (3): Ratio of the space densities of Sa+Sb galaxies to Sc galaxies with bulges as bright or brighter, or equivalently, with black hole masses as large or larger, than listed.