Probable member stars of the gravitational theory-testing globular clusters AM 1, Pal 3 and Pal 14††thanks: Based on observations obtained at the European Southern Observatory, Chile (Observing Programme 074.D–0187).
Some of the Galactic outer halo globular clusters are excellent tools to probe gravitational theories in the regime of weak accelerations (Baumgardt et al. baum05 (2005)). The measurement of the line-of-sight velocity dispersion among stars in these clusters will differentiate between the validity of Newtonian dynamics (low velocity dispersion) and the possiblity of modified Newtonian dynamics (MOND) or dark matter dominated globular clusters (high velocity dispersion). In this paper, the properties of probable member stars of the three best-case gravitational theory-testing clusters AM 1, Pal 3 and Pal 14 are presented. The member selection is based on VLT photometry in Johnson . The positions of the stars were determined with an accuracy of the order , allowing their direct use for follow-up spectroscopy. The distance, reddening, age, and metallicities of the clusters were estimated from isochrone fitting. Furthermore, improved structural parameters, like central coordinates, ellipticity, half-light radius, King model core and tidal radius, are presented.
Key Words.:
globular clusters: individual: AM 1, Pal 3, Pal 14 – astrometry — galaxy: kinematics and dynamics1 Introduction
In the distant halo of our Milky Way there exist several low mass, often diffuse globular clusters (GCs). Most of these outer halo GCs belong to the so-called ‘young halo clusters’, comprising about 30 Milky Way GCs (e.g. Zinn zinn93 (1993), Mackey & Gilmore mack04 (2004)). From their horizontal branch morphology it was estimated that they are about 1-2 Gyr younger than the ‘old halo clusters’. Also they have on average larger half-light radii than the inner halo GCs (Mackey & van den Bergh mack05 (2005)). The similarity of their properties to those of external globular clusters (belonging to Milky Way satellite galaxies) led to the idea that they were accreted into the Galactic halo (e.g. van den Bergh & Mackey vdbe04 (2004), originally proposed by Searle & Zinn sear78 (1978)). The most remote halo GCs (at galacto-centric distances of kpc) live on eccentric orbits, mostly undisturbed from external tidal forces of our Galaxy.
Recently, it has been proposed by Baumgardt et al. (baum05 (2005)) that some of these distant Galactic globular clusters are excellent tools to probe gravitational theories in the regime of very weak accelerations. Their internal and external accelerations both are significantly below the critical acceleration parameter of modified Newtonian dynamics (MOND, Milgrom milg83 (1983), Bekenstein & Milgrom beke84 (1984)). In case of MOND the internal velocity dispersion among the stars in these clusters would be significantly higher than in the Newtonian standard dynamics. A higher than Newtonian velocity dispersion could also be explained by the existence of dark matter in globular clusters (e.g. Mashchenko & Sills mash05 (2005)). The line-of-sight velocity dispersion of the 8 gravitational theory-testing GCs listed by Baumgardt et al. (baum05 (2005)) is expected to range between 0.5 and 1.1 km2/sec2 in the Newtonian case, whereas two times higher values (1.1 to 2.4 km2/sec2) are predicted for MOND. Such velocity differences can be measured with existing high resolution spectrographs, providing the observation of a statistical meaningful sample (-30) of stars.
However, at the distance of the proposed GCs of between 28 and 122 kpc, high resolution spectroscopic observations of these feeble, low mass clusters are challenging. There exist only few evolved stars that are bright enough to be observed in reasonable integration times with 8-meter class telescopes. Therefore, it is very useful to know the positions and photometric properties of these bright member stars beforehand.
| Name | (2000)a | (2000)a | Date | Exposure times [s] | Seeing [′′] | Airmass | |||
|---|---|---|---|---|---|---|---|---|---|
| [h:m:s] | [∘:′:′′] | ||||||||
| AM 1-N | 03:55:02.6 | 49:34:41.9 | 2005 Feb 15 | 0.6 | 0.7 | 1.20 | 1.20 | ||
| AM 1-S | 03:55:02.6 | 49:38:42.0 | 2005 Feb 16 | 0.6 | 0.6 | 1.21 | 1.22 | ||
| Pal 3-N | 10:05:31.4 | 00:06:25.9 | 2005 Feb 15 | 0.6 | 0.7 | 1.24 | 1.23 | ||
| Pal 3-S | 10:05:31.4 | 00:02:26.0 | 2005 Feb 15 | 0.5 | 0.5 | 1.22 | 1.21 | ||
| Pal 14-N | 16:11:05.0 | 14:59:38.0 | 2005 Feb 15 | 0.6 | 0.7 | 1.46 | 1.45 | ||
| Pal 14-S | 16:11:05.0 | 14:55:37.9 | 2005 Feb 15 | 0.5 | 0.6 | 1.43 | 1.42 | ||
aThe coordinates indicate the pointing of the observations
For three of the Baumgardt-sample GCs we present those properties in this paper, namely AM 1, Pal 3 and Pal 14. These clusters were selected because they are expected to show the largest differences between Newtonian and MOND dynamics. They are therefore the best cases for testing gravitational theories. Their basic parameters are given in the Tables 3 and 4 (most of these parameters were taken from the 2003 version of Harris’ list harr96 (1996)). All three clusters belong to the ’young halo’ GCs with iron abundances between and dex, and half-light radii in the range 17-25 pc. An age estimate for Pal 3 was derived from the detailed study of the colour magnitude diagram, especially the horizontal branch (HB) morphology. It seems that Pal 3 is between 1 Gyr (VandenBerg vand00 (2000), Catelan et al. cate01 (2001)) and 2 Gyr (Stetson et al. stet99 (1999)) younger than ordinary inner halo GCs like M 3. Also for Pal 14 a 3 to 4 Gyr younger age than for typical GCs was estimated from the position of the main sequence turnoff (MSTO) relative to the HB level (Sarajedini sara97 (1997)).
| Chip | Filter | zero point | ext. coeff. | colour term |
|---|---|---|---|---|
| chip1 | 27.8520.002 | 0.011 | 0.0340.008 | |
| 27.2950.009 | 0.016 | 0.006 | ||
| chip2 | 27.8410.012 | 0.018 | 0.0200.004 | |
| 27.2980.008 | 0.016 | 0.006 |
In this paper, we provide accurate positions, magnitudes and colours of the evolved stars in the three clusters AM 1, Pal 3 and Pal 14. This photometry is necessary and very useful for spectroscopic follow-up observations of these best-case gravitational theory-testing clusters.
2 Observations and data reduction
The observations were performed in February 2005 with the VLT/UT1 at Paranal (ESO), Chile. The instrument in use was the FORS2 camera with a 44 k MIT CCD array attached. The data were read out with a 22 binning, resulting in a spatial scale of 0.25′′/pixel and a field of view of .
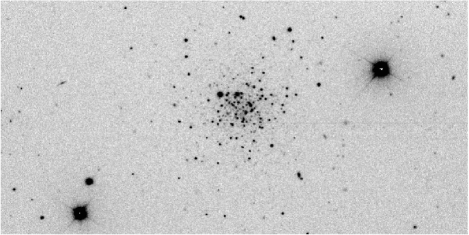
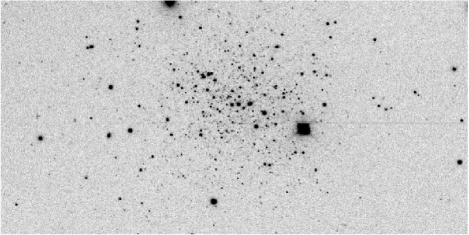
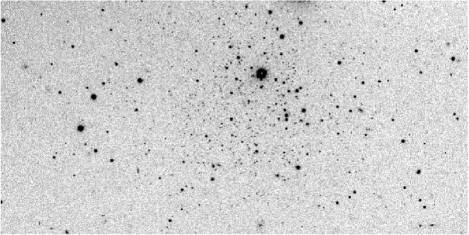
Each of the three globular clusters AM 1, Pal 3 and Pal 14 was observed through the Johnson and filters under mostly photometric and very good seeing conditions at two slightly different positions. Once, centering the cluster on the ‘master’ 42 k chip (also called “chip1”), and once on the ‘slave’ 42 k chip (“chip2”) of the 12 CCD array. Excerpts of the exposures on the ‘master’ chip are shown in Fig. 1. The exposure times were chosen such that the brightest cluster red giants were not saturated. Three dithered integrations per filter and field were taken. For an observation log see Table 1.
The CCD frames were processed with standard IRAF routines. After bias subtraction and flatfield correction, the pixel shifts of the dithered images have been determined. Then the shift corrected frames have been averaged using a clipping algorithm to exclude cosmics.
3 Photometry and astrometry
3.1 Photometry
The instrumental magnitudes of the stars were derived from PSF (point spread function) photometry using DAOPHOT II (Stetson stet87 (1987), stet92 (1992)). For the comparison with the standard stars, aperture–PSF shifts have been determined in all fields and filters. The amplitude of this shift ranges between 0.20 and 0.44 mag, its uncertainty is of the order of 0.02 mag.
In the first night, Landolt standard stars have been observed. The coefficients of the calibration equation were taken from the ESO quality control program (see http://www.eso.org/observing/dfo/quality/index_fors2.html). An overview of the calibration coefficients is given in Table 2.
The calibrated magnitudes of stars in the overlapping regions of the North and South fields have been compared with each other. Shifts of the order of mag have been found between the data sets. This is consistent with the uncertainty in the aperture–PSF shift, but could also have been caused by the not totally photometric conditions during the observing run. Thus, the data set which was observed under better photometric conditions has been taken as reference system for each cluster, and the magnitudes of the other set have been shifted to this system. The magnitudes of stars that were measured in both data sets then have been averaged for the final catalog.
After the photometric reduction, calibration of the magnitudes, and combining of the data sets, the average photometric errors for red giants at were of the order of 0.08 in and 0.12 mag in .
3.2 Astrometry
The positions of the cluster stars in terms of right ascension and declination (epoch J2000) were determined by deriving an astrometric solution between pixel and RA/Dec coordinates for stars of the US Naval Observatory (USNO) in the field-of-view. Each CCD chip has been considered separately. Typically, between 60 and 80 USNO catalog stars were identified in chip1, and 40-60 in chip2. The IRAF task GEOMAP was used to find the astrometric solution. A ‘general’ fit with full cross-terms of second order turned out to give the best results. The rms of the fit in right ascension is for AM 1 and Pal 14, and for Pal 3. The accuracy in declination is , , and for AM 1, Pal 14, and Pal 3, respectively.
4 Distance, reddening, age and metallicity
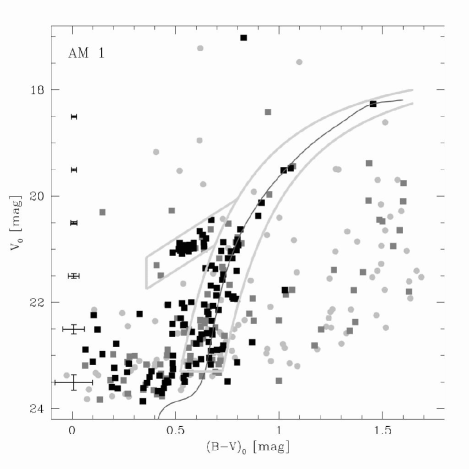
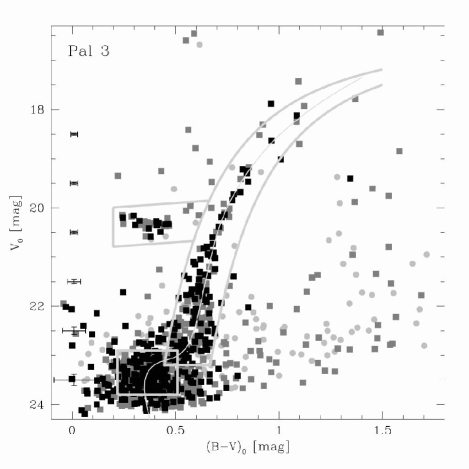
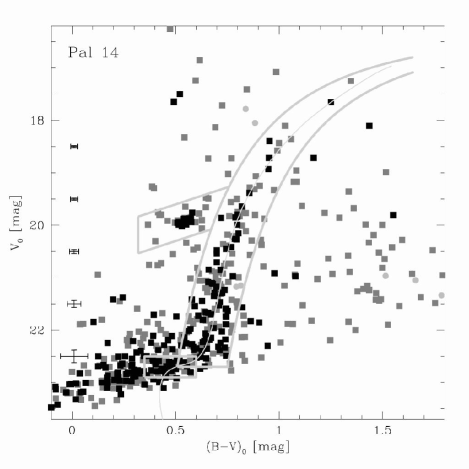
The calibrated and de-reddened magnitudes are presented in the colour-magnitude diagrams (CMDs, see Figs. 2, 4, and 6). The foreground reddening has been corrected with the values given in the Harris list (Harris harr96 (1996)), and . Only stars with photometric errors less than 0.15 mag in and and ALLSTAR sharp and chi values in the ranges sharp and chi are shown. The red giant branch (RGB) and horizontal branch (HB) are clearly visible in all clusters. For Pal 3, even the main sequence turnoff (MSTO) region is well definded.
The distances to the clusters are derived from the apparent magnitude of the horizontal branch. We selected only those HB stars which are located within five half-light radii from the clusters’ centres and which lie on the horizontal part of the HB at (to avoid AGB and extended HB stars). The average HB magnitudes in and the corresponding distance moduli are given in Table 3. They agree within mag with the values listed by Harris (harr96 (1996)).
In order to estimate the age and metallicity of the clusters we fitted the location and shape of the RGBs by appropriate isochrones. The Yonsei-Yale isochrone set by Kim et al. (kimy02 (2002)) was used for that. An alpha-abundance of [/Fe] dex was adopted. The best-fitting isochrones are shown in Figs. 2, 4, and 6. They have ages between 10 and 11 Gyr, and metallicities in the range to dex. For Pal 3 and Pal 14 the best-fitting metallicity value agrees well with the spectroscopic values in the Harris list (see Table 3). For AM 1, no good isochrone fit with a metallicity of dex could be found. Instead, a metallicity of dex represents the shape of the RGB well. Either, the spectroscopic abundance is not accurate enough and this cluster indeed has a higher metallicity or, the isochrone fit is not constrained well enough. Besides the selection of the best-fitting ages and metallicities, the isochrones had to be slightly shifted in as well as in to match the exact location of the RGB. These corrections are given in the captions of the CMD figures, and , and in Table 3 (with ). These corrections are of the order of the photometric errors and within the uncertainties of not perfectly photometric conditions.
4.1 Member selection
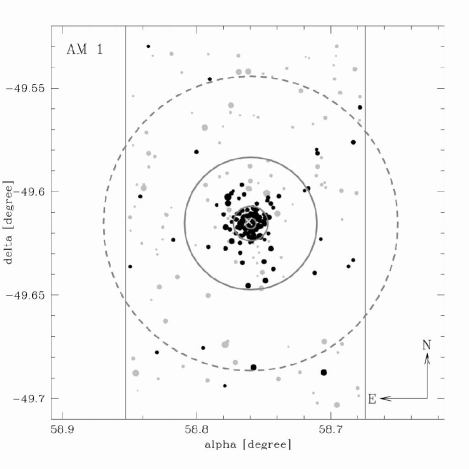
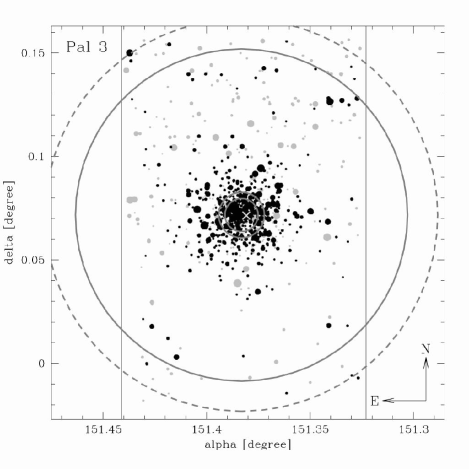
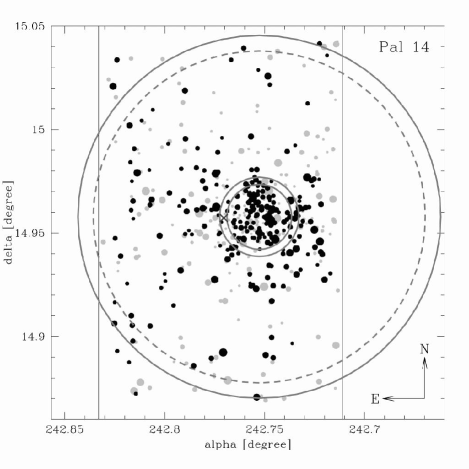
The main purpose of this paper is to provide a list of bright cluster members for follow-up spectroscopy. Therefore, probable cluster members have to be selected. The principle criterium is that member stars should be located close to the isochrone in the colour-magnitude diagram. A second criterium is their distance to the cluster centre. In the Figs. 2, 4, and 6 the regions of probable member stars are high-lighted. The RGB and HB regions are marked for all clusters. In Pal 14, an additional region of subgiant branch (SGB) stars has been selected, in Pal 3 also the MSTO region. Furthermore, stars within one and five half-light radii are shown in the graphs as black and dark grey squares, respectively. The core radius, half-light radius and tidal radius (Harris harr96 (1996), Baumgardt et al. baum05 (2005)) are listed in Table 4 and shown in Figs. 3, 5, and 7.
In the Appendix, magnitude limited samples of probable member stars are listed (Tables 5, 6, and 7). Only stars within the tidal radius given by Baumgardt et al. (baum05 (2005)) have been considered. The magnitude limits are , 22.5, and 22.2 for AM 1, Pal 3, and Pal 14, respectively. Thus, only RGB, HB and AGB stars are contained in the lists. Note: the full tables only are availble in the online version of the article.
5 Structural parameters
Although the photometry of the observed clusters is not very deep and we do not sample the main sequence stars, some structural parameters of the globular clusters can be derived from the selected evolved member stars.
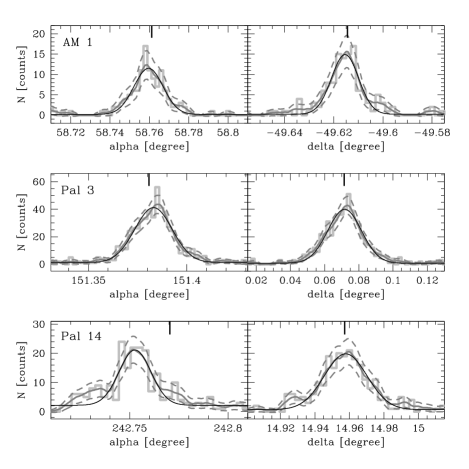
5.1 Cluster centres
The cluster centres were determined by analysing the number distribution of probable member stars as function of right ascension and declination. Probable member stars are those of the high-lighted regions in the CMDs (see Figs. 2, 4, and 6). Furthermore, the member stars have been restricted to an approximatly squared region () around their apparent cluster centres. The number distributions of the stars are shown in Fig. 8 as histograms and as binning independent representations (using an Epanechnikov kernel). The binning independent number distributions were fitted by Gaussians. The peak of these Gaussians defines the cluster centre. In Table 3 the derived values are listed. The accuracy of the centre determination is about . Whereas the declination of the centres agree very well with those listed in the Harris list, there are some notable deviations in the right ascension (see also crosses in Figs. 3, 5, and 7). Especially, the right ascension listed for Pal 14 is off by with respect to our value. We are confident that our values are very accurate and suggest to correct the coordinates in the ‘official’ lists (e.g. Harris harr96 (1996)).
5.2 Angular distribution and ellipticity
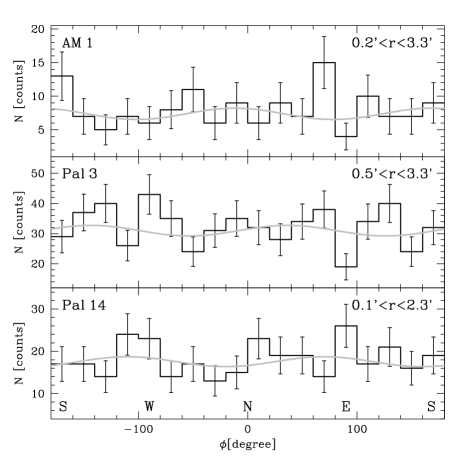
The ellipticity of the clusters is of interest because rotation or the tidal loss of stars in opposite directions might cause a detectable signal. To investigate this we studied the angular distribution of probable member stars including the main sequence turnoff region stars (see Fig. 9). We choose the radial range to be from outside the core radius (only for AM 1 and Pal 3) to avoid crowding effects to inside the maximum radius of the observed CCD area to guarantee a homogeneous angular coverage. The angular distributions (counted in bins of 20 degree) then were fitted by a double-cosine function of the form , where and define the ellipticity as follows: , assuming that the ellipticity is expressed as (: semi major axis, : semi minor axis). The error for the ellipticity was propagated from the Poisson statistics of the number counts and the rms of the fit. The results are: , , and . None of the clusters exhibits a significant ellipticity. The distribution of their stars is compatible with a homogeneous, circular distribution within the errors.
5.3 Surface density profiles
The probable member stars of the three clusters are evolved stars of more or less the same mass. Since they are the brightest stars of the clusters they dominate the surface brightness of those clusters. One can derive the structural parameters of the clusters by fitting density profiles to either the number density distribution or the surface brightness distribution of the stars. This is shown in Fig. 10. The number density counts have been corrected for background/foreground field star contamination by estimating the field star number counts from 0.5 arcmin wide strips in the northern and southern edge of the observed CCD areas. The number density of contaminating field stars in the selected CMD areas is 0.15, 0.77, and 0.62 objects/arcmin-2 for AM 1, Pal 3, and Pal 14, respectively. The core radius, the tidal radius, and the central surface brightness of the clusters were determined from the best fitting King (King king62 (1962)) profiles. For Pal 14, the tidal radius had to be fixed to 5 arcmin (the mean value between Harris harr96 (1996) and Baumgardt et al. baum05 (2005)) since it could not be constrained by the fit. The half-light radii were derived from a curve-of-growth analysis of the integrated light of the member stars. The results of our analyses are given in Table 4. Typical errors are of the order (AM 1, Pal 3) and (Pal 14) for , (Pal 3) and (AM 1) for , while for they are respectively. The errors for the central surface brightness are between 0.25 and 0.40 mag.
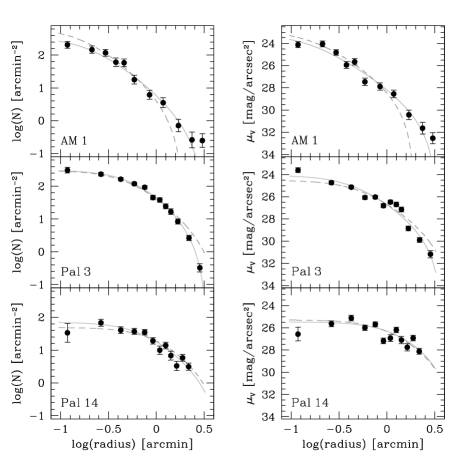
Not all our derived values agree with the ones listed by Harris (harr96 (1996)) and/or Baumgardt et al. (baum05 (2005)). For AM 1, we find a slightly smaller half-light radius, but a significantly larger tidal radius than listed by Harris. A small tidal radius does not fit the profile. Also the the central surface brightness is much higher than Harris’ value. In the contrary, for Pal 3, we derive a slightly larger half-light radius, but a smaller tidal radius. Also for Pal 14, a larger half-light radius fits the profile best.
Note however that all our values are valid for the selected probable member stars. Adding the fainter, lower mass main sequence stars would raise the central surface brightness a little bit. One might think that including the faint stars would increase the characteristic radii since these stars might be more widely distributed than the more massive, evolved stars due to the dynamical evolution of the cluster. However, the half-mass relaxation times of the clusters are between 5.5 and 9.1 Gyr, close to a Hubble time. This suggests that dynamical evolution does not play a major role in the shaping of the clusters.
6 Discussion and Summary
The outer halo globular clusters AM 1, Pal 3, and Pal 14 were imaged with FORS2 on the VLT under good seeing and mostly photometric conditions. Accurate PSF photometry in Johnson of stars brighter than mag was performed in large fields around these clusters. The absolute position of the stars was determined with an accuracy of 0.2′′ by applying a general astrometric solution derived from stars of the USNO catalog in the observed fields. This positional accuracy is sufficient to be used in input catalogs for most of the available multi-object spectrographs (using either fibres or slit masks).
Probable member stars of the clusters were selected according to their position in the colour-magnitude diagram and their distance to the cluster centres. The positions and photometric properties ( magnitude, colour) of all probable member stars within the tidal radius (as calculated by Baumgardt et al. baum05 (2005)) and brighter than mag for AM 1, Pal 3, and Pal 14, respectively, are presented in the tables of the appendix. Although challenging, one can reach with modern high resolution spectrographs, like UVES at the VLT, a signal-to-noise above 10 for stars as faint as mag within one observing night. This limit would mean a sample size of 9, 48, and 72 probable member stars for AM 1, Pal 3, and Pal 14, respectively. Except for AM 1, these sample sizes are sufficient to derive an accurate radial velocity dispersion of the clusters.
The colour-magnitude diagrams have been used to estimate – by isochrone fitting – distances, reddenings, ages and metallicities to the three clusters. Our derived values for the horizontal branch magnitude , reddening and distance modulus generally agree within mag with the values given in the literature (AM 1: Madore & Freedman mado89 (1989); Pal 3: Stetson et al. stet99 (1999); Pal 14: Holland & Harris holl92 (1992)). Only for Pal 14 we get a slightly better isochrone fit when adopting a 0.05 mag shorter distance modulus and a 0.03 mag higher reddening (see Table 3). Since the turnoff regions are not very well constrained in the CMDs of the three clusters, age estimates have to be taken with caution. However, we found that isochrones with ages of 10-11 Gyr fit the turnoff-SGB-RGB transition region better than those of older ages. Our age estimates are consistent with the idea that the three clusters belong to the ’young halo’ GCs which are, on average, 1-2 Gyr younger than the old ’inner halo’ GCs (e.g. Mackey & Gilmore mack04 (2004)). The metallicity of the chosen isochrones is mainly constrained by the shape of the red giant branch. The adopted values for Pal 3 ( dex) and Pal 14 ( dex) agree well with those given in the literature: Pal 3: (Zinn zinn85 (1985)), (Armandroff et al. arma92 (1992)), (Ortolani & Gratton orto89 (1989)); Pal 14: (Zinn zinn85 (1985)), (Armandroff et al. arma92 (1992)). The isochrone of AM 1, however, fits the RGB better with a higher metallicity ( dex) than derived in previous work: (Zinn zinn85 (1985)), (Suntzeff et al. sunt85 (1985)). New spectroscopic metallicities are needed to decide whether AM 1 really is more metal-rich than thought before.
| Name | RA(2000) | Dec(2000) | [Fe/H] | a | |||||||
|---|---|---|---|---|---|---|---|---|---|---|---|
| [h:m:s] | [∘:′:′′] | [mag] | [mag] | [mag] | [mag] | [mag] | [dex] | [kpc] | [mag] | [mag] | |
| AM 1 | 03:55:02.3 | 49:36:55 | 0.01 | … | 20.98 | 20.39 | 20.45 | 1.40 | 118.0 | 15.84 | 4.55 |
| 03:55:02.7 | 49:36:52 | … | 0.00 | 20.96 | 20.43 | … | 1.80 | 121.9 | 15.72 | 4.71 | |
| Pal 3 | 10:05:31.9 | 00:04:18 | 0.04 | 0.02 | 20.48 | 19.94 | 19.95 | 1.70 | 91.9 | 14.91 | 5.03 |
| 10:05:31.4 | 00:04:17 | … | 0.04 | 20.51 | 19.96 | … | 1.66 | 92.7 | 14.26 | 5.70 | |
| Pal 14 | 16:11:00.6 | 14:57:28 | 0.03 | 0.07 | 20.03 | 19.46 | 19.42 | 1.50 | 74.7 | 14.68 | 4.78 |
| 16:11:04.9 | 14:57:29 | … | 0.04 | 20.04 | 19.47 | … | 1.52 | 73.9 | 14.74 | 4.73 |
a The total magnitude in the first row for each cluster is based on the integrated luminosity of probable member stars down to the magnitude limits of the individual data sets. It therefore excludes most of the bright foreground stars, but also the fainter main sequence stars.
| Name | a | a | ca,b | |||||
|---|---|---|---|---|---|---|---|---|
| [mag/arcsec2] | [′] | [′] | [′] | [pc] | [pc] | [pc] | ||
| AM 1 | 23.11 | 0.18 (0.14) | 0.32 | 3.24 (3.29) | 1.26 (1.37) | 6.2 (4.8) | 11.0 | 111.3 (113.0) |
| 23.86 | 0.15 | 0.50 | 1.92 (4.27) | 1.12 | 5.3 | 17.7 | 68.1 (151.6) | |
| Pal 3 | 23.84 | 0.54 (0.40) | 0.72 | 3.34 (3.72) | 0.79 (0.97) | 14.4 (10.7) | 19.3 | 89.3 (99.5) |
| 23.08 | 0.48 | 0.66 | 4.81 (5.69) | 1.00 | 12.9 | 17.8 | 129.8 (153.5) | |
| Pal 14 | 24.92 | 0.70 (1.14) | 1.28 | [5.00]c | 0.85 (0.59) | 15.2 (24.8) | 27.8 | [108.7]c |
| 25.55 | 0.94 | 1.15 | 5.26 (4.81) | 0.75 | 20.21 | 24.7 | 113.1 (103.4) |
aIn brackets the values of the fit to the surface brightness profile are
given (first row for each cluster). The tidal radii in brackets of the
second row for each cluster are the values from Baumgardt et
al. (baum05 (2005))
b concentration parameter:
c this value was not derived but adopted
From the spatial distribution of probable member stars in AM 1, Pal 3, and Pal 14 structural parameters of the clusters have been determined and compared to the values given in Harris’ list (harr96 (1996)) and Baumgardt et al. (baum05 (2005)). Whereas the derived declinations of all clusters agree with the literature values within , the right ascensions show larger deviations: for AM 1, for Pal 3, and most significantly for Pal 14. The deviating right ascension of Pal 14 goes back to the list of Webbink (webb85 (1985)), and then was taken over into the lists of Djorgovski & Meylan (djor93 (1993)) and Harris (harr96 (1996)).
Concerning ellipticities, none of the clusters shows a measurable signal. They all seem to be relaxed, roundish halo clusters. Note however that a wide field study of main sequence stars around Pal 3 revealed a weak signature of extra tidal member stars between one and four tidal radii (Sohn et al. sohn03 (2003)).
The half-light radii of the clusters were estimated from curve-of-growth
analyses of the integrated light of the probable member stars. Our derived
values deviate by from those given in Harris’ list which
are based on CCD work by Trager er al. (trag93 (1993)) and van den Bergh et al.
(vdbe91 (1991)). Biases in the different selection of member stars and the
accidental inclusion of foreground stars might explain these differences.
The core and tidal radii of the three clusters were derived from King profile
fits to their surface number density as well as surface brightness profiles.
For AM 1 and Pal 3 both radii could be determined with stable solutions.
For Pal 14, the spatial extension of the member stars was not
sufficient enough to get a stable fit for the tidal radius. It was fixed to
, the mean value of Harris (harr96 (1996)) and Baumgardt et al.
(baum05 (2005)). The core and tidal radius of Pal 14 in Harris’ list is based
on the photographic study by Harris & van den Bergh (harr84 (1984)), the ones
of AM 1 and Pal 3 on the CCD work by Trager er al. (trag93 (1993)).
The main differences of our findings to previous literature values are that
AM 1 definitly has a larger tidal radius than claimed by Trager et al.
(trag93 (1993)), but smaller than calculated by Baumgardt et al.
(baum05 (2005)). On the contrary, the tidal
radius of Pal 3 seems to be smaller than claimed by the two authors. The core
radii of all clusters agree more or less with those given in Harris’ list.
The three clusters have in common that their central concentration parameter
is around 1.0, very low in comparison with ordinary inner halo globular
clusters.
This paper provides the basis for further investigations of evolved stars in AM 1, Pal 3, and Pal 14. Future follow-up spectroscopic observations of these cluster will be very exciting. The measurements of a low (Newtonian) velocity dispersion would mean that MOND in its present form is in severe trouble and that globular clusters do not possess dark matter. In contrast, a high velocity dispersion would either favour MOND or could be a hint to the existence of dark matter in globular clusters, a highly interesting hypothesis on its own right.
Acknowledgements.
I wish to thank Holger Baumgardt and Klaas de Boer for very helpful comments, and the anonymous referee for useful suggestions which improved the paper. This project was supported by the DFG project HI 855/2.Appendix A Lists of probable member stars
The following tables contain the lists of probable member stars of AM 1,
Pal 3, and Pal 14. They are ordered with increasing magnitude. The
columns are as follows:
Column 1. Identification number of the object, following the order of increasing magnitude.
Column 2. Right ascension for the epoch 2000 in hours, minutes and seconds (h,m,s).
Column 3. Declination (2000) in degrees, minutes and seconds ().
The positions of all objects were determined relative to positions in the USNO catalog. The positional accuracy of the calculated coordinates is in all fields better than 0.2′′.
Column 4. apparent magnitude as determined by PSF photometry under DAOPHOT II.
Column 5. colours from PSF photometry.
Column 6. Photometric error in (ALLSTAR output).
Column 7. Photometric error in (ALLSTAR output).
Column 8. Projected distance to cluster centre (see Table 3) in arcminutes.
Column 9. ‘Type’ describes to which part of the CMD the star probably
belongs: RGB = red giant branch, HB = horizontal branch, AGB = asymptotic
giant branch.
| Id | (2000) | (2000) | radius | Type | ||||
|---|---|---|---|---|---|---|---|---|
| [h:m:s] | [∘:′:′′] | [mag] | [mag] | [mag] | [mag] | [′] | ||
| 1 | 03:55:02.93 | 49:36:44.6 | 18.27 | 1.45 | 0.01 | 0.01 | 0.21 | RGB |
| 2 | 03:55:06.36 | 49:36:09.5 | 19.44 | 1.07 | 0.01 | 0.01 | 1.01 | RGB |
| 3 | 03:55:00.64 | 49:37:17.9 | 19.48 | 1.06 | 0.01 | 0.01 | 0.46 | RGB |
| 4 | 03:55:02.04 | 49:36:51.7 | 19.51 | 1.02 | 0.01 | 0.01 | 0.07 | RGB |
| 5 | 03:55:06.33 | 49:36:20.2 | 19.97 | 0.95 | 0.01 | 0.01 | 0.88 | RGB |
| 6 | 03:55:01.82 | 49:36:39.9 | 20.12 | 0.92 | 0.01 | 0.01 | 0.27 | RGB |
| 7 | 03:55:02.15 | 49:36:50.1 | 20.37 | 0.90 | 0.01 | 0.02 | 0.09 | RGB |
| 8 | 03:55:01.79 | 49:41:06.0 | 20.43 | 0.73 | 0.01 | 0.01 | 4.18 | AGB |
| 9 | 03:55:04.19 | 49:36:55.7 | 20.45 | 0.67 | 0.01 | 0.01 | 0.31 | AGB |
| 10 | 03:55:06.78 | 49:37:02.1 | 20.52 | 0.75 | 0.01 | 0.02 | 0.74 | AGB |
| 11 | 03:55:01.31 | 49:36:41.6 | 20.62 | 0.81 | 0.01 | 0.02 | 0.28 | RGB |
| 12 | 03:55:05.70 | 49:37:25.9 | 20.63 | 0.67 | 0.01 | 0.01 | 0.75 | AGB |
| 13 | 03:55:03.25 | 49:37:04.3 | 20.66 | 0.62 | 0.01 | 0.01 | 0.21 | HB |
| 14 | 03:55:02.36 | 49:36:56.9 | 20.73 | 0.63 | 0.02 | 0.02 | 0.03 | HB |
| 15 | 03:54:59.64 | 49:38:34.8 | 20.78 | 0.63 | 0.01 | 0.01 | 1.71 | HB |
| 16 | 03:54:58.65 | 49:37:39.3 | 20.78 | 0.80 | 0.02 | 0.02 | 0.94 | RGB |
| 17 | 03:55:02.50 | 49:37:00.7 | 20.80 | 0.65 | 0.03 | 0.04 | 0.09 | HB |
| 18 | 03:54:59.63 | 49:36:45.8 | 20.82 | 0.80 | 0.01 | 0.02 | 0.46 | RGB |
| 19 | 03:55:01.04 | 49:36:47.6 | 20.87 | 0.73 | 0.01 | 0.02 | 0.24 | RGB |
| 20 | 03:54:59.02 | 49:36:44.9 | 20.87 | 0.79 | 0.01 | 0.02 | 0.56 | RGB |
| 21 | 03:55:01.27 | 49:36:45.5 | 20.88 | 0.59 | 0.01 | 0.01 | 0.23 | HB |
| 22 | 03:55:00.68 | 49:36:45.0 | 20.88 | 0.80 | 0.01 | 0.02 | 0.31 | RGB |
| 23 | 03:55:04.07 | 49:37:17.0 | 20.88 | 0.64 | 0.02 | 0.02 | 0.46 | HB |
| 24 | 03:55:02.75 | 49:38:43.6 | 20.89 | 0.59 | 0.01 | 0.01 | 1.80 | HB |
| 25 | 03:55:01.93 | 49:36:54.6 | 20.89 | 0.52 | 0.02 | 0.02 | 0.06 | HB |
| 26 | 03:54:59.91 | 49:38:01.7 | 20.89 | 0.82 | 0.01 | 0.02 | 1.17 | RGB |
| 27 | 03:55:04.57 | 49:37:02.1 | 20.92 | 0.57 | 0.01 | 0.02 | 0.39 | HB |
| 28 | 03:55:02.92 | 49:37:00.0 | 20.92 | 0.80 | 0.02 | 0.02 | 0.13 | RGB |
| 29 | 03:54:59.82 | 49:36:56.1 | 20.92 | 0.54 | 0.01 | 0.02 | 0.40 | HB |
| 30 | 03:55:03.96 | 49:36:51.9 | 20.93 | 0.54 | 0.01 | 0.02 | 0.28 | HB |
| 31 | 03:55:03.63 | 49:36:45.1 | 20.94 | 0.56 | 0.02 | 0.02 | 0.28 | HB |
| 32 | 03:55:02.85 | 49:36:49.7 | 20.94 | 0.64 | 0.02 | 0.02 | 0.13 | HB |
| 33 | 03:55:02.65 | 49:36:44.0 | 20.94 | 0.53 | 0.02 | 0.02 | 0.20 | HB |
| 34 | 03:54:57.27 | 49:36:08.0 | 20.96 | 0.57 | 0.01 | 0.01 | 1.13 | HB |
| 35 | 03:54:59.62 | 49:36:40.7 | 20.96 | 0.54 | 0.01 | 0.01 | 0.50 | HB |
| 36 | 03:55:01.82 | 49:37:14.8 | 20.98 | 0.55 | 0.02 | 0.02 | 0.33 | HB |
| 37 | 03:54:43.93 | 49:34:34.2 | 20.98 | 0.75 | 0.02 | 0.02 | 3.80 | RGB |
| 38 | 03:55:02.13 | 49:37:26.1 | 20.98 | 0.60 | 0.01 | 0.02 | 0.51 | HB |
| 39 | 03:55:01.19 | 49:36:30.6 | 20.98 | 0.58 | 0.01 | 0.02 | 0.45 | HB |
| 40 | 03:54:58.67 | 49:36:20.8 | 20.98 | 0.52 | 0.01 | 0.01 | 0.82 | HB |
| 41 | 03:55:03.07 | 49:36:46.5 | 20.99 | 0.59 | 0.02 | 0.02 | 0.19 | HB |
| 42 | 03:55:03.54 | 49:36:43.9 | 20.99 | 0.53 | 0.02 | 0.02 | 0.28 | HB |
| 43 | 03:55:01.39 | 49:36:47.4 | 20.99 | 0.57 | 0.01 | 0.02 | 0.20 | HB |
| 44 | 03:54:50.84 | 49:38:21.4 | 21.00 | 0.64 | 0.01 | 0.02 | 2.34 | HB |
| 45 | 03:55:04.06 | 49:37:01.5 | 21.00 | 0.52 | 0.02 | 0.02 | 0.30 | HB |
| 46 | 03:55:04.85 | 49:36:48.4 | 21.00 | 0.54 | 0.01 | 0.02 | 0.43 | HB |
| 47 | 03:55:06.02 | 49:37:05.8 | 21.01 | 0.55 | 0.01 | 0.01 | 0.63 | HB |
| 48 | 03:55:00.81 | 49:37:01.1 | 21.01 | 0.55 | 0.01 | 0.02 | 0.26 | HB |
| 49 | 03:55:01.38 | 49:37:00.4 | 21.02 | 0.52 | 0.02 | 0.02 | 0.17 | HB |
| 50 | 03:55:02.01 | 49:36:55.6 | 21.02 | 0.53 | 0.02 | 0.02 | 0.05 | HB |
| 51 | 03:55:04.22 | 49:37:04.0 | 21.02 | 0.79 | 0.02 | 0.02 | 0.34 | RGB |
| 52 | 03:55:00.59 | 49:36:50.9 | 21.02 | 0.55 | 0.02 | 0.02 | 0.29 | HB |
| 53 | 03:54:59.20 | 49:36:10.3 | 21.02 | 0.53 | 0.02 | 0.01 | 0.90 | HB |
| 54 | 03:55:01.43 | 49:36:35.8 | 21.02 | 0.52 | 0.02 | 0.02 | 0.36 | HB |
| 55 | 03:55:02.35 | 49:36:55.9 | 21.03 | 0.72 | 0.03 | 0.03 | 0.01 | RGB |
| 56 | 03:55:02.30 | 49:36:37.9 | 21.04 | 0.56 | 0.01 | 0.02 | 0.29 | HB |
| 57 | 03:55:01.43 | 49:37:05.7 | 21.04 | 0.77 | 0.01 | 0.02 | 0.22 | RGB |
| 58 | 03:55:07.14 | 49:36:39.7 | 21.04 | 0.76 | 0.01 | 0.02 | 0.83 | RGB |
| 59 | 03:54:59.93 | 49:36:51.5 | 21.06 | 0.49 | 0.02 | 0.02 | 0.39 | HB |
| 60 | 03:55:03.35 | 49:37:12.9 | 21.09 | 0.53 | 0.02 | 0.02 | 0.34 | HB |
| 61 | 03:55:01.28 | 49:37:06.2 | 21.17 | 0.75 | 0.02 | 0.03 | 0.24 | RGB |
| 62 | 03:54:58.25 | 49:38:14.7 | 21.17 | 0.71 | 0.01 | 0.02 | 1.47 | RGB |
| 63 | 03:55:02.59 | 49:37:02.2 | 21.17 | 0.77 | 0.02 | 0.04 | 0.12 | RGB |
| 64 | 03:55:03.77 | 49:38:03.4 | 21.30 | 0.41 | 0.02 | 0.02 | 1.16 | HB |
| 65 | 03:55:02.97 | 49:37:13.1 | 21.31 | 0.68 | 0.03 | 0.02 | 0.31 | RGB |
| 66 | 03:55:01.21 | 49:36:20.9 | 21.33 | 0.73 | 0.01 | 0.02 | 0.60 | RGB |
| 67 | 03:55:02.67 | 49:36:46.7 | 21.37 | 0.69 | 0.02 | 0.03 | 0.16 | RGB |
| 68 | 03:55:04.21 | 49:37:29.2 | 21.40 | 0.73 | 0.02 | 0.03 | 0.64 | RGB |
| 69 | 03:55:03.66 | 49:36:48.4 | 21.41 | 0.79 | 0.02 | 0.03 | 0.25 | RGB |
| 70 | 03:55:12.00 | 49:34:51.1 | 21.46 | 0.68 | 0.03 | 0.03 | 2.60 | RGB |
| 71 | 03:55:01.91 | 49:36:27.5 | 21.47 | 0.73 | 0.02 | 0.03 | 0.47 | RGB |
| 72 | 03:55:09.89 | 49:37:36.2 | 21.50 | 0.43 | 0.02 | 0.02 | 1.40 | HB |
| 73 | 03:55:01.58 | 49:36:56.1 | 21.58 | 0.73 | 0.03 | 0.03 | 0.12 | RGB |
| 74 | 03:55:03.45 | 49:36:04.8 | 21.67 | 0.76 | 0.02 | 0.02 | 0.87 | RGB |
| 75 | 03:55:02.47 | 49:37:05.0 | 21.69 | 0.67 | 0.03 | 0.04 | 0.16 | RGB |
| 76 | 03:55:03.23 | 49:36:51.6 | 21.73 | 0.70 | 0.04 | 0.04 | 0.16 | RGB |
| 77 | 03:55:06.81 | 49:37:38.8 | 21.85 | 0.66 | 0.03 | 0.03 | 1.03 | RGB |
| 78 | 03:55:02.10 | 49:37:21.2 | 21.85 | 0.75 | 0.03 | 0.04 | 0.43 | RGB |
| 79 | 03:55:03.47 | 49:36:50.0 | 21.87 | 0.70 | 0.08 | 0.07 | 0.21 | RGB |
| 80 | 03:55:01.81 | 49:37:03.9 | 21.88 | 0.78 | 0.04 | 0.04 | 0.16 | RGB |
| 81 | 03:55:02.31 | 49:37:02.3 | 21.91 | 0.77 | 0.03 | 0.05 | 0.11 | RGB |
| 82 | 03:54:50.34 | 49:34:53.5 | 21.95 | 0.72 | 0.03 | 0.04 | 2.81 | RGB |
| 83 | 03:55:03.82 | 49:36:32.7 | 22.04 | 0.64 | 0.03 | 0.04 | 0.45 | RGB |
| 84 | 03:55:02.54 | 49:37:19.0 | 22.06 | 0.68 | 0.03 | 0.04 | 0.39 | RGB |
| 85 | 03:55:04.96 | 49:37:12.8 | 22.08 | 0.66 | 0.03 | 0.05 | 0.52 | RGB |
| 86 | 03:55:02.63 | 49:37:18.5 | 22.14 | 0.71 | 0.04 | 0.04 | 0.39 | RGB |
| 87 | 03:55:04.29 | 49:36:38.6 | 22.17 | 0.65 | 0.03 | 0.04 | 0.43 | RGB |
| 88 | 03:55:00.41 | 49:37:00.4 | 22.22 | 0.66 | 0.03 | 0.04 | 0.32 | RGB |
| 89 | 03:55:03.87 | 49:35:48.2 | 22.33 | 0.62 | 0.03 | 0.04 | 1.15 | RGB |
| 90 | 03:54:59.31 | 49:36:15.6 | 22.34 | 0.65 | 0.04 | 0.05 | 0.82 | RGB |
Table A.1. (continued)
Id
(2000)
(2000)
radius
Type
[h:m:s]
[∘:′:′′]
[mag]
[mag]
[mag]
[mag]
[′]
91
03:55:02.00
49:37:09.0
22.35
0.68
0.04
0.06
0.23
RGB
92
03:55:04.18
49:37:46.5
22.36
0.64
0.04
0.05
0.90
RGB
93
03:54:51.97
49:35:54.4
22.39
0.64
0.06
0.05
1.96
RGB
94
03:54:58.27
49:36:28.0
22.45
0.62
0.04
0.04
0.80
RGB
95
03:55:05.75
49:36:03.1
22.47
0.69
0.03
0.06
1.04
RGB
96
03:55:02.60
49:37:11.6
22.53
0.68
0.04
0.06
0.27
RGB
97
03:55:10.81
49:40:31.9
22.56
0.71
0.06
0.06
3.86
RGB
98
03:55:02.88
49:36:31.9
22.58
0.65
0.04
0.05
0.40
RGB
99
03:55:03.88
49:36:58.2
22.60
0.63
0.06
0.07
0.26
RGB
100
03:54:59.98
49:36:53.9
22.61
0.68
0.05
0.06
0.38
RGB
101
03:54:43.96
49:37:59.2
22.61
0.73
0.05
0.07
3.15
RGB
102
03:54:59.13
49:37:12.9
22.67
0.63
0.06
0.07
0.59
RGB
103
03:55:01.82
49:37:09.1
22.69
0.62
0.04
0.07
0.24
RGB
104
03:55:22.06
49:36:08.5
22.69
0.63
0.05
0.07
3.30
RGB
105
03:55:02.10
49:36:45.8
22.75
0.66
0.06
0.07
0.16
RGB
106
03:54:49.76
49:37:22.8
22.77
0.59
0.07
0.06
2.08
RGB
107
03:55:05.37
49:36:44.6
22.77
0.62
0.05
0.09
0.53
RGB
108
03:55:02.05
49:37:01.3
22.78
0.60
0.05
0.10
0.10
RGB
109
03:55:04.44
49:36:37.5
22.89
0.70
0.05
0.10
0.46
RGB
110
03:55:01.53
49:37:20.8
22.91
0.67
0.06
0.08
0.44
RGB
| Id | (2000) | (2000) | radius | Type | ||||
|---|---|---|---|---|---|---|---|---|
| [h:m:s] | [∘:′:′′] | [mag] | [mag] | [mag] | [mag] | [′] | ||
| 1 | 10:05:36.24 | 00:03:59.9 | 18.05 | 1.16 | 0.01 | 0.01 | 1.11 | RGB |
| 2 | 10:05:31.57 | 00:04:17.0 | 18.25 | 1.13 | 0.02 | 0.01 | 0.10 | RGB |
| 3 | 10:05:37.08 | 00:04:27.9 | 18.37 | 1.12 | 0.01 | 0.01 | 1.29 | RGB |
| 4 | 10:05:29.71 | 00:05:39.2 | 18.64 | 0.95 | 0.02 | 0.01 | 1.46 | AGB? |
| 5 | 10:05:31.05 | 00:04:17.3 | 18.76 | 1.00 | 0.01 | 0.01 | 0.23 | RGB |
| 6 | 10:05:34.63 | 00:04:06.9 | 19.30 | 0.89 | 0.01 | 0.01 | 0.69 | RGB |
| 7 | 10:05:21.69 | 00:07:35.2 | 19.30 | 0.81 | 0.02 | 0.01 | 4.17 | AGB? |
| 8 | 10:05:31.84 | 00:04:16.5 | 19.34 | 0.86 | 0.02 | 0.01 | 0.04 | RGB |
| 9 | 10:05:32.87 | 00:04:36.1 | 19.37 | 0.88 | 0.02 | 0.01 | 0.38 | RGB |
| 10 | 10:05:33.19 | 00:03:57.1 | 19.42 | 0.88 | 0.02 | 0.01 | 0.47 | RGB |
| 11 | 10:05:27.72 | 00:05:08.8 | 19.54 | 0.85 | 0.02 | 0.01 | 1.35 | RGB |
| 12 | 10:05:31.12 | 00:04:16.9 | 19.59 | 0.89 | 0.02 | 0.01 | 0.21 | RGB |
| 13 | 10:05:32.91 | 00:04:26.1 | 19.80 | 0.85 | 0.02 | 0.01 | 0.27 | RGB |
| 14 | 10:05:32.59 | 00:04:32.3 | 19.85 | 0.82 | 0.02 | 0.01 | 0.29 | RGB |
| 15 | 10:05:32.73 | 00:04:36.7 | 19.97 | 0.81 | 0.02 | 0.01 | 0.37 | RGB |
| 16 | 10:05:29.92 | 00:04:53.9 | 20.04 | 0.77 | 0.04 | 0.03 | 0.78 | RGB |
| 17 | 10:05:28.29 | 00:04:37.7 | 20.08 | 0.61 | 0.01 | 0.01 | 0.97 | RGB |
| 18 | 10:05:23.96 | 00:04:24.5 | 20.12 | 0.71 | 0.01 | 0.01 | 2.00 | AGB |
| 19 | 10:05:30.25 | 00:03:37.6 | 20.14 | 0.80 | 0.01 | 0.01 | 0.80 | RGB |
| 20 | 10:05:30.36 | 00:05:29.6 | 20.18 | 0.59 | 0.02 | 0.01 | 1.26 | AGB |
| 21 | 10:05:28.83 | 00:04:36.5 | 20.22 | 0.79 | 0.01 | 0.01 | 0.84 | RGB |
| 22 | 10:05:28.79 | 00:03:45.5 | 20.22 | 0.78 | 0.01 | 0.01 | 0.96 | RGB |
| 23 | 10:05:29.97 | 00:04:03.8 | 20.26 | 0.78 | 0.01 | 0.01 | 0.55 | RGB |
| 24 | 10:05:30.44 | 00:03:38.1 | 20.27 | 0.28 | 0.01 | 0.01 | 0.77 | HB |
| 25 | 10:05:34.35 | 00:04:39.2 | 20.27 | 0.65 | 0.01 | 0.01 | 0.70 | AGB |
| 26 | 10:05:33.82 | 00:04:18.2 | 20.28 | 0.34 | 0.02 | 0.01 | 0.47 | HB |
| 27 | 10:05:21.94 | 00:04:06.3 | 20.30 | 0.33 | 0.02 | 0.01 | 2.51 | HB |
| 28 | 10:05:30.07 | 00:02:04.7 | 20.31 | 0.80 | 0.02 | 0.01 | 2.27 | RGB |
| 29 | 10:05:31.49 | 00:04:27.7 | 20.31 | 0.76 | 0.02 | 0.01 | 0.20 | RGB |
| 30 | 10:05:31.35 | 00:04:14.4 | 20.33 | 0.28 | 0.02 | 0.01 | 0.16 | HB |
| 31 | 10:05:35.79 | 00:03:34.3 | 20.33 | 0.50 | 0.01 | 0.01 | 1.20 | HB |
| 32 | 10:05:32.63 | 00:04:21.3 | 20.39 | 0.37 | 0.02 | 0.01 | 0.18 | HB |
| 33 | 10:05:35.91 | 00:05:10.3 | 20.39 | 0.39 | 0.01 | 0.01 | 1.32 | HB |
| 34 | 10:05:33.32 | 00:04:38.0 | 20.40 | 0.45 | 0.02 | 0.01 | 0.48 | HB |
| 35 | 10:05:27.59 | 00:05:00.0 | 20.42 | 0.41 | 0.02 | 0.01 | 1.30 | HB |
| 36 | 10:05:39.49 | 00:00:10.8 | 20.43 | 0.64 | 0.03 | 0.02 | 4.53 | AGB |
| 37 | 10:05:34.47 | 00:03:57.1 | 20.43 | 0.45 | 0.01 | 0.01 | 0.72 | HB |
| 38 | 10:05:27.77 | 00:04:35.5 | 20.43 | 0.43 | 0.01 | 0.01 | 1.09 | HB |
| 39 | 10:05:30.44 | 00:04:22.9 | 20.44 | 0.46 | 0.02 | 0.01 | 0.39 | HB |
| 40 | 10:05:28.24 | 00:03:34.3 | 20.45 | 0.29 | 0.01 | 0.01 | 1.18 | HB |
| 41 | 10:05:29.61 | 00:04:21.3 | 20.45 | 0.51 | 0.01 | 0.01 | 0.59 | HB |
| 42 | 10:05:34.00 | 00:04:27.4 | 20.45 | 0.49 | 0.01 | 0.01 | 0.54 | HB |
| 43 | 10:05:35.85 | 00:04:15.8 | 20.46 | 0.44 | 0.01 | 0.01 | 0.98 | HB |
| 44 | 10:05:29.65 | 00:04:12.0 | 20.47 | 0.35 | 0.04 | 0.01 | 0.58 | HB |
| 45 | 10:05:27.39 | 00:05:09.7 | 20.47 | 0.38 | 0.02 | 0.01 | 1.43 | HB |
| 46 | 10:05:31.53 | 00:04:40.5 | 20.47 | 0.45 | 0.01 | 0.01 | 0.39 | HB |
| 47 | 10:05:28.80 | 00:04:10.9 | 20.48 | 0.51 | 0.01 | 0.01 | 0.80 | HB |
| 48 | 10:05:29.12 | 00:03:45.8 | 20.49 | 0.49 | 0.02 | 0.01 | 0.89 | HB |
| 49 | 10:05:35.95 | 00:05:05.6 | 20.50 | 0.48 | 0.01 | 0.01 | 1.28 | HB |
| 50 | 10:05:31.82 | 00:04:25.4 | 20.51 | 0.75 | 0.02 | 0.01 | 0.13 | RGB |
| 51 | 10:05:28.34 | 00:04:48.7 | 20.54 | 0.76 | 0.01 | 0.01 | 1.04 | RGB |
| 52 | 10:05:36.69 | 00:03:15.7 | 20.54 | 0.39 | 0.01 | 0.01 | 1.58 | HB |
| 53 | 10:05:31.54 | 00:04:21.7 | 20.54 | 0.41 | 0.02 | 0.01 | 0.12 | HB |
| 54 | 10:05:38.09 | 00:04:53.3 | 20.61 | 0.74 | 0.01 | 0.01 | 1.64 | RGB |
| 55 | 10:05:30.53 | 00:04:37.3 | 20.61 | 0.47 | 0.02 | 0.01 | 0.48 | HB |
| 56 | 10:05:33.21 | 00:05:06.2 | 20.63 | 0.75 | 0.02 | 0.01 | 0.86 | RGB |
| 57 | 10:05:35.28 | 00:03:43.1 | 20.70 | 0.40 | 0.01 | 0.01 | 1.02 | HB |
| 58 | 10:05:21.84 | 00:01:05.8 | 20.70 | 0.49 | 0.04 | 0.03 | 4.08 | HB |
| 59 | 10:05:33.41 | 00:04:28.5 | 20.70 | 0.42 | 0.02 | 0.01 | 0.40 | HB |
| 60 | 10:05:32.37 | 00:04:12.1 | 20.72 | 0.72 | 0.02 | 0.01 | 0.14 | RGB |
| 61 | 10:05:20.31 | 00:07:37.3 | 20.76 | 0.42 | 0.02 | 0.01 | 4.42 | HB |
Table A.2. (continued)
Id
(2000)
(2000)
radius
Type
[h:m:s]
[∘:′:′′]
[mag]
[mag]
[mag]
[mag]
[′]
62
10:05:30.12
00:04:46.0
20.86
0.72
0.02
0.01
0.65
RGB
63
10:05:30.87
00:04:39.9
20.92
0.69
0.02
0.02
0.45
RGB
64
10:05:31.51
00:04:54.5
20.95
0.68
0.02
0.01
0.62
RGB
65
10:05:31.88
00:06:17.2
20.96
0.66
0.02
0.02
1.99
RGB
66
10:05:25.51
00:04:15.7
21.01
0.71
0.02
0.01
1.61
RGB
67
10:05:35.85
00:04:54.5
21.02
0.70
0.01
0.01
1.15
RGB
68
10:05:32.48
00:04:13.6
21.03
0.72
0.02
0.02
0.15
RGB
69
10:05:42.34
00:01:04.2
21.05
0.69
0.04
0.03
4.14
RGB
70
10:05:33.10
00:04:11.9
21.07
0.70
0.02
0.02
0.31
RGB
71
10:05:29.63
00:04:23.8
21.10
0.71
0.02
0.02
0.59
RGB
72
10:05:33.12
00:04:36.1
21.14
0.73
0.03
0.02
0.42
RGB
73
10:05:30.90
00:04:48.5
21.17
0.66
0.04
0.03
0.57
RGB
74
10:05:33.18
00:03:59.9
21.22
0.63
0.02
0.02
0.43
RGB
75
10:05:30.90
00:04:33.9
21.28
0.63
0.02
0.02
0.37
RGB
76
10:05:31.21
00:05:03.3
21.32
0.70
0.02
0.02
0.78
RGB
77
10:05:32.30
00:03:55.3
21.36
0.73
0.02
0.03
0.39
RGB
78
10:05:37.93
00:04:07.8
21.42
0.72
0.02
0.01
1.50
RGB
79
10:05:32.77
00:04:15.2
21.43
0.66
0.02
0.02
0.21
RGB
80
10:05:29.94
00:04:28.5
21.48
0.68
0.02
0.01
0.53
RGB
81
10:05:33.44
00:04:25.2
21.51
0.70
0.02
0.02
0.39
RGB
82
10:05:25.75
00:04:20.8
21.52
0.66
0.02
0.01
1.55
RGB
83
10:05:30.78
00:04:29.1
21.57
0.61
0.03
0.02
0.35
RGB
84
10:05:30.89
00:03:51.0
21.58
0.65
0.03
0.02
0.52
RGB
85
10:05:38.12
00:05:00.2
21.63
0.67
0.02
0.01
1.70
RGB
86
10:05:29.29
00:04:24.8
21.66
0.69
0.02
0.02
0.68
RGB
87
10:05:29.48
00:03:20.0
21.70
0.68
0.02
0.02
1.15
RGB
88
10:05:32.08
00:04:16.7
21.71
0.65
0.03
0.02
0.04
RGB
89
10:05:32.02
00:04:51.4
21.73
0.66
0.02
0.02
0.56
RGB
90
10:05:28.88
00:04:12.1
21.76
0.66
0.03
0.02
0.77
RGB
91
10:05:28.96
00:04:20.4
21.77
0.69
0.02
0.01
0.75
RGB
92
10:05:31.12
00:04:32.2
21.78
0.62
0.03
0.03
0.31
RGB
93
10:05:32.00
00:04:22.0
21.80
0.69
0.03
0.03
0.07
RGB
94
10:05:30.37
00:04:03.1
21.81
0.65
0.05
0.04
0.47
RGB
95
10:05:33.34
00:04:18.2
21.83
0.65
0.04
0.02
0.35
RGB
96
10:05:31.61
00:04:12.2
21.88
0.62
0.04
0.03
0.13
RGB
97
10:05:32.43
00:03:59.8
21.89
0.59
0.03
0.02
0.33
RGB
98
10:05:29.36
00:08:33.4
21.92
0.66
0.04
0.03
4.31
RGB
99
10:05:31.72
00:04:19.8
21.92
0.67
0.03
0.02
0.07
RGB
100
10:05:35.42
00:03:07.8
21.92
0.62
0.02
0.02
1.46
RGB
101
10:05:33.85
00:06:17.2
21.93
0.64
0.03
0.03
2.04
RGB
102
10:05:33.59
00:02:53.0
21.93
0.65
0.02
0.01
1.48
RGB
103
10:05:30.03
00:04:28.1
21.94
0.70
0.02
0.02
0.51
RGB
104
10:05:32.34
00:04:21.4
21.98
0.63
0.03
0.03
0.11
RGB
105
10:05:33.53
00:04:20.9
21.99
0.68
0.03
0.02
0.40
RGB
106
10:05:29.06
00:04:29.4
22.02
0.60
0.03
0.02
0.75
RGB
107
10:05:37.11
00:04:58.6
22.02
0.65
0.02
0.02
1.46
RGB
108
10:05:36.87
00:03:42.5
22.04
0.64
0.03
0.03
1.36
RGB
109
10:05:33.07
00:04:09.4
22.04
0.69
0.03
0.02
0.32
RGB
110
10:05:23.81
00:04:22.7
22.07
0.64
0.02
0.02
2.04
RGB
111
10:05:40.33
00:09:14.9
22.09
0.60
0.04
0.03
5.37
RGB
112
10:05:27.96
00:04:26.0
22.10
0.71
0.03
0.02
1.01
RGB
113
10:05:21.85
00:07:41.0
22.10
0.58
0.04
0.03
4.22
RGB
114
10:05:41.53
00:05:45.4
22.14
0.67
0.05
0.03
2.80
RGB
115
10:05:33.00
00:06:34.6
22.16
0.59
0.04
0.03
2.29
RGB
116
10:05:31.59
00:03:28.9
22.17
0.59
0.03
0.02
0.82
RGB
117
10:05:29.98
00:04:27.1
22.18
0.64
0.04
0.04
0.52
RGB
118
10:05:28.18
00:04:35.3
22.18
0.57
0.03
0.02
0.98
RGB
119
10:05:28.65
00:05:48.8
22.18
0.65
0.03
0.02
1.72
RGB
120
10:05:34.50
00:04:42.8
22.20
0.70
0.03
0.02
0.76
RGB
121
10:05:30.95
00:04:12.4
22.21
0.59
0.04
0.03
0.27
RGB
122
10:05:33.34
00:05:35.4
22.23
0.70
0.04
0.04
1.34
RGB
123
10:05:32.15
00:04:51.1
22.23
0.63
0.04
0.02
0.55
RGB
124
10:05:30.30
00:04:07.6
22.23
0.63
0.04
0.03
0.45
RGB
125
10:05:33.96
00:03:30.5
22.24
0.63
0.04
0.03
0.94
RGB
126
10:05:27.88
00:08:29.6
22.26
0.60
0.05
0.04
4.31
RGB
127
10:05:31.40
00:03:25.4
22.26
0.64
0.05
0.03
0.89
RGB
128
10:05:31.84
00:04:42.6
22.27
0.70
0.04
0.03
0.41
RGB
129
10:05:30.64
00:03:16.8
22.30
0.63
0.04
0.03
1.07
RGB
130
10:05:31.42
00:03:36.1
22.30
0.65
0.04
0.03
0.71
RGB
131
10:05:32.78
00:04:09.7
22.30
0.64
0.06
0.04
0.25
RGB
132
10:05:29.59
00:04:26.3
22.34
0.64
0.03
0.03
0.61
RGB
133
10:05:31.92
00:05:08.9
22.35
0.69
0.05
0.04
0.85
RGB
134
10:05:34.04
00:03:44.3
22.35
0.56
0.04
0.04
0.77
RGB
135
10:05:28.01
00:04:06.1
22.36
0.66
0.04
0.03
1.00
RGB
136
10:05:32.55
00:03:34.7
22.39
0.67
0.04
0.03
0.74
RGB
137
10:05:32.12
00:04:57.7
22.40
0.71
0.06
0.05
0.66
RGB
138
10:05:29.26
00:03:44.5
22.41
0.62
0.04
0.03
0.88
RGB
139
10:05:30.79
00:04:24.1
22.44
0.62
0.05
0.03
0.31
RGB
140
10:05:36.89
00:06:35.1
22.44
0.56
0.05
0.03
2.60
RGB
141
10:05:37.92
00:02:41.4
22.45
0.57
0.07
0.07
2.20
RGB
142
10:05:30.71
00:03:46.7
22.48
0.66
0.04
0.04
0.61
RGB
143
10:05:32.34
00:04:05.6
22.48
0.62
0.04
0.04
0.23
RGB
144
10:05:33.16
00:04:33.6
22.48
0.71
0.05
0.04
0.40
RGB
145
10:05:33.91
00:04:48.9
22.48
0.59
0.03
0.02
0.71
RGB
146
10:05:30.26
00:03:45.6
22.52
0.69
0.05
0.04
0.69
RGB
147
10:05:37.41
00:06:11.1
22.52
0.56
0.05
0.03
2.33
RGB
148
10:05:28.19
00:03:26.2
22.52
0.66
0.04
0.04
1.28
RGB
149
10:05:24.98
00:04:14.3
22.52
0.69
0.04
0.04
1.74
RGB
150
10:05:32.97
00:04:37.8
22.53
0.55
0.05
0.03
0.42
RGB
151
10:05:32.30
00:03:22.6
22.60
0.67
0.05
0.03
0.93
RGB
152
10:05:27.74
00:03:19.7
22.62
0.59
0.04
0.04
1.43
RGB
153
10:05:29.79
00:03:46.0
22.62
0.67
0.05
0.04
0.76
RGB
| Id | (2000) | (2000) | radius | Type | ||||
|---|---|---|---|---|---|---|---|---|
| [h:m:s] | [∘:′:′′] | [mag] | [mag] | [mag] | [mag] | [′] | ||
| 1 | 16:11:05.81 | 14:57:45.1 | 17.37 | 1.39 | 0.02 | 0.01 | 1.28 | RGB |
| 2 | 16:10:58.73 | 14:56:48.7 | 17.77 | 1.29 | 0.02 | 0.01 | 0.80 | RGB |
| 3 | 16:10:54.90 | 14:58:36.7 | 18.23 | 1.07 | 0.01 | 0.01 | 1.80 | AGB? |
| 4 | 16:11:04.98 | 14:53:32.3 | 18.48 | 1.10 | 0.02 | 0.01 | 4.07 | RGB |
| 5 | 16:10:59.24 | 14:57:22.5 | 18.52 | 0.99 | 0.01 | 0.01 | 0.35 | AGB? |
| 6 | 16:10:53.36 | 14:56:45.4 | 18.56 | 1.04 | 0.01 | 0.01 | 1.90 | RGB |
| 7 | 16:10:54.04 | 14:57:05.6 | 18.70 | 1.03 | 0.01 | 0.01 | 1.64 | RGB |
| 8 | 16:10:56.90 | 14:57:56.5 | 18.84 | 0.99 | 0.01 | 0.01 | 1.02 | RGB |
| 9 | 16:11:01.40 | 14:57:60.0 | 19.05 | 0.99 | 0.01 | 0.01 | 0.56 | RGB |
| 10 | 16:11:05.89 | 14:58:43.2 | 19.19 | 0.93 | 0.02 | 0.01 | 1.78 | RGB |
| 11 | 16:11:06.00 | 14:55:39.1 | 19.37 | 0.95 | 0.01 | 0.01 | 2.23 | RGB |
| 12 | 16:10:56.21 | 14:56:32.7 | 19.41 | 0.90 | 0.01 | 0.01 | 1.42 | RGB |
| 13 | 16:10:56.98 | 14:56:25.8 | 19.44 | 0.92 | 0.01 | 0.01 | 1.37 | RGB |
| 14 | 16:10:59.24 | 14:57:19.7 | 19.50 | 0.90 | 0.02 | 0.01 | 0.37 | RGB |
| 15 | 16:10:55.84 | 14:57:43.4 | 19.60 | 0.69 | 0.01 | 0.01 | 1.19 | AGB |
| 16 | 16:10:59.62 | 15:01:32.9 | 19.68 | 0.81 | 0.02 | 0.01 | 4.09 | RGB |
| 17 | 16:11:00.58 | 14:56:59.1 | 19.76 | 0.86 | 0.01 | 0.01 | 0.48 | RGB |
| 18 | 16:11:03.91 | 14:56:34.3 | 19.77 | 0.59 | 0.01 | 0.01 | 1.19 | AGB |
| 19 | 16:11:01.01 | 14:55:23.1 | 19.78 | 0.69 | 0.01 | 0.01 | 2.09 | AGB |
| 20 | 16:11:07.42 | 14:57:43.2 | 19.86 | 0.86 | 0.01 | 0.01 | 1.65 | RGB |
| 21 | 16:10:52.81 | 14:55:38.9 | 19.87 | 0.84 | 0.01 | 0.01 | 2.62 | RGB |
| 22 | 16:10:56.17 | 14:55:48.1 | 19.88 | 0.46 | 0.01 | 0.01 | 1.99 | HB |
| 23 | 16:11:02.52 | 14:56:49.7 | 19.88 | 0.62 | 0.01 | 0.01 | 0.78 | HB |
| 24 | 16:11:10.09 | 14:55:54.9 | 19.89 | 0.88 | 0.02 | 0.01 | 2.76 | RGB |
| 25 | 16:11:04.45 | 14:56:14.4 | 19.90 | 0.65 | 0.01 | 0.01 | 1.53 | HB |
| 26 | 16:10:59.32 | 14:57:25.9 | 19.92 | 0.84 | 0.02 | 0.01 | 0.32 | RGB |
| 27 | 16:11:16.22 | 15:00:07.1 | 19.92 | 0.47 | 0.02 | 0.01 | 4.60 | HB |
| 28 | 16:10:59.89 | 14:53:27.8 | 19.92 | 0.92 | 0.03 | 0.02 | 4.01 | RGB |
| 29 | 16:11:12.60 | 14:56:55.2 | 19.93 | 0.46 | 0.02 | 0.01 | 2.94 | HB |
| 30 | 16:11:13.56 | 14:57:58.2 | 19.95 | 0.85 | 0.02 | 0.01 | 3.16 | RGB |
| 31 | 16:11:01.64 | 14:59:47.8 | 19.95 | 0.80 | 0.02 | 0.02 | 2.34 | RGB |
| 32 | 16:10:56.39 | 14:57:25.1 | 19.96 | 0.84 | 0.01 | 0.02 | 1.03 | RGB |
| 33 | 16:11:09.37 | 14:57:37.5 | 19.97 | 0.61 | 0.02 | 0.01 | 2.11 | HB |
| 34 | 16:10:58.62 | 14:57:40.3 | 19.97 | 0.83 | 0.01 | 0.01 | 0.53 | RGB |
| 35 | 16:11:09.57 | 15:01:07.7 | 19.98 | 0.58 | 0.02 | 0.02 | 4.25 | HB |
| 36 | 16:10:59.15 | 14:57:38.0 | 19.98 | 0.76 | 0.01 | 0.01 | 0.40 | HB? |
| 37 | 16:10:56.20 | 14:57:34.4 | 19.99 | 0.61 | 0.01 | 0.01 | 1.08 | HB |
| 38 | 16:11:01.76 | 14:58:06.8 | 19.99 | 0.61 | 0.01 | 0.01 | 0.70 | HB |
| 39 | 16:10:59.72 | 14:57:45.6 | 20.00 | 0.58 | 0.01 | 0.01 | 0.37 | HB |
| 40 | 16:10:59.15 | 14:55:01.8 | 20.03 | 0.67 | 0.02 | 0.02 | 2.46 | HB |
| 41 | 16:11:00.81 | 14:57:53.4 | 20.03 | 0.58 | 0.02 | 0.01 | 0.42 | HB |
| 42 | 16:10:53.24 | 14:57:50.2 | 20.03 | 0.55 | 0.01 | 0.01 | 1.83 | HB |
| 43 | 16:10:53.08 | 14:56:22.9 | 20.03 | 0.55 | 0.02 | 0.01 | 2.13 | HB |
| 44 | 16:10:55.09 | 14:57:44.3 | 20.04 | 0.60 | 0.01 | 0.01 | 1.37 | HB |
| 45 | 16:11:01.49 | 14:57:46.0 | 20.04 | 0.58 | 0.02 | 0.01 | 0.36 | HB |
| 46 | 16:11:08.53 | 14:53:09.0 | 20.04 | 0.50 | 0.02 | 0.01 | 4.72 | HB |
| 47 | 16:10:53.97 | 14:56:35.4 | 20.06 | 0.55 | 0.01 | 0.02 | 1.84 | HB |
| 48 | 16:11:03.24 | 14:57:44.9 | 20.06 | 0.62 | 0.01 | 0.01 | 0.69 | HB |
| 49 | 16:11:16.01 | 14:54:36.2 | 20.07 | 0.64 | 0.03 | 0.02 | 4.69 | HB |
| 50 | 16:11:02.83 | 14:57:09.0 | 20.07 | 0.56 | 0.01 | 0.01 | 0.62 | HB |
| 51 | 16:10:59.37 | 14:57:43.5 | 20.07 | 0.57 | 0.01 | 0.01 | 0.40 | HB |
| 52 | 16:10:53.27 | 14:56:27.2 | 20.07 | 0.54 | 0.01 | 0.01 | 2.05 | HB |
| 53 | 16:11:00.38 | 14:57:40.7 | 20.08 | 0.55 | 0.02 | 0.01 | 0.22 | HB |
| 54 | 16:11:09.51 | 14:59:43.9 | 20.08 | 0.57 | 0.02 | 0.01 | 3.12 | HB |
| 55 | 16:10:59.25 | 14:57:14.0 | 20.08 | 0.58 | 0.01 | 0.01 | 0.41 | HB |
| 56 | 16:10:59.65 | 14:56:43.4 | 20.11 | 0.59 | 0.01 | 0.02 | 0.78 | HB |
| 57 | 16:11:00.94 | 14:58:50.3 | 20.11 | 0.41 | 0.01 | 0.01 | 1.37 | HB |
| 58 | 16:11:01.91 | 14:57:53.2 | 20.11 | 0.84 | 0.01 | 0.02 | 0.52 | RGB |
| 59 | 16:10:56.97 | 14:57:28.0 | 20.11 | 0.56 | 0.01 | 0.01 | 0.89 | HB |
| 60 | 16:10:57.39 | 14:56:01.3 | 20.13 | 0.86 | 0.02 | 0.02 | 1.65 | RGB |
| 61 | 16:11:01.71 | 14:57:36.9 | 20.14 | 0.57 | 0.01 | 0.01 | 0.30 | HB |
| 62 | 16:10:59.47 | 14:56:03.6 | 20.19 | 0.67 | 0.01 | 0.01 | 1.44 | HB |
| 63 | 16:11:13.75 | 14:54:18.3 | 20.24 | 0.88 | 0.04 | 0.02 | 4.48 | RGB |
| 64 | 16:10:59.47 | 14:58:02.1 | 20.28 | 0.84 | 0.02 | 0.02 | 0.63 | RGB |
| 65 | 16:10:59.65 | 14:55:42.4 | 20.30 | 0.79 | 0.01 | 0.02 | 1.78 | RGB |
| 66 | 16:10:58.97 | 14:55:28.4 | 20.33 | 0.82 | 0.02 | 0.01 | 2.04 | RGB |
| 67 | 16:10:54.49 | 14:57:19.5 | 20.34 | 0.82 | 0.01 | 0.01 | 1.49 | RGB |
| 68 | 16:10:59.66 | 14:58:18.5 | 20.38 | 0.83 | 0.02 | 0.02 | 0.87 | RGB |
| 69 | 16:11:01.04 | 14:58:32.6 | 20.39 | 0.83 | 0.02 | 0.02 | 1.08 | RGB |
| 70 | 16:11:15.80 | 14:57:55.6 | 20.41 | 0.91 | 0.02 | 0.02 | 3.69 | RGB |
| 71 | 16:10:57.31 | 14:59:21.7 | 20.42 | 0.44 | 0.02 | 0.01 | 2.06 | HB? |
| 72 | 16:11:08.15 | 14:57:40.5 | 20.48 | 0.77 | 0.02 | 0.02 | 1.82 | RGB |
| 73 | 16:11:07.45 | 14:58:30.7 | 20.51 | 0.79 | 0.02 | 0.02 | 1.95 | RGB |
| 74 | 16:11:03.28 | 14:58:04.1 | 20.54 | 0.81 | 0.02 | 0.02 | 0.87 | RGB |
| 75 | 16:10:56.94 | 14:57:10.5 | 20.58 | 0.78 | 0.02 | 0.02 | 0.94 | RGB |
| 76 | 16:10:57.67 | 14:57:19.1 | 20.60 | 0.74 | 0.01 | 0.02 | 0.73 | RGB |
| 77 | 16:10:59.59 | 14:57:20.1 | 20.67 | 0.74 | 0.01 | 0.02 | 0.29 | RGB |
| 78 | 16:11:11.43 | 14:58:09.6 | 20.67 | 0.81 | 0.02 | 0.02 | 2.69 | RGB |
| 79 | 16:11:00.93 | 14:57:31.7 | 20.83 | 0.74 | 0.02 | 0.03 | 0.09 | RGB |
| 80 | 16:10:58.97 | 14:53:23.0 | 20.85 | 0.81 | 0.03 | 0.02 | 4.11 | RGB |
| 81 | 16:11:07.10 | 14:58:17.8 | 20.85 | 0.78 | 0.02 | 0.02 | 1.76 | RGB |
| 82 | 16:11:01.63 | 14:55:27.6 | 20.90 | 0.77 | 0.02 | 0.03 | 2.02 | RGB |
| 83 | 16:11:00.90 | 14:58:06.8 | 20.97 | 0.70 | 0.02 | 0.03 | 0.65 | RGB |
| 84 | 16:10:59.36 | 14:56:58.3 | 20.98 | 0.76 | 0.02 | 0.03 | 0.59 | RGB |
| 85 | 16:11:17.29 | 14:56:19.9 | 21.00 | 0.72 | 0.02 | 0.02 | 4.18 | RGB |
| 86 | 16:10:54.40 | 14:58:31.1 | 21.02 | 0.74 | 0.02 | 0.02 | 1.84 | RGB |
| 87 | 16:10:54.08 | 14:58:33.6 | 21.05 | 0.77 | 0.02 | 0.03 | 1.93 | RGB |
| 88 | 16:11:02.26 | 14:58:25.2 | 21.10 | 0.82 | 0.02 | 0.04 | 1.03 | RGB |
| 89 | 16:11:06.41 | 14:53:22.1 | 21.12 | 0.85 | 0.02 | 0.04 | 4.33 | RGB |
| 90 | 16:11:09.75 | 14:57:55.8 | 21.18 | 0.75 | 0.02 | 0.04 | 2.25 | RGB |
Table A.3. (continued)
Id
(2000)
(2000)
radius
Type
[h:m:s]
[∘:′:′′]
[mag]
[mag]
[mag]
[mag]
[′]
91
16:11:05.62
14:58:45.8
21.18
0.69
0.02
0.03
1.77
RGB
92
16:11:07.25
14:57:11.9
21.21
0.79
0.02
0.04
1.62
RGB
93
16:11:02.05
14:58:21.3
21.21
0.70
0.02
0.04
0.95
RGB
94
16:10:57.26
14:57:35.4
21.23
0.71
0.02
0.03
0.83
RGB
95
16:11:00.23
14:58:02.6
21.23
0.72
0.02
0.03
0.58
RGB
96
16:10:59.37
14:57:35.3
21.24
0.72
0.02
0.03
0.33
RGB
97
16:11:03.92
14:56:21.7
21.29
0.70
0.03
0.03
1.36
RGB
98
16:10:59.12
14:56:52.0
21.30
0.74
0.02
0.04
0.70
RGB
99
16:11:05.63
14:59:20.3
21.30
0.76
0.03
0.05
2.22
RGB
100
16:11:00.25
14:58:12.4
21.35
0.78
0.03
0.04
0.75
RGB
101
16:11:08.20
14:58:53.5
21.40
0.69
0.02
0.03
2.31
RGB
102
16:10:59.70
14:57:29.8
21.41
0.77
0.02
0.04
0.23
RGB
103
16:11:01.68
14:57:09.4
21.42
0.73
0.02
0.04
0.40
RGB
104
16:10:58.82
14:57:17.6
21.43
0.76
0.02
0.04
0.47
RGB
105
16:11:00.37
14:57:45.6
21.47
0.73
0.03
0.04
0.30
RGB
106
16:11:01.58
14:58:49.8
21.48
0.74
0.02
0.04
1.38
RGB
107
16:10:57.76
14:55:27.3
21.54
0.81
0.03
0.05
2.13
RGB
108
16:11:00.59
14:57:03.1
21.56
0.67
0.03
0.05
0.42
RGB
109
16:11:01.72
14:57:56.4
21.59
0.75
0.02
0.04
0.54
RGB
110
16:11:03.46
14:56:35.5
21.65
0.75
0.02
0.05
1.11
RGB
111
16:11:02.28
14:58:13.4
21.66
0.63
0.03
0.04
0.85
RGB
112
16:11:00.03
14:57:27.7
21.72
0.78
0.03
0.05
0.15
RGB
113
16:10:55.84
14:56:54.1
21.72
0.73
0.03
0.06
1.29
RGB
114
16:11:15.66
14:59:26.6
21.74
0.74
0.03
0.06
4.13
RGB
115
16:11:02.13
14:57:17.1
21.75
0.79
0.05
0.05
0.40
RGB
116
16:11:01.79
14:55:48.3
21.76
0.68
0.03
0.05
1.68
RGB
117
16:11:00.66
14:57:03.8
21.78
0.68
0.03
0.04
0.40
RGB
118
16:10:58.93
14:57:53.1
21.80
0.70
0.02
0.05
0.59
RGB
119
16:11:01.50
14:58:28.3
21.82
0.71
0.03
0.05
1.02
RGB
120
16:10:57.79
14:56:23.9
21.83
0.69
0.03
0.05
1.27
RGB
121
16:11:04.03
15:02:01.1
21.84
0.78
0.03
0.06
4.62
RGB
122
16:10:58.53
14:57:02.2
21.85
0.65
0.03
0.05
0.67
RGB
123
16:11:01.37
14:57:40.2
21.87
0.78
0.03
0.05
0.27
RGB
124
16:10:55.65
14:57:12.9
21.92
0.64
0.03
0.06
1.23
RGB
125
16:11:01.20
14:58:37.3
21.92
0.66
0.02
0.04
1.16
RGB
126
16:11:00.14
14:58:22.3
21.93
0.67
0.04
0.06
0.91
RGB
127
16:11:05.39
14:56:59.9
21.94
0.69
0.04
0.07
1.24
RGB
128
16:10:55.79
14:58:02.7
22.00
0.72
0.04
0.06
1.31
RGB
129
16:10:59.39
15:01:17.9
22.01
0.62
0.04
0.05
3.84
RGB
130
16:11:00.63
14:58:27.8
22.01
0.78
0.03
0.07
0.99
RGB
131
16:10:59.19
14:56:02.5
22.02
0.71
0.03
0.08
1.47
RGB
132
16:11:10.01
14:58:51.7
22.06
0.75
0.02
0.04
2.66
RGB
133
16:11:02.13
14:57:03.0
22.08
0.72
0.03
0.07
0.55
RGB
134
16:10:58.95
14:58:04.7
22.10
0.61
0.04
0.07
0.74
RGB
135
16:10:55.42
14:57:20.6
22.11
0.69
0.04
0.07
1.27
RGB
136
16:10:57.33
14:57:23.4
22.14
0.61
0.05
0.07
0.81
RGB
137
16:11:03.62
14:57:22.5
22.15
0.76
0.04
0.07
0.72
RGB
138
16:11:00.66
14:56:51.7
22.18
0.68
0.04
0.08
0.61
RGB
139
16:11:00.83
14:58:22.2
22.24
0.69
0.04
0.08
0.90
RGB
140
16:11:01.28
14:56:51.2
22.27
0.71
0.04
0.11
0.63
RGB
141
16:10:54.85
15:00:45.2
22.29
0.70
0.05
0.09
3.57
RGB
142
16:11:03.71
14:57:16.6
22.30
0.78
0.04
0.09
0.76
RGB
143
16:11:04.49
14:57:38.2
22.31
0.70
0.05
0.09
0.94
RGB
References
- (1) Armandroff, T. E., Da Costa, G. S., & Zinn, R. 1992, AJ, 104, 164
- (2) Baumgardt, H., Grebel, E. K., & Kroupa, P. 2005, MNRAS, 359, L1
- (3) Bekenstein, J., & Milgrom, M. 1984, ApJ, 286, 7
- (4) Catelan, M., Ferraro, F. R., & Rood, R. T. 2001, ApJ, 560, 970
- (5) Djorgovsky, S., & Meylan, G. 1993, in: Structure and Dynamics of Globular Clusters, ASP Conf.Ser. 50, eds. G. Meylan and S. Djorgovski (San Francisco: A.S.P.), 325
- (6) Harris, W. E. 1996, AJ 112, 1487
- (7) Harris, W. E., & van den Bergh, S. 1984, AJ, 89, 1816
- (8) Holland, S., & Harris W. E. 1992, AJ, 103, 131
- (9) Kim, Y., Demarque, P., Yi, S. K., & Alexander, D. R. 2002, ApJS, 143, 499
- (10) King, I. 1962, AJ, 67, 471
- (11) Mackey, A. D., & Gilmore, G. F. 2004, MNRAS, 355, 504
- (12) Mackey, A. D., & van den Bergh, S. 2005, MNRAS, 360, 631
- (13) Madore, B. F., & Freedman, W. L. 1989, ApJ, 340, 812
- (14) Mashchenko, S., & Sills, A. 2005, ApJ, 619, 243
- (15) Milgrom, M. 1983, ApJ, 270, 365
- (16) Ortolani, S., & Gratton, R. G. 1989, A&AS, 79, 155
- (17) Sarajedini, A. 1997, AJ, 113, 682
- (18) Schlegel, D. J., Finkbeiner, D. P.,& Davis, M. 1998, ApJ, 500, 525
- (19) Searle, L., & Zinn, R. 1978, ApJ, 225, 357
- (20) Sohn, Y.-J., Park, J.-H., Rey, S.-C., et al. 2003, AJ, 126, 803
- (21) Stetson, P. B. 1987, PASP, 99, 191
- (22) Stetson, P. B. 1992, in: Astronomical Data Analysis Software and Systems I, ASP Conf.Ser. 25, eds. D.M. Worrall, C. Biemesderfer, and J. Barnes, (San Francisco: A.S.P.), 297
- (23) Stetson, P. B., Bolte, M., Harris, W. E., et al. 1999, AJ, 117, 247
- (24) Suntzeff, N., Olszewski, E., & Stetson, P. B. 1985, AJ, 90, 1481
- (25) Trager, S. C., Djorgovski, S., & King I. R. 1993, in Structure and Dynamics of Globular Clusters, ASP Conf.Ser. 50, eds. S.G. Djorgovski and G. Meylan (San Francisco: A.S.P.), 347
- (26) VandenBerg, D.A. 2000, ApJS, 129, 315
- (27) van den Bergh, S., & Mackey, A. D. 2004, MNRAS, 354, 713
- (28) van den Bergh, S., Morbey, C., & Pazder J. 1991, ApJ, 375, 594
- (29) Webbink, R. F. 1985, in: Dynamics of Star Clusters, IAU Symposium 113, eds. J. Goodman and P. Hut, (Dordrecht: Reidel), 541
- (30) Zinn, R. 1985, ApJ, 293, 424
- (31) Zinn, R. 1993, in: The Globular Cluster-Galaxy Connection, ASP Conf.Ser. 48, eds. G.H. Smith and J.P. Brodie, (San Francisco: A.S.P.), 38