Testing Theoretical Evolutionary Models with AB Dor C and the Initial Mass Function11affiliation: Based on observations made with ESO Telescopes at the Paranal Observatories under program ID 60.A-9026. This publication makes use of data products from the Two Micron All Sky Survey, which is a joint project of the University of Massachusetts and the Infrared Processing and Analysis Center/California Institute of Technology, funded by the National Aeronautics and Space Administration and the National Science Foundation.
Abstract
In this paper, we assess the constraints on the evolutionary models of young low-mass objects that are provided by the measurements of the companion AB Dor C by Close and coworkers and by a new comparison of model-derived initial mass functions (IMFs) of star-forming regions to the well-calibrated IMF of the solar neighborhood. After performing an independent analysis of all of the imaging and spectroscopic data for AB Dor C that were obtained by Close, we find that AB Dor C (which has no methane) is not detected at a significant level (signal-to-noise) in the simultaneous differential images (SDI) when one narrow-band image is subtracted from another, but that it does appear in the individual SDI frames as well as the images at , , and . Our broad band photometry for AB Dor C is consistent with that of Close. However, the photometric uncertainties that we measure are larger than those derived by Close; our uncertainties are consistent with those measured in other studies using the same adaptive optics system. Using the age of -150 Myr recently estimated for AB Dor by Luhman, Stauffer, and Mamajek, the luminosity predicted by the models of Chabrier and Baraffe is consistent with the value that we estimate from the photometry for AB Dor C. We measure a spectral type of M6 from the -band spectrum of AB Dor C, which is earlier than the value of M8 reported by Close and is consistent with the model predictions when a dwarf temperature scale is adopted. In a test of these evolutionary models at much younger ages, we show that the low-mass IMFs that they produce for star-forming regions are similar to the IMF of the solar neighborhood. If the masses of the low-mass stars and brown dwarfs in these IMFs of star-forming regions were underestimated by a factor of two as suggested by Close, then the IMF characterizing the current generation of Galactic star formation would have to be radically different from the IMF of the solar neighborhood.
Subject headings:
instrumentation: adaptive optics — binaries: visual — stars: formation — stars: low-mass, brown dwarfs — stars: pre-main sequence1. Introduction
For decades, theoretical evolutionary models have been an essential tool for interpreting the positions of stellar populations on the Hertzsprung-Russell diagram. In particular, studies of star and planet formation have relied on these models to provide estimates of masses and ages of members of star-forming regions ( Myr). Because the uncertainties in the models are largest at such early stages (Baraffe et al., 2002), observational tests of the masses and ages inferred from the models have been crucial (White et al., 1999; Luhman, 1999; Simon et al., 2000; Palla & Stahler, 2001; Baraffe et al., 2002; Luhman et al., 2003; Hillenbrand & White, 2004; Stassun et al., 2004). However, for young objects with masses below 0.3 , fewer tests of the mass estimates are available (Mohanty et al., 2004; Reiners et al., 2005). Recently, Close et al. (2005) partially addressed this problem by measuring a dynamical mass for a low-mass companion, AB Dor C, that is much older than star-forming regions but still above the main sequence. This object was first detected indirectly by Guirado et al. (1997) through astrometry of AB Dor, which is a well-studied nearby young K-type star ( pc). Close et al. (2005) resolved AB Dor C from the primary with adaptive optics (AO) images and used a combination of these data and the astrometry from Guirado et al. (1997) to arrive at a mass of . After adopting an age of 50 Myr for the AB Dor system, they found that the theoretical evolutionary models of Chabrier et al. (2000) overestimated the near-infrared (IR) fluxes of AB Dor C by roughly one magnitude. As a result, Close et al. (2005) concluded that these models underestimate the masses of young low-mass objects by a factor of two and that many of the objects previously identified as brown dwarfs in star-forming regions and open clusters are instead low-mass stars.
The observations of AB Dor C by Close et al. (2005) (hereafter C05) potentially provide an important new test of the theoretical evolutionary models of low-mass objects. However, the results of this test hinge on reliable measurements of the mass, age, luminosity, and temperature of AB Dor C. Luhman, Stauffer, & Mamajek (2005) recently reexamined the age constraints of the AB Dor system, concluding that it has the same age as the Pleiades open cluster (-125 Myr), which removed the discrepancy between the luminosity reported by C05 and the value predicted by the models of Chabrier et al. (2000). In this paper, we reexamine other stellar properties of AB Dor C, namely its luminosity and temperature, and describe the constraints these data provide for evolutionary models (§ 2). In addition, we present a second test of the models at low masses, but now at much younger ages ( Myr), in which we compare the low-mass initial mass function (IMF) for nearby star-forming regions as derived with the models of Baraffe et al. (1998) and Chabrier et al. (2000) to the relatively accurate and well-calibrated IMF of the solar neighborhood under the assumption that the true IMFs of these populations are the same (§ 3).
2. AB Dor C
2.1. Photometry
Given the large flux ratio and small angular separation of AB Dor A and C, a robust photometric measurement of the latter with AO images requires careful consideration of the possible errors inherent to data of this kind. For these reasons, we have analyzed the data published in C05, which are now available to the public at the data archive of the European Southern Observatory (ESO).
2.1.1 SDI Images
The data with which C05 reported the first direct detection of AB Dor C were obtained during the commissioning of the simultaneous differential imaging mode (SDI, Lenzen et al., 2004; Biller et al., 2004) of the High-resolution Near-IR Camera (CONICA, Lenzen et al., 1998), which was used in conjunction with the Nasmyth Adaptive Optics System (NAOS, Rousset et al., 2000) on ESO’s Very Large Telescope (VLT). The SDI technique, first illustrated by Racine et al. (1999) and further developed by Marois et al. (2000, 2003, 2005), uses the relative spectral contrast between a primary and a companion to suppress the contrast-limiting speckle noise. It has been shown that significant improvements in speckle suppression are gained through the SDI technique. However, non-common path errors, differential chromatic aberrations, alignment-sensitive ghost images, flat-field miscalibration, and detector read noise can significantly exceed the photon noise. Although these data are not directly relevant to testing the theoretical evolutionary models, we examine them in this section because of the importance of testing the abilities of new observational techniques like SDI.
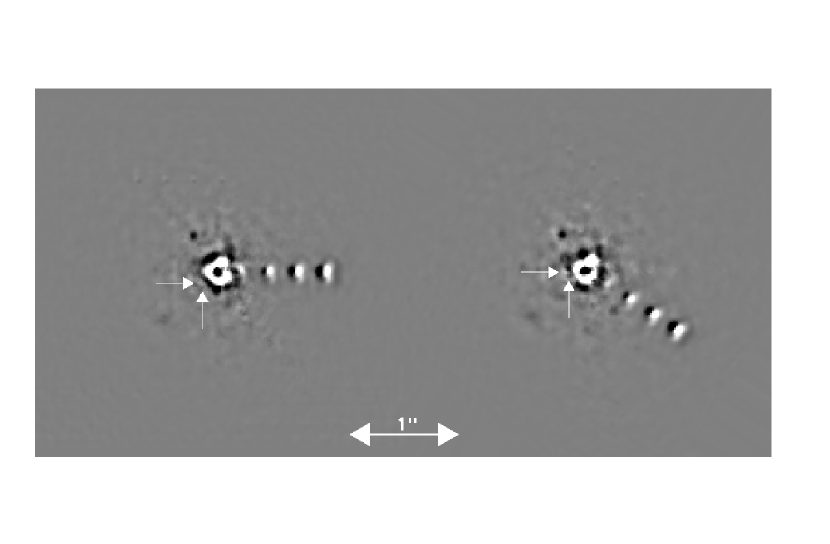
The SDI observations from C05 were obtained on the night of 2004 February 1 and consisted of a set of images at five dither positions followed by a second set of dithered images with the instrument rotator offset by . At a given position, four SDI images were obtained through narrow-band filters, one at 1.575 µm, one at 1.600 µm, and two at 1.625 µm. After removing bad pixels and dividing by flat field images, we created images that were spatially scaled by the ratio of central filter wavelengths to make the diffraction and speckle pattern for all images coincident in image coordinates. The images were optimally aligned to subpixel accuracies using the flux conserving interpolation routine interpolate within IDL. After the subpixel alignment, the individual images were optimally flux scaled to minimize the residual counts in the non-saturated regions of the PSF halo in the subtracted image. The images were then spatially filtered as in Masciadri et al. (2005). The six different non-redundant subtraction combinations possible between the four images were created using these optimal subtraction routines for each of the 10 dither positions. Because the plate scale is independent of the wavelength in the SDI mode of CONICA, when the images are spatially de-magnified to match the diffraction pattern of the PSFs with different wavelengths, the positions of a companion in different filters becomes radially misaligned to a degree proportional to the demagnification factor and the distance from the center of the primary PSF. As a result, the signature of a real (non-methane) companion using the SDI technique is not just a fainter version of the primary PSF but rather a subtraction between two radially misaligned PSFs, as illustrated in Figure 1. This effect essentially improves the sensitivity to the detection of companions by producing a more unique and detectable signal even when the companion has no intrinsic spectral contrast between the narrow-band filters.
At the position of AB Dor C reported by C05, we find a point source appearing in all four of the unsubtracted images of the SDI data at a signal-to-noise of . However, this feature overlaps with the diffraction spider arm, making the differential imaging crucial in confirming it is as a real companion with these data alone. Indeed, after the optimal alignment and subtraction routine was performed through the dataset, we found no obvious signature of a companion at this location in any iteration of the optimally subtracted images. Although not done by C05, we performed an additional step to remove possible fixed noise from the reduced differential images by subtracting the reduced data sets taken at the different instrument rotator angles. This would produce a negative version of the companion’s signal at the same radius as the companion, but separated in position angle equal to the instrument rotator angle change (33). From this analysis, we again found no obvious signature of a companion. A similar type of reduction was performed by Nielsen et al. (2005), resulting in the images in the first panel of their Figure 4. In contrast to their claims, we see no significant detection of a companion in those data. To quantify the detection limits, a noise analysis was performed using the five dithered images for each rotation angle for each of the six subtraction combinations. Because the central five pixels surrounding AB Dor A were saturated, a PSF for use with artificial companions could not be measured from these data. However, prior to that sequence of images, C05 obtained a single short exposure in which AB Dor A was not saturated. We adopt this PSF of AB Dor A for artificial companions in the following analysis. This use of a PSF from a short exposure tends to overestimate the Strehl ratio of the longer exposure, which results in a detection limit that is overly optimistic. Based on the spectra of late-M objects at a variety of ages (e.g., Cushing et al., 2005), the maximum flux ratio expected for AB Dor C between the 1.625 and 1.575 µm narrow-band filters is . Therefore, we simulated AB Dor C with an artificial companion that was 125 and 112 times fainter than AB Dor A for the images at 1.625 and 1.575 µm, respectively.
By combining the signal from the artificial companion with the standard deviation of the total flux in bins of linear size similar to the diffraction limit ( pixels) around a ring at the radius of AB Dor C reported by C05 ( pixels), we arrived at an expected signal-to-noise ratio of 1.2 for AB Dor C. We checked the validity of this measurement by inserting the artificial companion into the raw data at the separation of 016 reported by C05, repeating the reduction procedures, and visually inspecting the resulting images. For comparison, we also included companions at larger separations of 04, 064, and 088. The differenced SDI images containing these companions are shown in Figure 1. Although a companion of this contrast would easily be detected at separations beyond , it is not reliably detected at the radius of reported by C05 for AB Dor C. Thus, we cannot reproduce the putative detection of a companion shown in Figure 1b from C05. Their image also does not exhibit the expected plus/minus asymmetry expected for SDI data of this kind. Nor is that source evident in the difference between two instrument rotator angles in the first panel of Figure 4 from Nielsen et al. (2005). However, Nielsen et al. (2005) does show a significant detection of AB Dor C in newer SDI data obtained after C05 when the companion had moved to a larger separation, which is consistent with the detection limits that we have measured.
2.1.2 Broad-band Images
In addition to the SDI data, C05 obtained near-IR broad-band images of AB Dor with CONICA and NAOS (NACO). For AB Dor C, C05 reported two errors of +0.19 and -0.24 at , +0.13 and -0.15 at , +0.12 and -0.15 at . These errors correspond to signal-to-noise ratios of 10, 16, and 11 in the three bands, respectively, which are substantially better than achieved in previous companion searches with NACO (Biller et al., 2004; Masciadri et al., 2005). To investigate this apparent discrepancy, in this section we present a detailed, explicit analysis of the photometric errors for AB Dor C in the data obtained by C05, including the possible systematic errors inherent to high contrast photometric measurements with AO observations. We also consider the unpublished images in a narrow-band filter at 3.74 µm that were obtained of AB Dor with NACO.
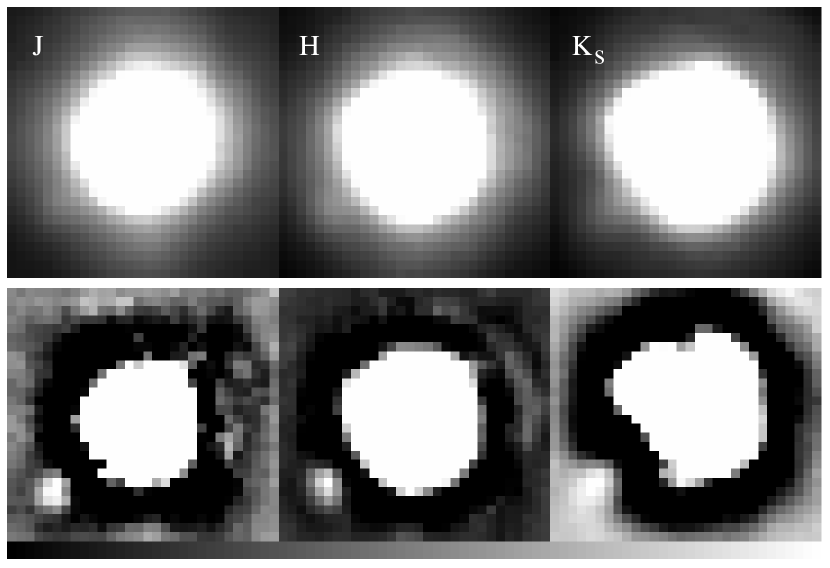
On the night of 2004 February 4, C05 obtained 15 images with exposure times of 10 s among 5 dither positions for each of the , , and filters and three images with exposure times of 3.45 s (10 coadds of 0.345 sec). A similar set of exposures was obtained through the NB3.74 filter, but with exposure times of 3.6 s (10 coadds of 0.36 sec). After flat fielding, dark subtraction, and removal of bad pixels, we constructed a sky frame in a given filter from a median combination of unaligned images and subtracted it from each image in that filter. We aligned the resulting images to subpixel accuracy using the same IDL interpolation routine as in the SDI data reduction. In the long exposures, pixels within a radius of from AB Dor A were saturated. These images were aligned using the unsaturated wings of AB Dor A. We also generated a set of images that were spatially filtered by subtracting from each image the same image convolved with a Gaussian with a width roughly equal to the FWHM for each wavelength (Masciadri et al., 2005). In the resulting images, the low frequency PSF variations are suppressed. The final nonfiltered and filtered images for , , and are shown in Figure 2.
The companion AB Dor C is apparent in the individual reduced 10 s images at , , and , but not NB3.74. A detection at NB3.74 is not expected given the total exposure time in that filter. Although other fixed speckles and diffraction artifacts are present in the halo of AB Dor A at comparable brightness, AB Dor C is the only ”speckle” that remains at a constant position in the , , and images. If it were a fixed diffraction speckle, the separation would be proportional to the central wavelength of the filter. The fact that it is in the same position in the three broad-band filters as well as the unsubtracted SDI images and is in all the different dither positions demonstrates the reality of the companion.
To measure photometry for AB Dor C from the , , and images, we used the shorter, unsaturated exposures of AB Dor A to construct a PSF for each filter and calibrated it with photometry of AB Dor A from 2MASS. We confirmed the accuracy of this calibration by extracting photometry for AB Dor Ba+Bb, which appeared in some of the long exposures, and comparing it to the 2MASS measurements. In each filter, the calibrated PSF was scaled and subtracted from the image at the position of AB Dor C with a scale factor optimized such that the residual at the location of AB Dor C matched the light level of the adjoining regions. The errors in these photometric measurements were computed from the standard deviation of the brightness at the position of AB Dor C in an area with a width equal to the PSF’s FWHM through the 15 images. In addition, we calculated the standard deviation of flux in FWHM-sized bins at all position angles at a constant radius from AB Dor A as done in the contrast sensitivity estimations of Masciadri et al. (2005). This analysis resulted in errors slightly larger than those calculated from the variance through a data set at the position of AB Dor C; specifically, the errors are 12%, 17%, and 7% larger using the method from Masciadri et al. (2005) for the , and bands, respectively. This is likely due to the fact that the diffraction spikes from the secondary support create intrinsic variability around the PSF halo at a constant radius. For this reason, we use the lower error values calculated as the standard deviation of the flux through the data set at the position of AB Dor C. The photometry and errors produced by this analysis are presented in Table 1. We also list the measurements from C05 for comparison. The photometric errors for AB Dor C that we derive from C05’s images are significantly larger than those reported by C05. In comparison, the nonfiltered NACO data from Masciadri et al. (2005) exhibited an average sensitivity of 5 at and , which corresponds to for an object at the contrast of AB Dor C and thus is consistent with the photometric errors we measure from the nonfiltered images. Note that although the sensitivities from Masciadri et al. (2005) for filtered images are better than those from the nonfiltered data, they represent only the significance of a detection rather than bona fide photometric errors because they do not include the systematic errors introduced by the filtering process.
In addition to the photometric errors listed in Table 1, the noise associated with the variability of the reference PSF must also be taken into consideration. The reference PSFs are from the short exposures of AB Dor A (0.345 s 10 coadds 3), which were measured at a different time than the longer exposures that detected AB Dor C (10 s 1 coadd 15). Because the total exposure time among the short exposures in a given band was comparable to just one long exposure, we cannot directly measure the temporal variability of the PSFs used in the photometric analysis. However, the NB3.74 data, which were obtained on the same night as the long exposures, encompassed a longer time baseline. These data consisted of a continuous series of 15 frames of 0.36 s 10 coadds. The combination of three consecutive images within this series has a similar total clock time as one long exposure. Therefore, from the series of 15 images we were able to construct 5 independent unsaturated PSFs that were measured on the same timescale as the long exposures. The variability of the NB3.74 PSF can then be translated into variabilities at other wavelengths using a relation between the Strehl ratio (), the RMS wavefront error (), and the observing wavelength : . Defining the fractional error in the Strehl ratio to be , the fractional error relationship between two wavelengths then can be arrived at through algebraic manipulation: . The standard deviation of the Strehl ratio of the 5 NB3.74 images was measured to be . To match the aperture used in the photometric analysis, we estimated the changes in the Strehl ratio using the total counts within the FWHM core of the PSF. The , , and fractional Strehl ratio errors are found to be 1.286, 1.155, and 1.087 respectively. These errors were propagated with those found from the halo noise at the radius of AB Dor C and are presented in Table 1.
2.2. Spectral Type
C05 used the spectroscopic mode of NACO to obtain near-IR spectra of AB Dor C on the night of 2005 February 4. The NACO system was configured to provide a slit width of , a spectral coverage of 2-2.5 µm, and a resolution of . Eight dithered one-minute exposures were obtained with the slit aligned along AB Dor and the position of AB Dor C measured by C05, and another set of eight exposures were taken with the slit rotated by . The primary was saturated in these data. C05 and Nielsen et al. (2005) described some of the details of their processing of these data.
We have retrieved the NACO spectroscopic data for AB Dor C from the ESO archive and have performed an independent analysis, which we now describe. After dividing by flat field images, we straightened the images to precisely align the dispersion and spatial directions with the image coordinate axes. To detect AB Dor C within the wing of the PSF of AB Dor, we differenced spectral images at opposite instrument rotator angles. To account for changes in the PSF, prior to this differencing we measured the fluxes as a function of wavelength between radii of 8.5 and 12.5 pixels on the left and right sides of AB Dor for each of the eight images at each of the two rotator angles, which we refer to as where left or right, -8, and or 180 (degrees). We then computed and for all combinations of and . These ratios measured the change in the PSF on each side of AB Dor between a given pair of exposures. To achieve a reliable PSF subtraction, the PSF change should be the same on each side of AB Dor. Therefore, we considered only pair subtractions in which was approximately constant with wavelength. For each of these retained pairs, we fit a function to that was linear with wavelength, multiplied the exposure at the second rotator angle () by this fit, and subtracted the resulting image from the image at the first angle (). This process produced 9 good detections of AB Dor C out of the 16 that were possible. We extracted these 9 spectra, combined them, and divided by the spectrum of a telluric standard star, HD 34286 (G3V). The resulting spectrum was multiplied by the solar spectrum to correct for the spectral slope and absorption features of this standard. Because the 9 individual spectra of AB Dor C exhibited significant differences in their spectral slopes, the slope of the combined spectrum probably was not accurate. We removed the slope of the spectrum by dividing by a polynomial fit to the continuum. The final spectrum of AB Dor C is shown in Figure 3.
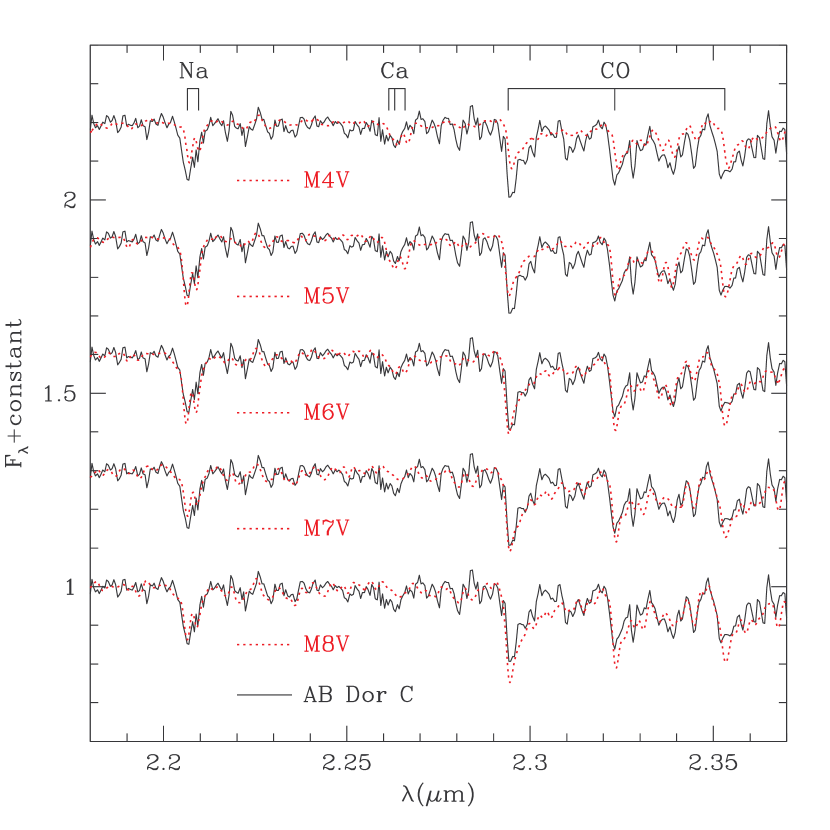
For the spectral classification of AB Dor C, we use the dwarf standards obtained with SpeX at the NASA Infrared Telescope Facility by Cushing et al. (2005). The resolution of the SpeX data is , which is higher than that of the NACO spectrum of AB Dor C (). To enable a reliable comparison of the spectral features in these spectra, we smoothed the SpeX data to the same resolution as the NACO data. To do this, we compared the Ar lamp spectra obtained with the SpeX and NACO spectra and identified a Gaussian function convolution for the SpeX data that produced the same FWHMs as in the NACO spectra. We then applied this Gaussian function to the spectra of the M dwarfs from Cushing et al. (2005). The resulting SpeX data of Gl 213 (M4V), Gl 51 (M5V), Gl 406 (M6V), vB 8 (M7V), and vB 10 (M8V) are plotted with the NACO spectrum of AB Dor C in Figure 3. The slopes of these standard spectra have been removed in the same manner as for AB Dor C.
We now measure the spectral type of AB Dor C by comparing the strengths of the Na I doublet, Ca I triplet, and CO band heads in its spectrum to those exhibited by the dwarf standards in Figure 3. The Na I absorption in AB Dor C is weaker than that of M5V and M6V and stronger than that of M4V, M7V, and M8V. Because this doublet is weaker in pre-main-sequence objects than in dwarfs (Luhman et al., 1998a), the strength observed for AB Dor C is consistent with types of M5-M6, but not M4, M7, or M8. In terms of both Ca I and CO, AB Dor C is best matched by M6V. Compared to M4V and M5V, the lower surface gravity of AB Dor C could explain its stronger CO, but not the weaker Ca I (Luhman & Rieke, 1998). Meanwhile, the opposite is true for M7V and M8V. In particular, CO is significantly weaker in AB Dor C than in M8V, and the inconsistency is even larger when the gravity differences are considered. Taken together, the strengths of Na I, Ca I, and CO indicate a spectral type of M6 for AB Dor C.
Based on the spectrum of AB Dor C that they measured from the NACO data, C05 and Nielsen et al. (2005) derived a spectral type of M8 for AB Dor C. We comment on a few aspects of their classification. In agreement with our results in Figure 3, C05 found that AB Dor C exhibited stronger Na I than vB 10 (M8V). However, they attributed this difference to the lower surface gravity of AB Dor C, even though Na I transitions in general (Martín et al., 1996; Luhman, 1999; Gorlova et al., 2003; McGovern et al., 2004) and this -band doublet specifically (Luhman et al., 1998a) are known to become weaker, not stronger, with decreasing surface gravity. The stronger Na I absorption in the spectrum from C05 relative to M8V can only be explained by a spectral type that is earlier than M8V since the strength of this feature reaches a maximum at M6V and decreases with later types (Luhman & Rieke, 1998; Cushing et al., 2005). In addition to dwarfs, Nielsen et al. (2005) used young objects in Upper Scorpius as standards. Compared to a spectrum of a M7 member of that association (Gorlova et al., 2003), AB Dor C exhibited stronger Na I and CO, which Nielsen et al. (2005) cited as evidence for a spectral type later than M7. However, as already noted, stronger Na I would imply a type earlier than M7, not later. Meanwhile, the difference in CO is likely due to the fact that the spectral resolution of the data for Upper Scorpius from Gorlova et al. (2003) was much lower than the resolution for AB Dor C.
C05 also found good agreement between the broad spectral shapes (i.e., steam absorption) of their spectrum of AB Dor C and a spectrum of vB 10 from Wilking et al. (1999), which seemed to support an M8 classification for the former. However, the validity of this comparison is questionable for the following reasons. First, C05 corrected for telluric absorption in their data by dividing by the spectrum of a solar-type star. They multiplied this result by the solar spectrum to remove the spectral slope and absorption features intrinsic to the telluric standard. In comparison, Wilking et al. (1999) also divided their spectrum of vB 10 by a telluric standard (an A0 star), but did not attempt to remove the intrinsic spectrum of that standard. Thus, the procedures of C05 and Wilking et al. (1999) should produce spectral slopes that differ systematically, which would preclude a meaningful comparison of the steam bands in the resulting spectra of AB Dor C and vB 10. In addition, Nielsen et al. (2005) stated that they (and presumably C05) were unable to “preserve the continuum” of AB Dor C during their data reduction, which also would obviate the use of steam in the spectral classification.
It is useful to consider the spectral type of AB Dor C in the context of the low-mass Pleiades members PPL15 A and B, which have well-constrained masses and spectral types and have similar ages as AB Dor C. According to the spectral type of M8 reported by C05, AB Dor C should be cooler than PPL15 A and B (M6 and M7; Basri & Martín, 1999). However, the dynamical mass of AB Dor C ( , C05) is equal to or greater than the masses of PPL15 A and B, each of which have a firm upper mass limit of 0.1 based on the presence of Li (Basri, Marcy, & Graham, 1996; Basri & Martín, 1999)111This mass limit is based on theoretical relationships between Li abundance, mass, and age, which have been shown to be robust (Bildsten et al., 1997; Burke, Pinsonneault, & Sills, 2004). and are probably brown dwarfs based on their binary data (Basri & Martín, 1999). Thus, these relative spectral types and masses of AB Dor C and PPL15 are incompatible. Meanwhile, the spectral type of M61 that we measure for AB Dor C is perfectly consistent with PPL 15.
2.3. Age
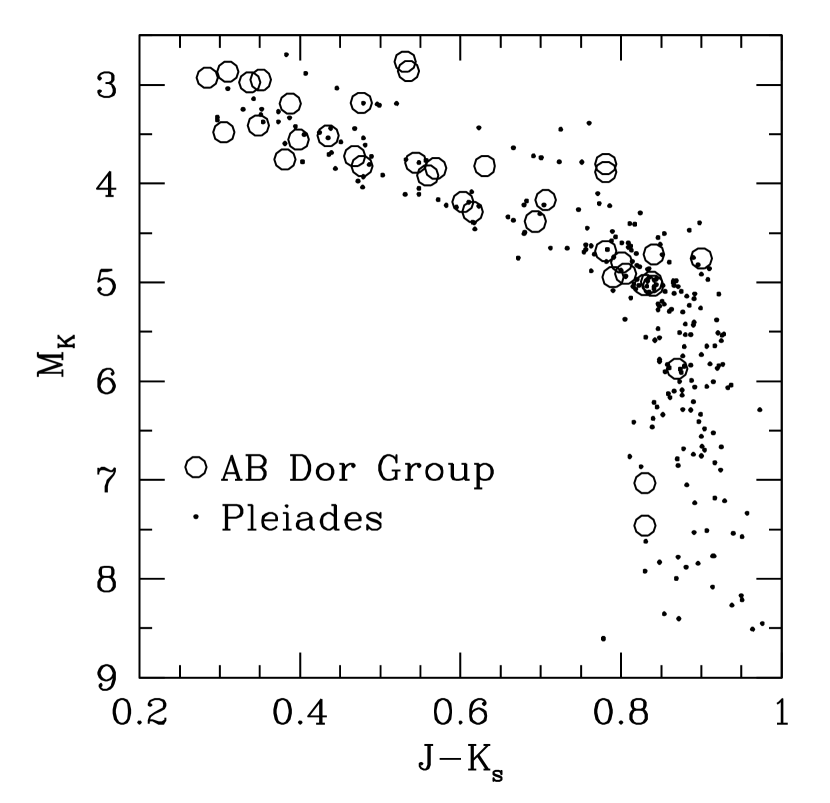
Luhman, Stauffer, & Mamajek (2005) recently derived an age for AB Dor from a color-magnitude diagram and the kinematics of the AB Dor moving group. In a diagram of versus , they found that the AB Dor group and the Pleiades were approximately coeval (-125 Myr, Meynet et al., 1993; Stauffer et al., 1998). This result was supported by the kinematic analysis, which suggested that the two populations originated in the same large scale star-formation event. Nielsen et al. (2005) briefly addressed the age of AB Dor and the results of Luhman, Stauffer, & Mamajek (2005). First, they quoted Luhman, Stauffer, & Mamajek (2005) as finding that the AB Dor group is brighter by 0.1 mag than the Pleiades in versus . However, that was not the case. Instead, Luhman, Stauffer, & Mamajek (2005) reported an offset of 0-0.1 mag in a visual comparison of the histograms of the offsets between the observed positions of stars in each population and a fit to the lower envelope of the Pleiades sequence. In a more quantitative and definitive comparison, Luhman, Stauffer, & Mamajek (2005) found that the mean offsets of the two populations were indistinguishable, indicating no detectable age difference. Nielsen et al. (2005) then presented a comparison of the Pleiades and the AB Dor group sequences in versus and claimed to find an offset of 0.15 mag in between the sequences at . However, a diagram of that kind is a poor choice for measuring ages and comparing sequences because the dynamic range of is very small, nearly an order of magnitude lower than that of . In fact, the sequences of stellar populations are vertical in versus for low-mass stars later than K7, as illustrated in Figure 4. As a result, the stars that are normally most valuable for measuring ages because of their large displacements above the main sequence are made useless by plotting them in versus . Finally, even if the AB Dor group and the Pleiades are compared in versus , as we have done in Figure 4, their sequences are still very similar. Following the procedure used for versus by Luhman, Stauffer, & Mamajek (2005), we compared the mean offsets of the stars in the AB Dor group and the Pleiades from the lower envelope of the Pleiades. The difference between these mean offsets ranges between -0.05 and 0.05 depending on the exact range of colors that is considered. Thus, the mean offsets for the AB Dor group and the Pleiades are indistinguishable in versus , in agreement with the results from versus , and we find no basis in the work of Nielsen et al. (2005) for modifying the age estimate of AB Dor from Luhman, Stauffer, & Mamajek (2005).
2.4. Comparison to Model Predictions
We now estimate the bolometric luminosity and effective temperature of AB Dor C from our broad-band photometry and spectral classification and compare them to the values predicted by the evolutionary models of Chabrier et al. (2000).
We have computed the luminosity by combining our corrected magnitude in Table 1, the distance of AB Dor (Perryman et al., 1997), the -band bolometric correction of M6 field dwarfs (BC, Tinney et al., 1993; Dahn et al., 2002), and an absolute bolometric magnitude of 4.75 for the Sun, arriving at . Because the and colors of AB Dor C are consistent with those of M6 field dwarfs, a luminosity derived from or produces a similar result. In Figure 5, we compare our measurements of , , , and for AB Dor C to the values predicted by the theoretical evolutionary models of Chabrier et al. (2000). For AB Dor C, we adopt an age of 75-150 Myr (Luhman, Stauffer, & Mamajek, 2005). Using this age, the luminosity measured by C05 agrees well with the model predictions, as shown by Luhman, Stauffer, & Mamajek (2005), while the agreement is slightly worse using our new (smaller) luminosity estimate. However, the predicted luminosities are still well within the one uncertainties of our measurement. Similarly, each of the near-IR magnitudes that we measured for AB Dor C is consistent with the model values within the (large) photometric uncertainties. It is likely that deficiencies do exist at smaller levels in the predicted parameters, particularly the IR magnitudes (e.g., Chabrier et al., 2000; Leggett et al., 2001).
To compare our spectral classification of AB Dor C to the model predictions, we must adopt a conversion of spectral types to temperatures. Using the dwarf temperature scale from Luhman (1999), which was a fit to data from Leggett et al. (1996), the spectral type of M6 for AB Dor C corresponds to K. This estimate does not include the uncertainty in the M dwarf temperature scale, which is non-negligible. An additional uncertainty is present for AB Dor C because a dwarf scale, even if perfectly determined, may not apply to young objects (Luhman, 1999). Nevertheless, even with underestimated errors, it is useful to compare our temperature estimate for AB Dor C to the model predictions. As shown in Figure 6, our spectral classification of AB Dor C is consistent with the temperatures predicted by the models of Chabrier et al. (2000) when the dwarf scale from Luhman (1999) is adopted.
3. Initial Mass Functions of Star Forming Clusters and the Solar Neighborhood
The results of tests of evolutionary models at ages of Myr like the one supplied by AB Dor C do not necessarily extend to much younger ages. The uncertainties in the evolutionary calculations become larger at younger ages, and thus it would not be surprising if the models were robust for relatively evolved objects like AB Dor C that are approaching the main sequence but had significant errors at ages of a few million years (Baraffe et al., 2002). Model tests that apply directly to the youngest ages are needed. In this section, we present such a test of the masses estimated with the evolutionary models of Baraffe et al. (1998) and Chabrier et al. (2000) for low-mass stars and brown dwarfs in star-forming regions.
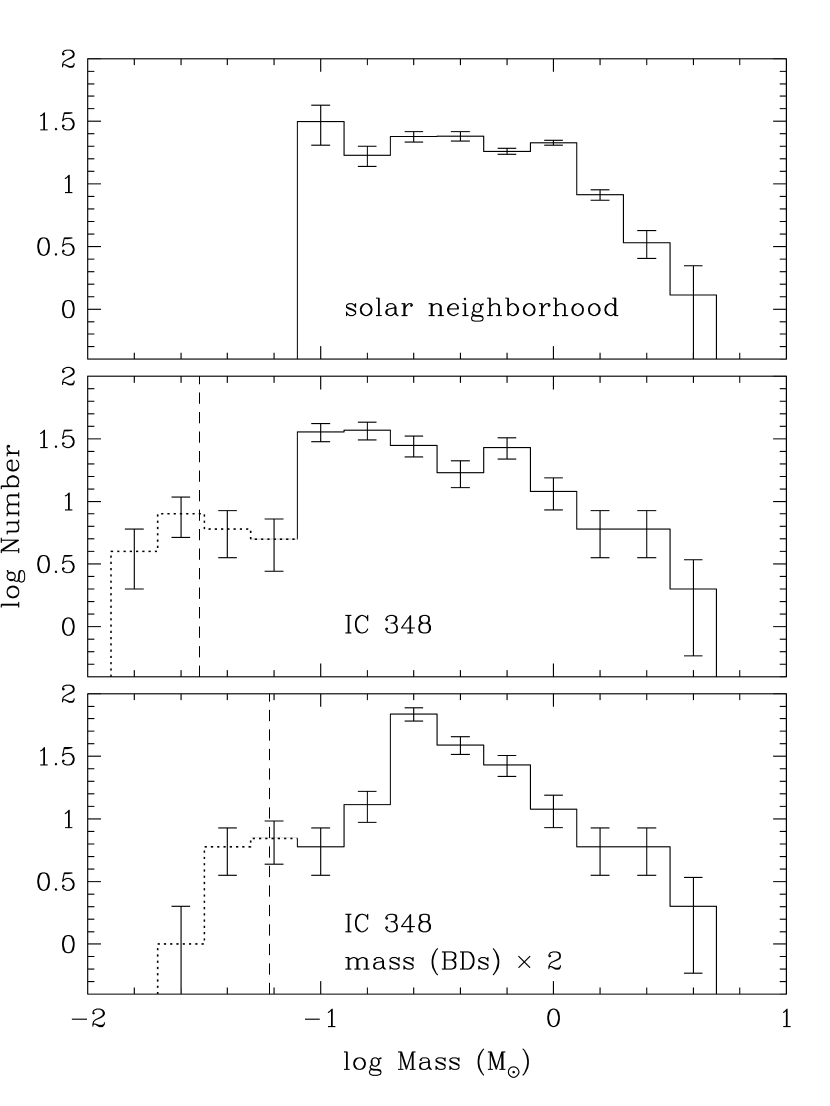
The Galactic disk appears to be populated predominantly by stars born in embedded clusters rather than in isolation (Lada & Lada, 2003, references therein). Therefore, unless the IMFs of embedded clusters have changed significantly during the lifetime of the Galaxy, the current generation of clusters should have the same average IMF as the solar neighborhood. Among the best-studied star-forming clusters, the IMFs of stars and brown dwarfs inferred from a given set of evolutionary models exhibit relatively little variation (Luhman et al., 2000). In logarithmic units where the Salpeter slope is 1.35, the IMFs in most of these clusters rise from high masses down to a solar mass, rise more slowly down to a maximum at 0.1-0.2 , and then decline into the substellar regime, as in the Orion Nebula Cluster ( Myr, Hillenbrand, 1997; Luhman et al., 2000; Hillenbrand & Carpenter, 2000; Muench et al., 2002) and IC 348 ( Myr Herbig, 1998; Luhman et al., 1998b, 2003; Muench et al., 2003). The only clear exception is the IMF in the Taurus star-forming region ( Myr), which peaks near 0.8 (Briceño et al., 2002; Luhman, 2004), but quiescent, low-density regions like Taurus produce an insignificant number of stars compared to the giant molecular clouds that contain most embedded clusters (Lada & Lada, 2003). Therefore, we can compare the model-derived IMFs of star-forming clusters to the IMF of the solar neighborhood to check the accuracy of mass estimates for young low-mass stars and brown dwarfs.
To represent the IMF of a typical embedded cluster, we select the IMF of IC 348 from Luhman et al. (2003), which was derived with an H-R diagram of the cluster, the evolutionary models of Baraffe et al. (1998) and Chabrier et al. (2000), and the temperature scale described in Luhman et al. (2003). That IMF consists of primaries plus companions at projected separations greater than 300 AU, and thus more closely resembles an IMF of primaries rather than a single star mass function. For the IMF of stars in the solar neighborhood, we adopt the measurement by Reid et al. (2002) with a modification to exclude companions with projected separations less than 300 AU, making it suitable for comparison to IC 348. Similar measurements of the IMF of field stars have been presented by Kroupa (2001) and Chabrier (2001, 2003). Because the mass-luminosity relation is a function of age for brown dwarfs at any age, and the ages of individual field brown dwarfs are unknown, a unique, well-sampled IMF of field brown dwarfs cannot be constructed. Therefore, we compare only the IMFs of low-mass stars between the solar neighborhood and IC 348. The available constraints on the substellar IMF for the field (Reid et al., 1999; Chabrier, 2002; Allen et al., 2005) have been compared to measurements in star-forming regions in previous work (Luhman, 2004).
The IMFs for the solar neighborhood and the IC 348 star-forming cluster are compared in Figure 7. These IMFs are rather similar; both are roughly consistent with a Salpeter slope above a solar mass and are slightly rising from a solar mass to 0.1 . Previous comparisons of the mass functions of young clusters and the solar neighborhood have arrived at the same conclusion (e.g., Chabrier, 2003). This agreement supports the validity of the masses we have inferred from the models of Baraffe et al. (1998) and Chabrier et al. (2000) for young low-mass objects. Meanwhile, C05 concluded that the masses of young low-mass members of clusters have been underestimated by a factor of two with the evolutionary models of Chabrier et al. (2000). To investigate this possibility, we have modified the IMF for IC 348 by doubling the mass estimates below 0.08 . Because our adopted temperature scale and evolutionary models produce accurate masses at (Luhman et al., 2003), the factor by which the original masses are multiplied is selected to decrease linearly with log M from two at 0.08 to unity at 0.5 . As shown in Figure 7, the resulting IMF differs significantly from the IMF of the solar neighborhood. Most notably, the relative numbers of stars at 0.25 and 0.1 differ by an order of magnitude between the two IMFs. This exercise demonstrates that the masses derived for the low-mass members of IC 348 cannot be underestimated by a factor of two if the IMF of Galactic star-forming clusters and the solar neighborhood are similar. An alternative illustration of this result is the following. Our use of the evolutionary models indicates that young objects with optical spectral types of M7 and later are brown dwarfs. Objects at these spectral types are relatively rare in star-forming regions (Briceño et al., 2002; Luhman et al., 2003; Luhman, 2004). In comparison, stars at masses of 0.1-0.2 are the most abundant stars in the field. Therefore, members of star-forming regions at types of M7 and later cannot be low-mass stars unless the IMFs of those regions and the solar neighborhood are radically different.
We have applied the above test only to the specific methods and models used in estimating masses by Luhman et al. (2003). The results of this test do not apply to the synthetic near-IR magnitudes, other sets of evolutionary models, or other temperature scales.
4. Discussion
C05 found that the evolutionary models of Chabrier et al. (2000) overestimated the and -band brightnesses of AB Dor C by one magnitude and concluded that “the young, cool objects hitherto thought to be substellar in mass are therefore about twice as massive, which means that the frequency of brown dwarfs and planetary mass objects in young stellar clusters has been overestimated” and that “such errors will require serious revision of the frequency for the lowest-mass objects…at young ages”. We find that this conclusion is oversimplified and unwarranted. First, the error factor in the mass estimates for young low-mass objects is a strong function of the stellar parameters considered, the choice of evolutionary models, and other considerations, such as the adopted conversion between spectral types and temperatures. For instance, even in the analysis of C05, the apparent error factor varied from 2 for and to only 1.3 for . The conclusions of C05 included implications for measurements of substellar IMFs in star-forming regions, but they did not actually test the methods predominantly used to derive masses in those surveys. Instead, they considered mass estimates based on the synthetic near-IR magnitudes, whereas bolometric luminosity is the most common parameter used in deriving masses for low-mass IMFs. In fact, within the age and luminosity uncertainties quoted by C05, the models of Chabrier et al. (2000) are formally consistent with the observations of AB Dor C, and so their sweeping conclusions regarding the validity of the models and of the measurements of substellar mass functions were not justified by their own data. Meanwhile, the new estimate of the age for AB Dor C from Luhman, Stauffer, & Mamajek (2005) indicates reasonable agreement between its predicted luminosity and the values measured by C05 and in this work (§ 2.4). In addition to the synthetic near-IR magnitudes, C05 compared the effective temperature predicted for AB Dor C to the spectral type of M8 that they measured from IR spectroscopy, and concluded that the models overestimated its temperature. However, we measure an earlier spectral type of M6 for AB Dor C from C05’s spectroscopic data, which is in agreement with the model predictions if a dwarf temperature scale is adopted. Purely on an observational basis, a spectral type earlier than the one reported by C05 is expected given that AB Dor C has a mass greater than or equal to that of PPL 15 A and B (M6 and M7).
We have also presented a simple test of the general possibility that the masses of young low-mass stars and brown dwarfs, particularly in star-forming regions ( Myr), have been significantly underestimated in previous studies using the models of Chabrier et al. (2000). This test consisted of a comparison of the model-derived IMFs of star-forming regions and the IMF of the solar neighborhood. The agreement between these IMFs supports the accuracy of the masses for young low-mass objects when they are derived by combining measurements of spectral types and luminosities with the models of Baraffe et al. (1998) and Chabrier et al. (2000) and the temperature scale of Luhman et al. (2003). These mass estimates cannot have very large systematic errors () unless the IMF produced by the current generation of star formation in the Galactic disk is significantly different from the IMF of the solar neighborhood. However, this test does not exclude smaller systematic errors. Indeed, for the primary in a young spectroscopic binary in Upper Scorpius, Reiners et al. (2005) recently measured a dynamical mass of , which is higher than the value of 0.2-0.3 derived with the same methods and models used in the above IMF measurements. A more definitive test of those methods and models would be possible with a verification of the spectral type of that binary, as noted by Reiners et al. (2005). Dynamical masses at lower masses are also needed because the systematic errors could depend on mass (Mohanty et al., 2004; Reiners et al., 2005).
References
- Allen et al. (2005) Allen, P. R., Koerner, D. W., & Reid, I. N. 2005, ApJ, 625, 385
- Baraffe et al. (1998) Baraffe, I., Chabrier, G., Allard, F., & Hauschildt, P. H. 1998, A&A, 337, 403
- Baraffe et al. (2002) Baraffe, I., Chabrier, G., Allard, F., & Hauschildt, P. H. 2002, A&A, 382, 563
- Basri, Marcy, & Graham (1996) Basri, G., Marcy, G. W., & Graham, J. R. 1996, ApJ, 458, 600
- Basri & Martín (1999) Basri, G., Martín, E. L. 1999, AJ, 118, 2460
- Bildsten et al. (1997) Bildsten, L., Brown, E. F., Matzner, C. D., & Ushomirsky, G. 1997, ApJ, 482, 442
- Biller et al. (2004) Biller, B., Close, L., Lenzen, R., Brandner, W., McCarthy, D. W., Nielsen, E., & Hartung, M. 2004, Proceedings of the SPIE, 5490, 389
- Briceño et al. (2002) Briceño, C., Luhman, K. L., Hartmann, L., Stauffer, J. R., & Kirkpatrick, J. D. 2002, ApJ, 580, 317
- Burke, Pinsonneault, & Sills (2004) Burke, C. J., Pinsonneault, M. H., & Sills, A. 2004, ApJ, 604, 272
- Chabrier (2001) Chabrier, G. 2001, ApJ, 554, 1274
- Chabrier (2002) Chabrier, G. 2002, ApJ, 567, 304
- Chabrier (2003) Chabrier, G. 2003, PASP, 115, 763
- Chabrier et al. (2000) Chabrier, G., Baraffe, I. Allard, F., & Hauschildt, P. H. 2000, ApJ, 542, 464
- Close et al. (2005) Close, L. M., et al. 2005, Nature, 433, 286
- Cushing et al. (2005) Cushing, M. C., Rayner, J. T., & Vacca, W. D. 2005, ApJ, 623, 1115
- Dahn et al. (2002) Dahn, C. C., et al. 2002, AJ, 124, 1170
- Gorlova et al. (2003) Gorlova, N. I., Meyer, M. R., Rieke, G. H., & Liebert, J. 2003, ApJ, 593, 1074
- Guirado et al. (1997) Guirado, J. C., et al. 1997, ApJ, 490, 835
- Herbig (1998) Herbig, G. H. 1998, ApJ, 497, 736
- Hillenbrand (1997) Hillenbrand, L. A. 1997, AJ, 113, 1733
- Hillenbrand & Carpenter (2000) Hillenbrand, L. A., & Carpenter, J. M. 2000, ApJ, 540, 236
- Hillenbrand & White (2004) Hillenbrand, L. A., & White, R. J. 2004, ApJ, 604, 741
- Kroupa (2001) Kroupa, P. 2001, MNRAS, 322, 231
- Lada & Lada (2003) Lada, C. J., & Lada, E., A. 2003, ARA&A, 41, 57
- Leggett et al. (1996) Leggett, S. K., Allard, F., Berriman, G., Dahn, C. C., & Hauschildt, P. H. 1996, ApJS, 104, 117
- Leggett et al. (2001) Leggett, S. K., Allard, F., Geballe, T. R., Hauschildt, P. H., & Schweitzer, A. 2001, ApJ, 548, 908
- Lenzen et al. (1998) Lenzen, R., et al. 1998, Proceedings of the SPIE, 3354, 606
- Lenzen et al. (2004) Lenzen, R., Close, L., Brandner, W., Biller, B., & Hartung, M. 2004, Proceedings of the SPIE, 5492, 970
- Luhman (1999) Luhman, K. L. 1999, ApJ, 525, 466
- Luhman (2004) Luhman, K. L. 2004, ApJ, 617, 1216
- Luhman et al. (2000) Luhman, K. L., et al. 2000, ApJ, 540, 1016
- Luhman et al. (1998a) Luhman, K. L., Briceño, C., Rieke, G. H., & Hartmann, L. 1998a, ApJ, 493, 909
- Luhman & Rieke (1998) Luhman, K. L., & Rieke, G. H. 1998, ApJ, 497, 354
- Luhman et al. (1998b) Luhman, K. L., Rieke, G. H., Lada, C. J., & Lada, E. A. 1998b, ApJ, 508, 347
- Luhman, Stauffer, & Mamajek (2005) Luhman, K. L., Stauffer, J. R., & Mamajek, E. E. 2005, ApJ, 628, L69
- Luhman et al. (2003) Luhman, K. L., Stauffer, J. R., Muench, A. A., Rieke, G. H., Lada, E. A., Bouvier, J., & Lada, C. J. 2003, ApJ, 593, 1093
- Luhman et al. (2000) Luhman, K. L., et al. 2000, ApJ, 540, 1016
- Marois et al. (2000) Marois, C., Doyon, R., Racine, R., & Nadeau, D. 2000, PASP, 112, 91
- Marois et al. (2003) Marois, C., Doyon, R., Nadeau, D., Racine, R., Riopel, M., & Vallee, P. 2003, Proceedings of the SPIE, 4860, 130
- Marois et al. (2005) Marois, C., Doyon, R., Nadeau, D., Racine, R., Riopel, M., Vallee, P., Lafrenière, D. 2005, PASP, 117, 745
- Martín et al. (1996) Martín, E. L., Rebolo, R., & Zapatero Osorio, M. R. 1996, ApJ, 469, 706
- Masciadri et al. (2005) Masciadri, E., Mundt, R., Henning, Th., Alvarez, C., & Barrado y Navascués, D. 2005, A&A, 625, 1004
- McGovern et al. (2004) McGovern, M. R., Kirkpatrick, J. D., McLean, I. S., Burgasser, A. J., Prato, L., & Lowrance, P. J. 2004, ApJ, 600, 1020
- Meynet et al. (1993) Meynet, G., Mermilliod, J.-C., & Maeder, A. 1993, A&AS, 98, 477
- Mohanty et al. (2004) Mohanty, S., Jayawardhana, R., & Basri, G. 2004, ApJ, 609, 885
- Muench et al. (2002) Muench, A. A., Lada, E. A., Lada, C. J., & Alves, J. 2002, ApJ, 573, 366
- Muench et al. (2003) Muench, A. A., et al. 2003, AJ, 125, 2029
- Nielsen et al. (2005) Nielsen, E. L., et al. 2005, proceedingsn of ”Ultralow-mass star formation and evolution”, Astronomische Nachrichten, Astronomical Notes
- Palla & Stahler (2001) Palla, F., & Stahler, S. W. 2001, ApJ, 553, 299
- Perryman et al. (1997) Perryman, M. A. C., et al. 1997, A&A, 323, L49
- Racine et al. (1999) Racine, R., Walker, G. A. H., Nadeau, D., Doyon, R. & Marois, C. 1999, PASP, 111, 587
- Reid et al. (1999) Reid, I. N., et al. 1999, ApJ, 521, 613
- Reid et al. (2002) Reid, I. N., Gizis, J. E., & Hawley, S. L. 2002, AJ, 124, 2721
- Reiners et al. (2005) Reiners, A., Basri, G., & Mohanty, S. 2005, ApJ, in press
- Rousset et al. (2000) Rousset, G., et al. 2000, Proceedings of the SPIE, 4007, 72
- Simon et al. (2000) Simon, M., Dutrey, A., & Guilloteau, S. 2000, ApJ, 545, 1034
- Stassun et al. (2004) Stassun, K. G., Mathieu, R. D., Vaz, L. P. R., Stroud, N., & Vrba, F. J. 2004, ApJS, 151, 357
- Stauffer et al. (1998) Stauffer, J. R., Schultz, G., & Kirkpatrick, J. D. 1998, ApJ, 499, 199
- Tinney et al. (1993) Tinney, C. G., Mould, J. R., & Reid, I. N. 1993, AJ, 105, 1045
- White et al. (1999) White, R. J., Ghez, A. M., Reid, I. N., & Schultz, G. 1999, ApJ, 520, 811
- Zuckerman et al. (2004) Zuckerman, B., Song, I., Bessell, M. S. 2004, ApJ, 613, L65
- Wilking et al. (1999) Wilking, B. A., Greene, T. P., & Meyer, M. R. 1999, AJ, 117, 469
| Filter | Close et al. 2005 | This work | |||||||
|---|---|---|---|---|---|---|---|---|---|
| S/N | magnitude | F(A)/F(C) | S/NaaIn this measurement of AB Dor C in the long exposures, the short exposure of AB Dor A is used as the PSF. | magnitudeaaIn this measurement of AB Dor C in the long exposures, the short exposure of AB Dor A is used as the PSF. | F(A)/F(C)aaIn this measurement of AB Dor C in the long exposures, the short exposure of AB Dor A is used as the PSF. | magnitudebbIncluding errors from the variability of the PSF between the short and long exposures (§ 2.1.2). | F(A)/F(C)bbIncluding errors from the variability of the PSF between the short and long exposures (§ 2.1.2). | ||
| 10 | 10.76 | 15015 | 3.0 | 10.72 | 14549 | 10.72 | 14564 | ||
| 16 | 10.04 | 1207.5 | 4.2 | 10.18 | 13633 | 10.18 | 13639 | ||
| 11 | 9.45 | 807.5 | 3.9 | 9.79 | 11029 | 9.79 | 11031 | ||