Evolution of damped Lyman kinematics and the effect of spatial resolution on 21-cm measurements
Abstract
We have investigated the effect of spatial resolution on determining pencil-beam like velocity widths and column densities in galaxies. Three 21-cm datasets are used, the HIPASS galaxy catalogue, a subset of HIPASS galaxies with ATCA maps and a high-resolution image of the LMC. Velocity widths measured from 21-cm emission in local galaxies are compared with those measured in intermediate redshift Damped Lyman- (DLA) absorbers. We conclude that spatial resolution has a severe effect on measuring pencil-beam like velocity widths in galaxies. Spatial smoothing by a factor of 240 is shown to increase the median velocity width by a factor of two. Thus any difference between velocity widths measured from global profiles or low spatial resolution 21-cm maps at and DLAs at cannot unambiguously be attributed to galaxy evolution. The effect on column density measurements is less severe and the values of from local low-resolution 21-cm measurements are expected to be overestimated by only 10 per cent.
keywords:
galaxies: ISM, quasars: absorption lines1 Introduction
Damped Lyman- (DLA) absorption systems provide the most practical measure of neutral gas in intermediate redshift galaxies. However, measurements of DLAs provide information in one dimension only – the redshift axis, and only along a single pencil-beam line-of-sight. In rare cases of close binary QSO pairs or gravitationally lensed QSOs, spatial information on the absorbers can be deduced (e.g. Rauch et al., 2002; Ellison et al., 2004). The nature of DLAs can be inferred by comparing observations of DLA velocity widths to models of galaxy evolution.
DLA kinematics and models of galaxy evolution were first compared by Prochaska & Wolfe (1997) who concluded that rapidly rotating protogalactic discs provide the best fit to DLA kinematics. If DLAs are the progenitors of spiral discs, then their velocity widths are expected to match that of present day galaxies. This interpretation however seems to run contrary to cold dark matter theory.
The current structure formation paradigm predicts that star formation first occurs in subgalactic clumps housed in the most massive dark matter halos. This framework is well matched by the assembly of stars and dark matter into galaxies, where more massive halos transform a larger fraction of their gas into stars at high redshift (Jimenez et al., 2005). Further evidence is provided by the clustering strengths of Lyman break galaxies (LBGs) at , showing that LBGs are embedded in massive dark matter halos (Adelberger et al., 2005). DLAs on the other hand are quite distinct from LBGs (Hopkins et al., 2005), perhaps corresponding to lower-mass systems with lower rotational velocities. Since lower-mass systems convert their gas into stars at a slower rate they contribute significantly to the total DLA cross-section (averaged over time).
Hydrodynamic simulations demonstrate that irregular protogalactic clumps can equally reproduce the observed velocity width distribution of DLAs through a combination of rotation, random motions, infall and merging (Haehnelt et al., 1998). Both semi-analytic and numerical models show that the average velocity width of DLAs is expected to increase with evolution to (Cen et al., 2003; Okoshi et al., 2004; Nagamine et al., 2004). Other work (Maller et al., 2001) interprets the kinematics of DLAs as evidence that they arise in galaxies undergoing tidal stripping and mergers.
Because very few DLAs are known at low redshift, it is difficult to measure their statistics directly. Fortunately, at the alternative method of 21-cm emission can be used. It has the added advantage of known galaxy properties so the distribution of DLA galaxy properties such as luminosity and H i mass can be inferred. Rosenberg & Schneider (2003) have compared global 21-cm velocity widths to velocity widths of intermediate redshift DLAs. They conclude that evolution is not the likely cause of the difference between the two populations since velocity widths in their sample of local galaxies are as large or larger than the DLA velocity widths. Instead they suggest that the difference between the two populations could be caused by small number statistics or differences in the way the two populations were measured. Unfortunately 21-cm emission measurements always come with the caveat of spatial resolution as the typical beam size is much larger than the region probed by DLA observations. The extent of the absorbing region in DLAs is only as large as the projected angular extent of the UV-emission region of the background QSO. An upper limit to the optical emission region of one QSO is known to be 0.03 pc by microlensing (Wyithe et al., 2002). The effective angular extent of absorption in each DLAs is expected to be roughly constant with redshift as the angular diameter distance varies less than 20 per cent over , where most QSO probes and DLAs are detected.
In this paper the relationship between H i velocity widths in local galaxies and intermediate redshift DLAs is investigated. Does the velocity width distribution of neutral gas in galaxies change with evolution to ? In addressing this question, the relationship of pencil-beam DLA measurements to the global H i profile of galaxies and the effect of spatial resolution on determining H i column densities and velocity widths in 21-cm maps must also be investigated.
2 DLA Kinematics
Here we test the evolution of galaxy kinematics by comparing DLAs at intermediate redshifts with gas-rich galaxies at the present epoch. Velocity widths from two different 21-cm datasets are utilised: the 4315 galaxies in HICAT, which is the H i Parkes All Sky Survey (HIPASS) galaxy catalogue (Meyer et al., 2004) and a subset of 34 HICAT galaxies with Australia Telescope Compact Array (ATCA) maps (Ryan-Weber et al., 2003). Velocity widths from these 21-cm observations are compared with a complilation of velocity widths from 94 DLAs (Wolfe et al., 2005). The velocity widths of DLAs are measured using low ionisation metal lines such as Si+, Fe+ and Ni+ to trace the neutral gas, as the Ly line, by definition, is saturated and does not resolve the DLA kinematics. Velocity profiles of low ionisation metal lines trace each other well and therefore are assumed to trace the kinematics of the cold gas. This assumption could be verified with high resolution IUE spectra towards SN 1987A (Blades et al., 1988).
The global H i profile statistic used from HICAT is , the velocity width at 50 per cent of the profile maximum. Comparisions are made with /2 as a single sight-line though a galaxy will presumably only sample one half of a galaxy’s rotation. The relative contribution of each galaxy has been weighted by the H i mass dependent DLA cross-section (Ryan-Weber et al., 2003). Figure 1 shows the distribution of /2 and velocity widths of low ionisation lines in DLAs. A Kolmogorov-Smirnov (K-S) test shows the probability that the two data sets are drawn from the same distribution is , compared with Rosenberg & Schneider (2003), who find and conclude that evolution in the kinematics of H i-rich galaxies cannot be ruled out (a value of would rule out evolution). The same conclusion is then reached with the HICAT dataset: evolution cannot be ruled out, the two populations may differ due to evolution, but could also differ due to small number statistics or differences in the way the velocity widths are measured.

Differences in the way the velocity widths are measured can be reduced by measuring the 21-cm widths with a method that most closely resembles the determination of QSO absorption line velocity widths. Prochaska & Wolfe (1997) measure the velocity width across the central 90 per cent of the optical depth. The ATCA 21-cm maps are used to measure a pixel velocity width along the velocity axis of each spatial pixel in each galaxy map. Only spatial pixels that satisfy the DLA cutoff, cm-2, are included. The velocity width is determined for the central 90 per cent of the integrated profile, this measurement is denoted by . The average restored beam of the ATCA maps is 1′, corresponding to a physical extent of 2 to 7 kpc.
Figure 2 shows that neither nor /2 provides a good statistical representation of the median velocity width. Only 18 of the 34 galaxies in the sample have /2 measurements that fall within 30 km s-1 of their median . This is not a result of the DLA nor 90 per cent cutoff, as a similar spread of median velocity widths is found when all spatial pixels with cm-2 or 100 per cent of the integrated profile is considered.
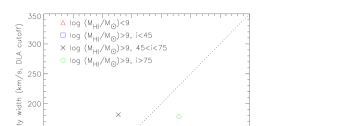
The reason why widths are not well represented by pixel velocity widths is due to the variety of galaxy types in the sample. This is problematic as it is now well established that the local galaxy population weighted by DLA H i cross section samples a variety of galaxy types (Ryan-Weber et al., 2003; Zwaan et al., 2005). Low mass and dwarf galaxies tend to have Gaussian velocity profiles that remain approximately constant over the area of the 21-cm map. The method acting on a Gaussian profile, will return velocity widths which are by definition 29 per cent larger than the FWHM, that is, per cent larger than /2. Face-on spiral galaxies are expected to follow a similar overestimate of velocity widths, but not as extreme as the low mass galaxies. On the other hand, the pixel velocity widths of large edge-on spiral galaxies that have many pixels spread over a large area are more likely to be lower than /2. These trends are summarised in Figure 2. As expected, all the low mass (log /) galaxies lie on or above the line where /2 equals the median . Most face-on (inclination ) high mass (log /) galaxies also lie on the same side of the line. However, most massive edge-on (inclination ) galaxies have median that are well below their global /2 measurements. The range of galaxy types means than any statistic of the pixel velocity width, e.g. some fraction of the maximum velocity width, will not be well represented by any global velocity width statistic. We conclude that the global value does not provide a good estimate of pencil-beam velocity widths, as measured in DLAs.

Pixel velocity widths from the ATCA galaxies are compared with those from DLAs in Figure 3. The K-S probability is calculated to be less than 0.001, indicating that the two distributions are different. Does this mean that there is genuine evolution in velocity width from the intermediate redshift DLAs to present day H i-rich galaxies, or is the difference still due to the measurement techniques? The lack of high velocity widths could be caused by treating galaxies as individual systems, if their satellites were considered, larger velocity widths could be invoked. A deficit of low velocity widths cannot be caused by velocity resolution since the resolution is 3.3 km s-1 in the ATCA images. The galaxies that tend to have the lowest velocity widths also have the smallest contribution to , however there seems to be a complete lack of values below 40 km s-1. The DLA column density cutoff is well above the noise limit in the ATCA images, so the signal-to-noise ratio cannot be an issue. Discrepancies between the velocity width of gas measured in emission and absorption would ideally be tested with UV spectroscopy towards QSOs recently identified behind the Large Magellanic Cloud (LMC, Geha et al., 2003; Dobrzycki et al., 2005), an experiment that awaits the next space-based UV spectrograph.
3 Velocity Width Statistics with the LMC
The absence of low velocity line widths could be caused by the relatively low spatial resolution of the ATCA galaxy maps. Following on from Prochaska et al. (2002) a comparison can be made using the H i data cube of LMC. The LMC data cube is a high-resolution 21-cm data cube constructed from the combined Parkes and ATCA survey of Kim et al. (2003). The data has a velocity resolution of 1.6 km s-1 and a column density sensitivity of 4 cm-2 (for a line width of 40 km s-1). The LMC has an H i mass of 3.8, a global H i velocity width, =80 km s-1, is located at a distance of 50 kpc (Staveley-Smith et al., 2003) and has an inclination of 42∘ (Weinberg & Nikolaev, 2001). The ATCA galaxy and LMC maps both have an angular resolution of 1′. However, the LMC is 80 to 480 times closer than the galaxies in the ATCA sample, leading to a large difference in physical spatial resolution, kpc per beam for the ATCA galaxy sample compared with 15 pc per beam for the LMC.
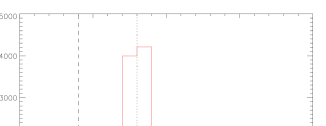
Since the LMC data cube contains over spatial pixels, a random sample of pixels is used in this analysis. The method was applied to this random sample of pixels and the results are given in Figure 4. Only pixels that satisfy the DLA cutoff, cm-2, were included. The LMC cube was convolved with a 2-D circular Gaussian in the spatial plane. The LMC cube was smoothed on three scales such that the resolution in the smoothed cubes were 80, 240 and 480 times greater than the original. A resolution factor of 240 corresponds to a final resolution of 4∘, effectively placing the LMC at 12 Mpc, or the maximum distance at which galaxies with H i masses similar to the LMC are found in the ATCA galaxy sample.
The velocity width histogram for this smoothed cube is plotted in Figure 4. The difference is stark and shows that the median velocity width from the smoothed cube using the method is now comparable to , rather than /2. Decreasing the resolution shows an overall increase in the median velocity width is because the velocity width of the smoothed set of pixels will return the maximum velocity width rather than the average velocity width. The median velocity width continually increases with decreasing resolution: the unsmoothed cube with a resolution of 1′ and smoothed cubes with resolutions 1.3∘, 4∘ and 8∘ have median velocity widths of 41, 64, 81 and 87 km s-1 respectively. Turning this statement around, as the resolution increases, the distribution of velocity width spreads from half the low resolution minimum velocity width to the low resolution maximum velocity width and the median is reduced by half. Applying this general trend to the ATCA galaxy sample in Figure 3, a distribution more like the DLAs is obtained. Therefore this resolution effect cannot be decoupled from evolution in the velocity width distribution between local gas-rich galaxies and higher redshift DLAs.
The highest resolution LMC cube probes structure on scales 500 times greater than that of DLA measurements. Decreasing the spatial resolution in the LMC cube a further 240 times essentially doubles the median velocity width. If H i structure is self-similar on smaller scales, then one would expect the velocity widths to decrease further as the scale on which DLAs are measured is approached.
4 The Effect of Spatial Resolution on Column Density
Since spatial resolution was found to have such a dramatic effect on velocity width measurements, what is its effect on the other 21-cm based quantities? There is only one case of H i emission detected from a DLA galaxy. The DLA galaxy SBS 1543+593 (Bowen et al., 2001) has been mapped using GMRT (Chengalur & Kanekar, 2002) in 21-cm. The column density measured at the QSO location in the GMRT map is cm-2, in reasonable agreement with the Ly column density of cm-2. Here the effect of resolution on the column density distribution function, , and the cross-section of H i satisfying the DLA criteria, that is the number density of DLAs per unit redshift, , is investigated.
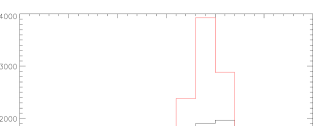
The column density histogram for random spatial pixels in the LMC cube is given in Figure 5 together with the histogram derived from the LMC cube convolved with a circular Gaussian to produce a cube smoothed in the spatial plane with FWHM = 4∘. The full range of column densities are considered here. Lowering the resolution in the cube means that any fine structure in low or high column density regions is washed out. The histogram reflects this qualitative expectation and shows that the distribution of column densities are truncated at both the low and high ends.
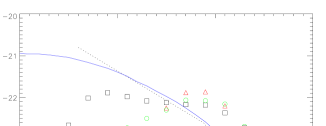
The column density distribution function will naturally be influenced by this change in distribution. Figure 6 shows from Ryan-Weber et al. (2003) and Zwaan et al. (2005) together with calculated from random spatial pixels in the LMC cube at the full resolution and smoothed at two different levels. Since only one galaxy, the LMC, is considered, the same arbitrary normalisation is applied to all the LMC points. None of the LMC functions resemble the shape of calculated from many galaxies. The shape of does vary between galaxies and a turnover at cm-2 occurs in 10 per cent of the ATCA galaxies (see Ryan-Weber et al. (2003) figure A2). The plot shows that decreasing the resolution creates a hump in the centre of the function. Applying this trend to calculated from the lower resolution ATCA maps, suggests that the ‘real’ underlying could be described by a single power law, as the lower slope would steepen and the upper slope would flatten. Although this change in shape is based on one galaxy only.
The calculation of the number of DLAs per unit redshift at , , is also affected by resolution. The DLA cross-section of the LMC increases slightly with decreasing resolution: the increase in the DLA cross-section from the original resolution to cubes smoothed to a resolution of 1.3, 4 and 8∘ is 11, 12, and 12 per cent respectively. Hence the overall effect of resolution on local calculations (Rosenberg & Schneider, 2003; Ryan-Weber et al., 2003, 2005; Zwaan et al., 2005) is small, and this per cent increase lies within the uncertainties for the measured values of .
5 Summary
The results highlight the difference in conclusions when velocity widths are measured in different ways. The velocity width from a galaxy’s global H i profile is not well represented by the distribution of pixel (pencil-beam like) velocity widths in a galaxy. Instead, the relationship between and median pixel velocity width was found to depend on galaxy mass and inclination. This work provides a solid basis for the suggestion by Rosenberg & Schneider (2003) that evolution in DLA kinematics (measured by 21-cm global velocity widths at , and absorption line profiles at higher redshift) cannot be decoupled from the different measurement techniques. Thus using DLA velocity widths to infer the total velocity width of a galaxy and related quantities, e.g. mass, must also be used with caution (e.g. Godfrey & Francis, 2005).
Furthermore, when we use a method that most closely resembles that of DLA velocity width measurements, the method, the same conclusion is reached. The distribution of velocity widths measured in DLAs at intermediate redshifts is different from those measured along the line-of-sight of individual spatial pixels within galaxies. It is not possible to decouple the effect of spatial resolution in low-resolution 21-cm maps from evolution in galaxy kinematics. Unfortunately the large difference in spatial resolution sampled by 21-cm emission and Ly absorption cannot be reconciled. The results of Prochaska et al. (2002) still hold, as a single low-mass galaxy such as the LMC cannot account for high ( km s-1) DLA velocity widths. However differences still exist between the highest resolution 21-cm data, which have multi-component profiles overlaping in velocity coverage, and DLA profiles, which tend to decompose into several components distinct in velocity coverage (e.g. Wolfe et al., 2005).
Column density measurements and related calculations are not adversely affected by spatial resolution. Lowering the resolution in 21-cm data means that fine structure in low or high column density regions is washed out. This causes a central hump in the column density distribution function. The expected increase due to spatial resolution effects in calculating at z=0 is within uncertainties quoted in Rosenberg & Schneider (2003), Ryan-Weber et al. (2003, 2005) and Zwaan et al. (2005).
Acknowledgments
EVR-W acknowledges support from the University of Melbourne A.J. Shimmins Postgraduate Writing-Up Award.
References
- Adelberger et al. (2005) Adelberger K. L., Steidel C. C., Pettini M., Shapley A. E., Reddy N. A., Erb D. K., 2005, ApJ, 619, 697
- Blades et al. (1988) Blades J. C., Wheatley J. M., Panagia N., Grewing M., Pettini M., Wamsteker W., 1988, ApJ, 334, 308
- Bowen et al. (2001) Bowen D. V., Tripp T. M., Jenkins E. B., 2001, AJ, 121, 1456
- Cen et al. (2003) Cen R., Ostriker J. P., Prochaska J. X., Wolfe A. M., 2003, ApJ, 598, 741
- Chengalur & Kanekar (2002) Chengalur J. N., Kanekar N., 2002, A&A, 388, 383
- Dobrzycki et al. (2005) Dobrzycki A., Eyer L., Stanek K. Z., Macri L. M., 2005, A&A, 442, 495
- Ellison et al. (2004) Ellison S. L., Ibata R., Pettini M., Lewis G. F., Aracil B., Petitjean P., Srianand R., 2004, A&A, 414, 79
- Geha et al. (2003) Geha et al. 2003, AJ, 125, 1
- Godfrey & Francis (2005) Godfrey L. E. H., Francis P. J., 2005, Publications of the Astronomical Society of Australia, 22, 245
- Haehnelt et al. (1998) Haehnelt M. G., Steinmetz M., Rauch M., 1998, ApJ, 495, 647
- Hopkins et al. (2005) Hopkins A. M., Rao S. M., Turnshek D. A., 2005, ApJ, 630, 108
- Jimenez et al. (2005) Jimenez R., Panter B., Heavens A. F., Verde L., 2005, MNRAS, 356, 495
- Kim et al. (2003) Kim S., Staveley-Smith L., Dopita M. A., Sault R. J., Freeman K. C., Lee Y., Chu Y.-H., 2003, ApJS, 148, 473
- Maller et al. (2001) Maller A. H., Prochaska J. X., Somerville R. S., Primack J. R., 2001, MNRAS, 326, 1475
- Meyer et al. (2004) Meyer et al. 2004, MNRAS, 350, 1195
- Nagamine et al. (2004) Nagamine K., Springel V., Hernquist L., 2004, MNRAS, 348, 421
- Okoshi et al. (2004) Okoshi K., Nagashima M., Gouda N., Yoshioka S., 2004, ApJ, 603, 12
- Prochaska et al. (2002) Prochaska J. X., Ryan-Weber E., Staveley-Smith L., 2002, PASP, 114, 1197
- Prochaska & Wolfe (1997) Prochaska J. X., Wolfe A. M., 1997, ApJ, 487, 73
- Rauch et al. (2002) Rauch M., Sargent W. L. W., Barlow T. A., Simcoe R. A., 2002, ApJ, 576, 45
- Rosenberg & Schneider (2003) Rosenberg J. L., Schneider S. E., 2003, ApJ, 585, 256
- Ryan-Weber et al. (2003) Ryan-Weber E. V., Webster R. L., Staveley-Smith L., 2003, MNRAS, 343, 1195
- Ryan-Weber et al. (2005) Ryan-Weber E. V., Webster R. L., Staveley-Smith L., 2005, MNRAS, 356, 1600
- Staveley-Smith et al. (2003) Staveley-Smith L., Kim S., Calabretta M. R., Haynes R. F., Kesteven M. J., 2003, MNRAS, 339, 87
- Weinberg & Nikolaev (2001) Weinberg M. D., Nikolaev S., 2001, ApJ, 548, 712
- Wolfe et al. (2005) Wolfe A. M., Gawiser E., Prochaska J. X., 2005, ARA&A, 43, 861
- Wyithe et al. (2002) Wyithe J. S. B., Agol E., Fluke C. J., 2002, MNRAS, 331, 1041
- Zwaan et al. (2005) Zwaan M. A., van der Hulst J. M., Briggs F. H., Verheijen M. A. W., Ryan-Weber E. V., 2005, MNRAS, accepted, astro-ph/0510127