Spectroscopic Redshifts for Seven Lens Galaxies
Abstract
We report Very Large Telescope observations of lensed quasars, designed to measure the redshifts of their lens galaxies. We successfully determined the redshifts for seven systems, five of which were previously unknown. The securely measured redshifts for the lensing galaxies are: HE00471756 ; PMNJ01340931 ; HE02302130 ; HE04351223 ; SDSS0924021 ; LBQS1009025 ; and WFIJ2033472 . For four additional systems (BRI09520115, Q1017207, Q13552257 and PMNJ1632003) we estimate tentative redshifts based on some features in their spectra.
Subject headings:
cosmology: gravitational lensing — Quasars: general — Quasars: individual: HE00471756, PMNJ01340931, HE02302130, HE04351223, SDSS0924021, BRI09520115, LBQS1009025, Q1017207, Q13552257, PMNJ1632003, WFIJ20334721. Introduction
The roughly known gravitational lens systems are powerful tools for studying cosmology, galaxy structure and galaxy evolution. Most systems have been observed with the Hubble Space Telescope (HST) to obtain precise photometry and astrometry, and increasing numbers have time delay measurements, measurements of microlensing variability, and determinations of the velocity dispersion of the lens galaxy. However, about of the systems still lack the most basic parameters needed to use a lens as an astrophysical tool – the lens and/or source redshifts.
One important application of the lenses is to study the evolution of galaxy mass-to-light ratios. Gravitational lenses, unlike other samples of galaxies, are selected based on their masses, rather than their colors or surface brightnesses. By combining the masses of the lenses, as determined by lensing, with the photometry of the lens galaxies as determined from HST images, it is possible to measure directly the mass-to-light ratio of the lens population as a function of redshift (e.g., Treu et al. 2002; Rusin et al. 2003; Treu & Koopmans 2004; Rusin & Kochanek 2005). Rusin & Kochanek (2005), found that mass-selected lens galaxies show the same evolution rate as has been found for early-type galaxies in clusters (e.g., van Dokkum et al 1998; Pahre et al. 2001), and agree with the field evolution rates found by van Dokkum et al. (2001), but not with the faster rates found by Treu et al. (2002). The sample studied by the latter authors may have selection effects biasing it towards higher surface brightness, younger, systems. Many of the lens mass-to-light ratios have, however, large errors due to the uncertainties in their redshifts, increasing the errors in the estimated average evolution rate.
A second important application of lenses is to determine the surface density of dark matter and stars near the lensed images, by measuring time delays between lensed images, and by monitoring for microlensing. Time delays determine the combination of physical variables (Kochanek 2002), where is the Hubble parameter, is the mean surface density in the annulus between the images used to determine the time delay, normalized to the critical surface density,
| (1) |
The critical surface density is a function of the angular diameter distances , , and , between the observer and source, observer and lens, and lens and source, respectively. Assuming is known, measurements of time delays and microlensing variability can be used to determine the surface mass density and the fraction of that density in stars in the interesting regime where a galaxy is changing from being primarily stars to being dark-matter dominated.
A third application of lensed quasar systems which requires the lens galaxy redshifts is the estimation of the mass and number evolution of massive galaxies. For an unevolving comoving density of massive galaxies, the number of lenses is proportional to the volume out to the source, which is determined by cosmology (e.g., Mitchell et al. 2004). Thus, no-evolution models with large dark-energy content, which have a large volume out to a given source redshift, predict a large incidence of quasar lensing and a distribution of lens galaxy redshifts shifted to relatively high redshift. The currently favored cosmology (, ) may predict too many lenses, given a non-evolving lens population (e.g., Maoz 2005). We can therefore turn the problem around; for a fixed cosmology, the only significant variables are the mass and number-density of massive galaxies, and their evolution (e.g., Ofek, Rix, & Maoz 2003; Chae et al. 2003). By analyzing samples having complete source and lens redshifts, it is possible to constrain the evolution rate of a mass-selected sample, without the problem of surface brightness selection effects that plague other samples.
In summary, each new lens redshift facilitates a wide array of astrophysical experiments. In this paper, we present European Southern Observatory (ESO) Very Large Telescope (VLT) Focal Reducer/Low Dispersion Spectrograph - 2 (FORS2) observations of lensed systems, most of which lack lens galaxy redshift information. In seven cases the spectra yield reliable redshifts for the lensing galaxies. In §2 we describe the observations, the reduction, and the isolation and characterization of the lens galaxy spectra in the presence of strong contamination by lensed quasar light. The spectra and the measured redshifts for each galaxy are presented and discussed in §3.
2. Observations and Reduction
We obtained low resolution spectra for gravitationally lensed systems using the FORS2 spectrograph mounted on the VLT-Unit Telescope at Paranal. We used a -wide slit and the 200I grism blazed at Å, giving a wavelength range of Å to Å, a dispersion of Å per binned pixel, and Å full width at half maximum (FWHM) resolution. The MIT kk pixel CCD was used, with on-chip binning of , giving a scale of per binned pixel. The observations were conducted in Service Mode on various dates, with an image quality varying between and FWHM. Table 1 lists, for each object, the observation date, the number of exposures and integration time per night, the total number of exposures, the total integration time, the seeing range and median in which the images were obtained, and the slit position angle.
| Object Name | # of Exp. | Exp. time | Date | Seeing (Min..Median..Max) | PA |
|---|---|---|---|---|---|
| [sec] | [“] | [deg] | |||
| HE00471756 | 15-10-2004 | ||||
| 13-11-2004 | |||||
| total | .... | ||||
| PMNJ01340931 | 13-11-2004 | .... | |||
| HE02302130 | 11-11-2004 | .... | |||
| HE04351223 | 14-12-2004 | .... | |||
| SDSS0924021 | 14-12-2004 | ||||
| 15-01-2005 | |||||
| total | .... | ||||
| BRI09520115 | 05-01-2005 | ||||
| 14-01-2005 | |||||
| total | .... | ||||
| LBQS1009025 | 08-01-2005 | ||||
| 14-01-2005 | |||||
| total | .... | ||||
| Q1017207 | 12-01-2005 | ||||
| 15-01-2005 | |||||
| total | .... | ||||
| Q13552257 | 04-02-2005 | ||||
| 14-03-2005 | |||||
| total | .... | ||||
| PMNJ1632003 | 14-03-2005 | .... | |||
| WFIJ2033472 | 15-10-2004 | .... |
Note. — For objects that were observed on more then one night, the last line gives the total number and total time of exposures.
Figure 1 shows HST images of each system, with the slit orientation and actual slit width overlayed. Even with the good seeing conditions at the VLT site, the lensing galaxy light is blended with light from one or more of the quasar images. The slit orientation was chosen to include, in addition to the lens galaxy, the lensed quasar image producing the dominant contamination. With a proper characterization of the contaminating image, we could then subtract it from the lens spectrum.
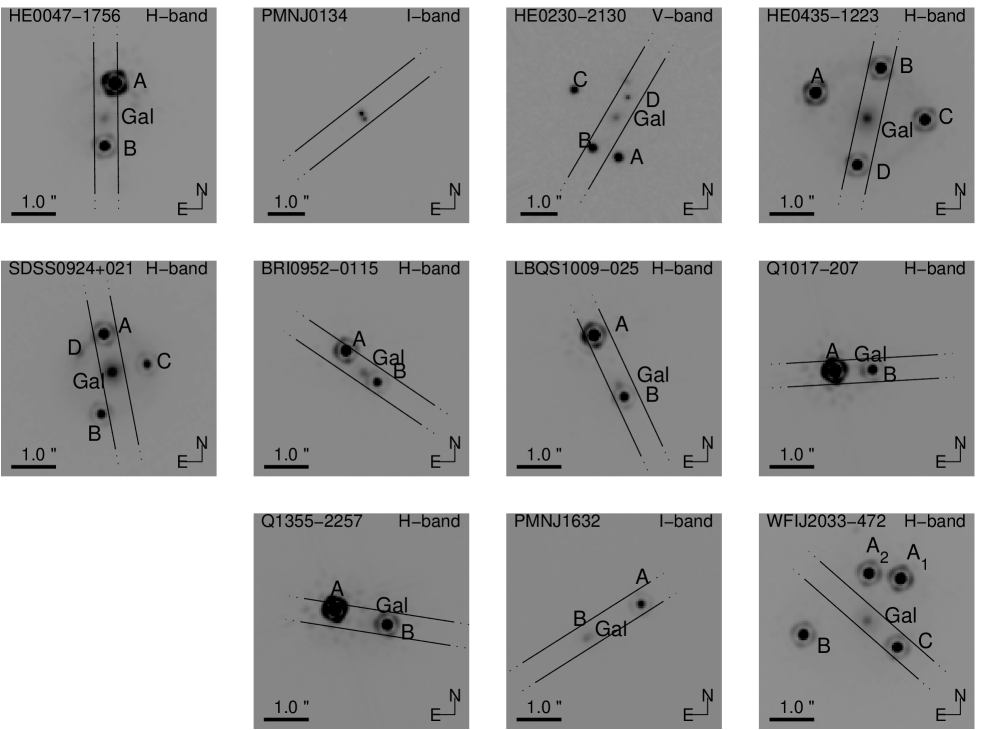
Image reduction was performed
on the bias-subtracted and wavelength-calibrated
images provided by ESO
using MATLAB scripts specifically written by us for this purpose.
The process included the following steps.
First, cosmic-ray rejection was performed by interpolating over pixels
with counts
that were above their neighboring pixels.
We then improved the wavelength calibration by identifying the night-sky emission line peaks,
and fitting a third order polynomial matching the measured wavelength of the peaks
to their known wavelengths111Sky line wavelengths were taken from
http://alamoana.keck.hawaii.edu/inst/lris/skylines.html.
Sky subtraction was performed by means of a linear fit to the background counts
in each CCD row along the cross-dispersion direction.
In the fit, we used a -clipping algorithm to remove outlier points due to residual
cosmic rays and bad pixels.
In all cases, the galaxy light is blended with the light from the quasar images. Due to the different colors of the components and the faintness of the galaxy relative to the quasar, conventional tracing of the positions of the spectra along the cross-dispersion direction may not work. In order to overcome this problem, we have designed our tracing algorithm as follows.
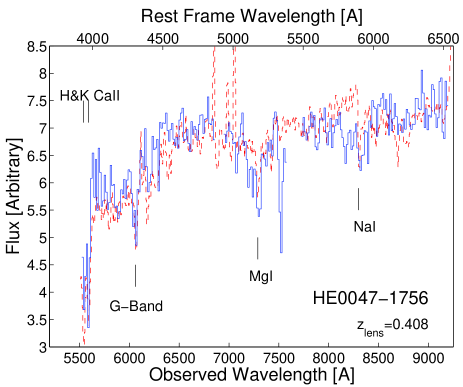
We trace the spectra by fitting the fluxes and widths of Gaussians models for each component in the slit as a function of wavelength, where the relative spatial positions of the Gaussians were fixed using high-precision astrometry from HST images of the lenses (Falco et al. 2001 and the CASTLES database222http://cfa-www.harvard.edu/castles/index.html). We extracted a spectrum at the position of the galaxy (contaminated by the quasar light) and a spectrum of the quasar from a position along the slit that is diametrically opposed to, and as far as possible from, the galaxy position, but still having sufficient signal-to-noise (S/N) ratio. The spectra were corrected for atmospheric extinction using standard extinction curves333http://www.eso.org/, and flux calibrated using the standard star LTT1788. A “cleaned” galaxy spectrum (i.e., de-contaminated of quasar light) was obtained by subtracting a scaled version of the quasar spectrum from the blended galaxy spectrum. The proper scaling of each of the quasar spectra was found by visual inspection of the subtracted spectra of the galaxy, and by requiring that the quasar emission lines vanish from the decontaminated galaxy spectrum. The galaxy fraction in the blended quasar+galaxy spectrum was in the range to , with a median of . Figures 2-8 show the spectra of the lensing galaxies for which we succeed in measuring redshifts. In the other four cases, low S/N in the galaxy spectrum, excessive contamination from the quasars, or other peculiarities of the spectrum (see below), prevented us from measuring secure lens redshifts.
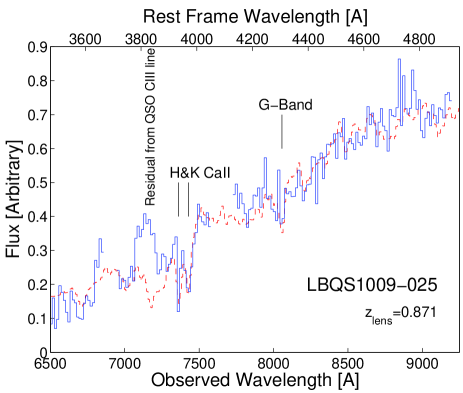
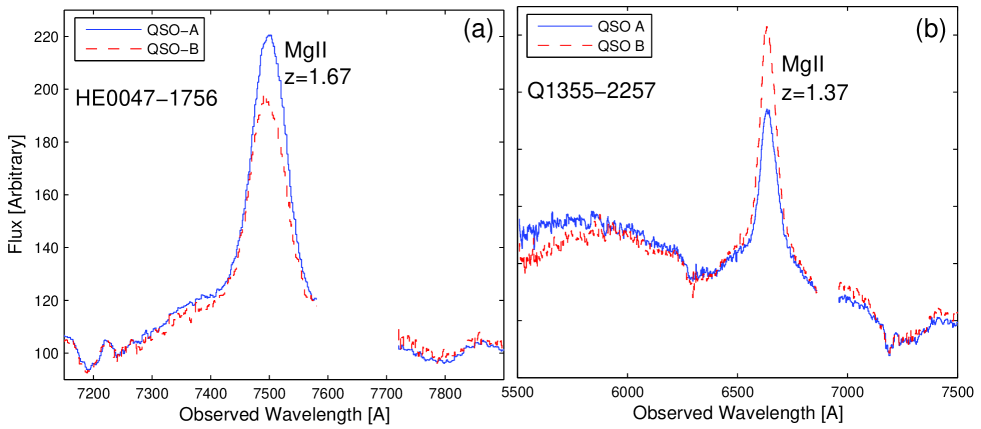
Our extraction process is not free of complications. Lensed quasars show differences among lensed images in both the continua and the emission lines (e.g., Richards et al. 2004; Keeton et al. 2005). For example, in Fig. 9-a we show the Mg II emission line of the two images of HE00471756. After matching the continua of the two quasar images to the same level, there is a difference in the flux of the Mg II lines. This difference is not due to the galaxy. The total emission from the galaxy, most of which lies in our galaxy aperture rather than the quasar apertures, is only that of the quasars, and the spectrum of the galaxy has no feature near the Mg II emission line that could produce an apparent difference between the line and continuum of the quasar. Figure 9-b shows a second example, the spectra of both quasar images of Q13552257 in the vicinity of the Mg II emission line. The line equivalent widths differ by about . Such differences in quasar spectra can be the result of microlensing that is preferentially magnifying or demagnifying the continuum or the emission lines of the images (e.g., Schechter & Wambsganss 2002; Keeton et al. 2005), millilensing (e.g., Abajas et al. 2002; Lewis & Ibata 2004; Keeton et al. 2005), or intrinsic quasar variability (e.g., Kaspi et al. 2000; 2005) combined with the time delay between the images (about days and days for HE00471756 and Q13552257, respectively; Witt, Mao, & Keeton 2000). The spectral differences between the two images could affect the galaxy spectrum that is obtained by subtracting the spectrum of quasar A from the lensed spectrum at the galaxy position, which is located between images A and B (see Fig. 1). An example of this effect is seen in the spectrum of LBQS1009025 (Fig. 7), in which a residual of the quasar’s C III] emission line is left in the “cleaned” galaxy spectrum. Note that, in this case, the lensing galaxy is located on top of image B (see Fig. 1) and hence there is no choice but to use image-A for the subtraction.
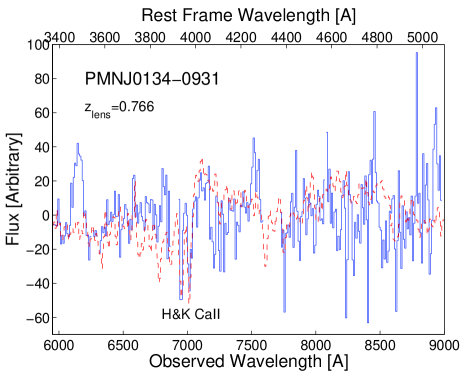
The redshifts of each galaxy were obtained by cross correlating the spectrum with template local galaxy spectra from Kinney et al. (1996). For each galaxy we tried template spectral types from elliptical to Sc, or “mixes” of varying weights between two adjacent types. To each template we first applied the redshift and then the Galactic extinction (Schlegel, Finkbeiner, & Davis 1998) toward the lens. In one case, PMNJ01340931, the lensing galaxy was not detected directly (by the procedure described above), but several absorption lines are visible in the quasar spectrum. In this case, we subtracted from the quasar spectrum a smoothed version of itself, and compared the resulting absorption line spectrum with a similarly normalized galaxy template.
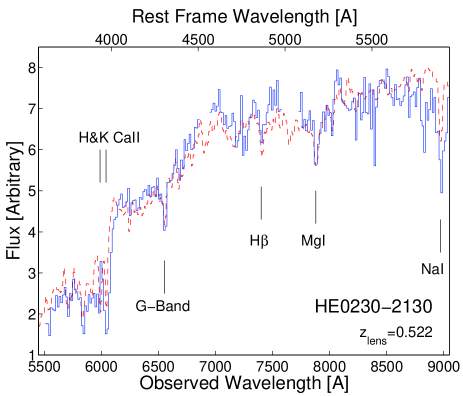
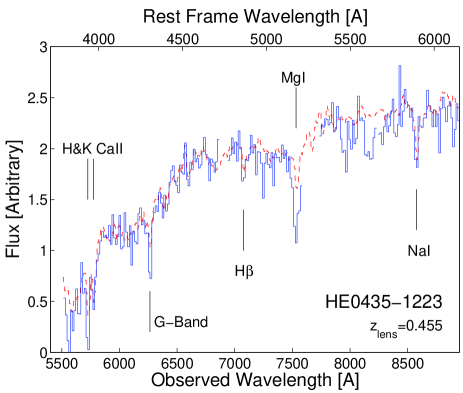
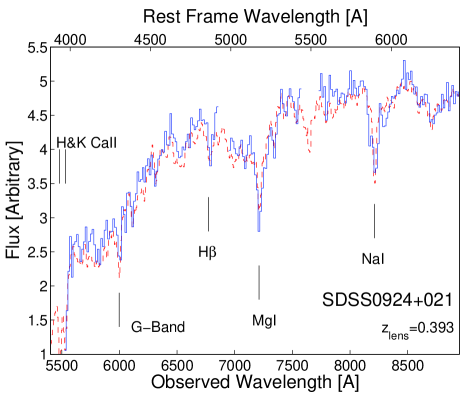
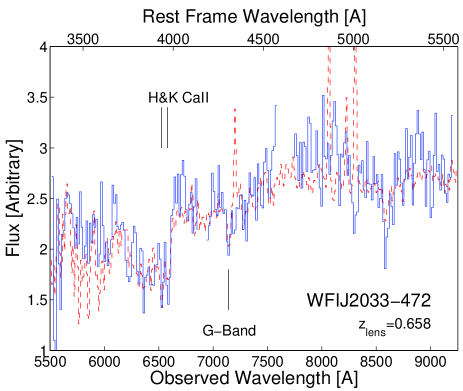
Figures 2-8 show, along with the spectra of the lensing galaxies, also the best matching galaxy templates. The measured redshifts of the lensing galaxies, the Galactic extinctions (Schlegel et al. 1998), and the quasar redshifts, are summarized in Table 2. The redshifts of two of the lensing galaxies have been previously measured. The lens redshift of PMNJ01340931 was previously measured to be , by Hall et al. (2002, based on the H&K Ca II absorption) and by Kanekar & Briggs (2003, based on cm HI absorption). During the course of our VLT program, the lensing galaxy redshift in HE04351223 was measured by Morgan et al. (2005) to be . In both cases, we confirm the measured redshifts.
Although the continuum slopes and absorption features of three of the lens galaxies are best fit by spiral, rather than elliptical or S0 templates, in most cases there is evidence that the lens galaxies are nevertheless early types, which at high redshifts may have bluer colors than those of local ellipticals, probably due to some post-starburst signatures. Indeed, the [O III] emissions lines in the spiral templates are always absent in the lens galaxies, indicating a lack of ongoing star formation. In two cases, the intrinsically blue color may be compounded by some mild distortion of the continuum slope as a result of differential atmospheric refraction affecting our spectra, which were obtained at a non-parallactic angle. The observational and evolutionary effects are both discussed on a case by case basis in §3.
| Object Name | Galactic | ||
|---|---|---|---|
| HE00471756 | |||
| PMNJ01340931 | aaRedshift previously measured by Hall et al. (2002), and Kanekar & Briggs (2003). | ||
| HE02302130 | |||
| HE04351223 | bbRedshift previously measured by Morgan et al. (2005) | ||
| SDSS0924021 | |||
| BRI09520115 | |||
| LBQS1009025 | |||
| Q1017207 | |||
| Q13552257 | |||
| PMNJ1632003 | |||
| WFIJ2033472 |
.
Note. — The uncertainty in redshift for all lenses is , and is dominated by the error in the cross correlation, with a smaller contribution from the wavelength calibration uncertainty. The cross-correlation uncertainty was estimated based on a test.
3. Notes on individual objects
HE00471756: A doubly imaged lensed quasar discovered by Wisotzki et al. (2004), with an image separation of . The continuum and absorption features of the lens galaxy spectrum, shown in Fig. 2, are best matched by an SbSc template (with a mix ratio of ), at redshift . We note, however, that the emission lines in the template are absent from the lens galaxy spectrum. To investigate the source of this disparity, we have first examined whether the blue color of the lens galaxy could be the result of light loss through the slit, as a result of the differential atmospheric refraction444http://www.eso.org/gen-fac/pubs/astclim/lasilla/diffrefr.html (Fillipenko 1982) and the non-parallactic slit angle that we used. We have estimated at the possible change in spectral slope due to such light loss, for the particular slit angle, declination, observed hour angles and seeing widths appropriate for each exposure of this object. The corresponding difference in spectral slopes between the best-fit template and that of an elliptical galaxy is . Furthermore, since the slit-centering acquisition images were obtained in the band, we would expect that atmospheric refraction would lead to blue, rather than red, light loss, and hence to a reddening of the continuum. The blue color is therefore unlikely to be an observational defect.
A rough test of whether the mass of the lens is consistent with that of a normal spiral galaxy can be obtained by evaluating the velocity dispersion of a singular isothermal sphere (SIS) that would produce the observed image separation, given the source and lens redshifts,
| (2) |
where is the image separation. For the case at hand, km s-1, which is typical of early-types, but somewhat large for spirals. Along with the absence of indications of ongoing star formation, this argues that the lens galaxy is of early type. Its relatively blue color may then be the result of post-starburst signatures that are still present at the Gyr lookback time.
PMNJ01340931: A highly reddened lensed quasar with a complex radio morphology, discovered by Winn et al. (2002a). The quasar is at redshift . The two brightest images are separated by (see Fig. 1). The lensing galaxy redshift was measured by Hall et al. (2002) and by Kanekar & Briggs (2003) and found to be . This is consistent with our result, , based on the spectrum shown in Fig. 3.
HE02302130: Discovered by Wisotzki et al. (1999), this is a quadruply lensed quasar with redshift and a maximum image separation of . The lensing galaxy spectrum, shown in Fig. 4, is well matched by an equal mix of a S0 and Sa templates, with a redshift of . Following the same test as in the case of HE00471756, above, we find that the non-parallactic slit angle could lead to a change in slope of , and as before, this would likely be in the sense of making the object redder. Between the S0 and Sa templates, the slope in the observed frame 6000-8500 Å range changes by . Thus, observational effects could possibly play a partial role in the blue color of the lens galaxy. In terms of galaxy mass, the derived SIS velocity dispersion in this case is km s-1, which would be highly unusual for a spiral galaxy. We conclude that the lens galaxy is of early type with a blue color probably due to its being observed at a lookback time of 5 Gyr.
HE04351223: Discovered by Wisotzki et al. (2002), with a quasar redshift of . This is a quadruply lensed system with a maximum image separation of . The lens redshift was recently measured at (Morgan et al. 2005). We confirm this result and find that the galaxy spectrum, presented at Fig. 5, is well matched by an S0 template.
SDSS0924021: Discovered as part of the Sloan Digital Sky Survey by Inada et al. (2003). This is a quadruply lensed quasar with a maximum image separation of , in which the merging pair (images A & D in Fig. 1) has a broad-band flux ratio of – the most extreme known case of a “flux ratio anomaly” (see Keeton et al. 2005, for implications). The lensing galaxy spectrum, shown in Fig. 6, is well matched by an E galaxy template, with a redshift of .
BRI09520115: A doubly imaged quasar, with separation, discovered by McMahon & Irwin (1992). At (the redshift measurement was refined by Storrie-Lombardi et al. 1996), this is the highest redshift lensed quasar known. The “fundamental-plane redshift” of the lensing galaxy is (Kochanek et al. 2000). Storrie-Lombardi et al. (1996) identified several metal absorption systems, at redshifts of , , , , and in the spectrum of the lensed quasar, one or more of which could contribute to the lensing. We note, however, that if these absorbers indeed contribute to the lensing then the fundamental-plane redshift may be biased toward lower redshifts. Even with over hours of exposure time, the signal from the galaxy is too low to securely identify any features in the spectrum.
LBQS1009025: A doubly imaged quasar, with image separation, discovered by Hewett et al. (1994). The quasar is at a redshift of . The lensing galaxy spectrum, shown in Fig. 7, is matched by an E galaxy template with a redshift of , very close to the fundamental-plane redshift () found by Kochanek et al. (2000).
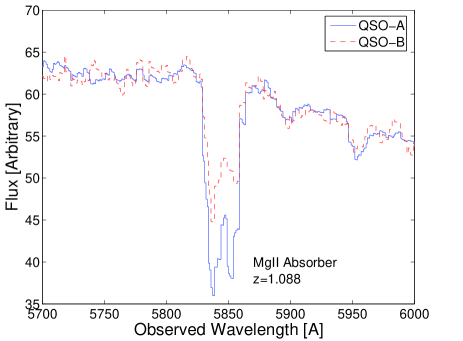
Q1017207: A doubly imaged quasar, with image separation, discovered by Claeskens et al. (1996). The quasar is at a redshift of and the fundamental-plane redshift of the lensing galaxy is (Kochanek et al. 2000). Due to limited S/N (only hr, of a requested hr exposure time, were actually obtained) we fail to identify the type or redshift of the lens galaxy. Claeskens et al. (1996) detected a Mg II absorber, with , in the combined spectra of the images, and suggested that it could be due to the lensing galaxy. Surdej et al. (1997) obtained HST Faint Object Spectrograph (FOS) spectra of both images and detected the Mg II absorber only in the spectrum of image A. In our VLT spectra, the Mg II absorber is apparent in both images, and we refine its redshift to (Fig. 11). The absorption equivalent widths are Å and Å (observed frame) for image A and B, respectively. After correcting for the expected contamination by image A, we estimate that the Mg II absorption equivalent width in image B is Å (observed frame). The correction was made by calculating the ratio between the blended flux of image B (in the Å range), to the expected flux of image A at the same cross-dispersion position, based on the point-spread-function wing of image A on the side opposite to image B. By inspecting the HST-FOS spectra (Fig. 2 in Surdej et al. 1997), we estimate that the S/N ratio of the VLT spectrum is times higher than that of the HST/FOS spectra. This may explain the absence of the Mg II absorber in image B in the HST/FOS spectra. If, as we suspect, the Mg II absorber is indeed present in the image B spectrum, the physical separation at the redshift of the absorber, about kpc, suggests that the absorber is a massive galaxy capable of being the lens.
Q13552257: A doubly imaged quasar, with image separation, discovered by Morgan et al. (2003). The quasar is at a redshift of . Based on the flux of the galaxy and the Faber-Jackson (1976) relation, Morgan et al. (2003) estimated that the lens galaxy lies in the redshift range , and suggested that the Mg II Å absorption feature at identified in their HST/FOS spectra of the system, could be associated with the lens galaxy. We note that our spectrum of quasar B, which would capture the most flux from the lens galaxy, shows an excess of emission relative to quasar A at wavelengths longward of Å (see Fig. 9). This roughly corresponds to the wavelength at which a galaxy would have its Å break.
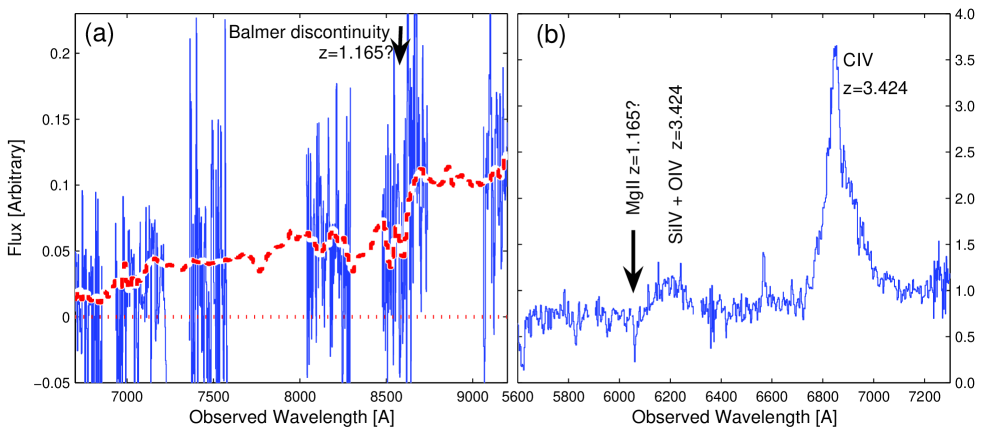
PMNJ1632003: A doubly imaged quasar, with image separation, discovered in radio frequencies by Winn et al. (2002b). The quasar is at a redshift of , and is the only quasar lensed by a galaxy for which the demagnified central image has been securely detected (Winn et al. 2004). The existence of the central image sets a lower limit on the galaxy’s surface density at the location of the central image. The spectrum of the lensing galaxy is noisy and we cannot confidently identify the redshift. However, as seen in Fig. 10-a, we detect a jump in the spectrum at Å. If attributed to the Balmer discontinuity, then an absorption line at Å in the QSO spectrum (Fig. 10-b) may be Mg II Å, and the galaxy redshift would be .
WFIJ2033472: A quadruply lensed quasar, discovered by Morgan et al. (2004). The quasar redshift is and the maximum image separation is . The lensing galaxy spectrum, shown in Fig. 8, is matched by an Sb and Sc galaxy template (mix ratio of ) with a redshift of . As in the cases of HE00471756 and HE02302130, above, the non-parallactic slit angle could lead to a change in slope of , and as before, this would likely be in the sense of making the object redder. Between the S0 and Sb/Sc templates, the slope in the 6000-8500 Å range changes by and therefore differential atmospheric refraction is unlikely to be the main cause of the blue color of the lens galaxy. The derived SIS velocity dispersion in this case is km s-1, corresponding to a massive elliptical or a galaxy group. As in the previous two cases, the spiral-galaxy-like slope and absorption features in the lens galaxy spectrum most probably do not indicate a spiral galaxy lens.
To summarize, we have obtained low resolution VLT/FORS2 optical spectra of gravitationally lensed quasar systems, and we have measured the redshifts of seven of the lensing galaxies. In three cases, the best spectral fits correspond to local spiral galaxy templates in terms of continuum shape and absorption feature depths. However, in all three cases we have argued that the lens galaxies are actually of early-type, based on the absence of emission lines, and on the large image separations that they produce, which are characteristic of massive ellipticals. In each case, we have also argued against a dominant observational source for the anomalous colors, and concluded that these early-type galaxies, as viewed at lookback times of Gyr, are intrinsically blue. Their observed spectra likely carry the traces of previous episodes of star formation. Our fairly high success rate in obtaining spectroscopic redshifts, shows that full redshift information can be gathered for most lensed quasar systems. As discussed in §1, this information will be useful for a host of cosmological applications.
References
- Abajas et al. (2002) Abajas, C., Mediavilla, E., Muñoz, J. A., Popović, L. Č., & Oscoz, A. 2002, ApJ, 576, 640
- Chae (2003) Chae, K. 2003, MNRAS, 346, 746
- Chae & Mao (2003) Chae, K., & Mao, S. 2003, ApJL, 599, L61
- Claeskens et al. (1996) Claeskens, J.-F., Surdej, J., & Remy, M. 1996, A&A, 305, L9
- Djorgovski & Davis (1987) Djorgovski, S., & Davis, M. 1987, ApJ, 313, 59
- Dressler et al. (1987) Dressler, A., Lynden-Bell, D., Burstein, D., Davies, R. L., Faber, S. M., Terlevich, R., & Wegner, G. 1987, ApJ, 313, 42
- Faber & Jackson (1976) Faber, S. M., & Jackson, R. E. 1976, ApJ, 204, 668
- Falco et al. (2001) Falco, E. E., et al. 2001, ASP Conf. Ser. 237: Gravitational Lensing: Recent Progress and Future Go, 237, 25
- Filippenko (1982) Filippenko, A. V. 1982, PASP, 94, 715
- Hall et al. (2002) Hall, P. B., Richards, G. T., York, D. G., Keeton, C. R., Bowen, D. V., Schneider, D. P., Schlegel, D. J., & Brinkmann, J. 2002, ApJL, 575, L51
- Hamana et al. (2005) Hamana, T., Ohyama, Y., Chiba, M., & Kashikawa, N. 2005, ArXiv Astrophysics e-prints, arXiv:astro-ph/0507056
- Hewett et al. (1994) Hewett, P. C., Irwin, M. J., Foltz, C. B., Harding, M. E., Corrigan, R. T., Webster, R. L., & Dinshaw, N. 1994, AJ, 108, 1534
- Inada et al. (2003) Inada, N., et al. 2003, AJ, 126, 666
- Kanekar & Briggs (2003) Kanekar, N., & Briggs, F. H. 2003, A&A, 412, L29
- Kaspi et al. (2000) Kaspi, S., Smith, P. S., Netzer, H., Maoz, D., Jannuzi, B. T., & Giveon, U. 2000, ApJ, 533, 631
- Kaspi et al. (2005) Kaspi, S., Maoz, D., Netzer, H., Peterson, B. M., Vestergaard, M., & Jannuzi, B. T. 2005, ApJ, 629, 61
- Keeton et al. (1998) Keeton, C. R., Kochanek, C. S., & Falco, E. E. 1998, ApJ, 509, 561
- Keeton (2001) Keeton, C. R. 2001, ApJ, 561, 46
- Keeton et al. (2005) Keeton, C. R., Burles, S., Schechter, P. L., & Wambsganss, J. 2005, ArXiv Astrophysics e-prints, arXiv:astro-ph/0507521
- Kinney et al. (1996) Kinney, A. L., Calzetti, D., Bohlin, R. C., McQuade, K., Storchi-Bergmann, T., & Schmitt, H. R. 1996, ApJ, 467, 38
- Kochanek et al. (2000) Kochanek, C. S., et al. 2000, ApJ, 543, 131
- Kochanek (2002) Kochanek, C. S. 2002, ApJ, 578, 25
- Kochanek (2004) Kochanek, C. S. 2004, ApJ, 605, 58
- Kochanek et al. (2005) Kochanek, C. S., Morgan, N. D., Falco, E. E., McLeod, B. A., Winn, J. N., Dembicky, J., & Ketzeback, B. 2005, ArXiv Astrophysics e-prints, arXiv:astro-ph/0508070
- Leitherer et al. (1999) Leitherer, C., et al. 1999, ApJS, 123, 3
- Lewis & Ibata (2004) Lewis, G. F., & Ibata, R. A. 2004, MNRAS, 348, 24
- Maoz (2005) Maoz, D. 2005, in ”Impact of Gravitational Lensing on Cosmology”, IAU Symposium 225, Eds. Y. Mellier and G. Meylan, (Cambridge: Cambridge University Press), p413
- Maoz & Rix (1993) Maoz, D., & Rix, H. 1993, ApJ, 416, 425
- McMahon & Irwin (1992) McMahon, R., & Irwin, M. 1992, GEMINI Newsletter Royal Greenwich Observatory, 36, 1
- Méndez et al. (2001) Méndez, R. H., Riffeser, A., Kudritzki, R.-P., Matthias, M., Freeman, K. C., Arnaboldi, M., Capaccioli, M., & Gerhard, O. E. 2001, ApJ, 563, 135
- Morgan et al. (2003) Morgan, N. D., Gregg, M. D., Wisotzki, L., Becker, R., Maza, J., Schechter, P. L., & White, R. L. 2003, AJ, 126, 696
- Morgan et al. (2004) Morgan, N. D., Caldwell, J. A. R., Schechter, P. L., Dressler, A., Egami, E., & Rix, H. 2004, AJ, 127, 2617
- Morgan et al. (2005) Morgan, N. D., Kochanek, C. S., Pevunova, O., & Schechter, P. L. 2005, AJ, 129, 2531
- Ofek et al. (2003) Ofek, E. O., Rix, H., & Maoz, D. 2003, MNRAS, 343, 639
- Pahre et al. (2001) Pahre, M. A., Djorgovski, S. G., & De Carvalho, R. R. 2001, Ap&SS, 276, 983
- Richards et al. (2004) Richards, G. T., et al. 2004, ApJ, 610, 679
- Rusin et al. (2003) Rusin, D., et al. 2003, ApJ, 587, 143
- Rusin & Kochanek (2005) Rusin, D., & Kochanek, C. S. 2005, ApJ, 623, 666
- Schechter & Wambsganss (2002) Schechter, P. L., & Wambsganss, J. 2002, ApJ, 580, 685
- Schlegel et al. (1998) Schlegel, D. J., Finkbeiner, D. P., & Davis, M. 1998, ApJ, 500, 525
- Storrie-Lombardi et al. (1996) Storrie-Lombardi, L. J., McMahon, R. G., Irwin, M. J., & Hazard, C. 1996, ApJ, 468, 121
- Surdej et al. (1997) Surdej, J., Claeskens, J.-F., Remy, M., Refsdal, S., Pirenne, B., Prieto, A., & Vanderriest, C. 1997, A&A, 327, L1
- Treu et al. (2002) Treu, T., Stiavelli, M., Casertano, S., Møller, P., & Bertin, G. 2002, ApJL, 564, L13
- Treu & Koopmans (2002) Treu, T., & Koopmans, L. V. E. 2002, MNRAS, 337, L6
- Treu & Koopmans (2004) Treu, T., & Koopmans, L. V. E. 2004, ApJ, 611, 739
- van Dokkum et al. (1998) van Dokkum, P. G., Franx, M., Kelson, D. D., & Illingworth, G. D. 1998, ApJL, 504, L17
- van Dokkum et al. (2001) van Dokkum, P. G., Franx, M., Kelson, D. D., & Illingworth, G. D. 2001, ApJL, 553, L39
- Winn et al. (2002a) Winn, J. N., et al. 2002a, AJ, 123, 10
- Winn et al. (2002b) Winn, J. N., Lovell, J. E. J., Chen, H., Fletcher, A. B., Hewitt, J. N., Patnaik, A. R., & Schechter, P. L. 2002b, ApJ, 564, 143
- Winn et al. (2004) Winn, J. N., Rusin, D., & Kochanek, C. S. 2004, Nature, 427, 613
- Wisotzki et al. (1999) Wisotzki, L., Christlieb, N., Liu, M. C., Maza, J., Morgan, N. D., & Schechter, P. L. 1999, A&A, 348, L41
- Wisotzki et al. (2000) Wisotzki, L., Christlieb, N., Bade, N., Beckmann, V., Köhler, T., Vanelle, C., & Reimers, D. 2000, A&A, 358, 77
- Wisotzki et al. (2002) Wisotzki, L., Schechter, P. L., Bradt, H. V., Heinmüller, J., & Reimers, D. 2002, A&A, 395, 17
- Wisotzki et al. (2004) Wisotzki, L., Schechter, P. L., Chen, H.-W., Richstone, D., Jahnke, K., Sánchez, S. F., & Reimers, D. 2004, A&A, 419, L31
- Witt et al. (2000) Witt, H. J., Mao, S., & Keeton, C. R. 2000, ApJ, 544, 98