2National Centre for Radio Astrophysics, Pune 411 007, India
Post-outburst radio observation of the region around McNeil’s nebula (V1647 Ori)
We present post-outburst ( 100 days after outburst) radio continuum observation of the region () around McNeil’s nebula (V1647 Orionis). The observations were carried out using the Giant Metrewave Radio Telescope (GMRT), India, at 1272 MHz on 2004 Feb 14.5 UT. Although 8 sources have been detected within a circular diameter of centred on V1647 Ori, we did not detect any radio continuum emission from McNeil’s nebula. We assign a upper limit of 0.15 mJy/beam for V1647 Ori where the beam size is . Even at higher frequencies of 4.9 and 8.5 GHz (VLA archival data), no radio emission has been detected from this region. Three scenarios namely, emission from homogeneous HII region, ionised stellar wind and shock ionised gas, are explored in the light of our GMRT upper-limit. For the case of homogeneous HII region, the radius of the emitting region is constrained to be AU corresponding to a temperature K, which is consistent with the reported radio and H emission. In the ionised stellar wind picture, our upper limit of radio emission translates to . On the other hand, if the stellar wind shocks the dense neutral (molecular) cloud, the radio upper limit implies that the fraction of the wind encountering the dense obstacle is %. Based on a recent measurement of X-ray outburst and later monitoring, the expected radio emission has been estimated. Using our radio limit, the radius ( AU) and electron density ( cm-3) of the radio emitting plasma have been constrained using a two phase medium in pressure equilibrium for a volume filling factor of 0.9.
Key Words.:
stars : formation – stars : individual : V1647 Orionis – radio continuum : stars – stars : circumstellar matter1 Introduction
J. W. McNeil, in January 2004, reported the presence of a new reflection nebula, now known as McNeil’s nebula, in the Lynds dark cloud 1630 in Orion B molecular complex (McNeil, 2004). McNeil’s nebula (V1647 Orionis) is at a distance of 400 pc (Anthony-Twarog, 1982) and is positionally coincident to the infrared source IRAS 05436-0007. Reipurth & Aspin (2004) presented the optical and near IR photometry of the source V1647 Ori (on 2004 Feb 14 and Feb 3 UT, respectively), and found that the star brightened by about 3 mag in the near infrared (J, H, K) with respect to 2MASS measurements (1998). The P-Cygni profile of the H line emission from the region around this source implies considerable mass loss in powerful winds with velocities reaching upto km s-1(Reipurth & Aspin, 2004). Briceño et al. (2004) constrained the epoch of the onset of the outburst to be within 28 Oct - 15 Nov, 2003 by means of I band images of this region. Optical and near infrared photometry of the exciting star, V1647 Ori, show that it is variable atop a general decline in brightness of about 0.3-0.4 mag in 87 days, between 2004, February 10 and May 7 (Walter et al., 2004). Vacca et al. (2004) have presented the near infrared spectroscopy at medium resolution of the McNeil’s nebular object after the outburst on March 9, 2004 UT. They suggest it to be a low mass Class I protostar with mass outflow () occuring in a dense ionised wind of velocity km s-1. Andrews et al. (2004) show that the 12 m flux of this source has increased by a factor of after the outburst whereas the submillimeter continuum is at the pre-outburst level.
Kastner et al. (2004) observed a surge in X-ray brightness coincident with the optical and near infrared eruption, and suggest that it could be due to a sudden onset of rapid accretion phase. More recent X-ray observations by Grosso et al. (2005) have led to detection of X-ray variability within a hour duration (2004 April 4). They conclude the soft X-rays to originate from accretion shock onto the photosphere of a low mass star and the harder component due to magnetic reconnection events. Enhanced accretion events from a circumstellar accretion disk are believed to be responsible for such outbursts in young stars. EX Lupi - like objects (EXors) and FU Orionis objects (FUors) are classes of optically variable young stellar objects associated with eruptions. EXor eruptions are generally shorter (few months to a few years) as compared to FUor brightenings (which last many decades). While Walter et al. (2004) suggest that the McNeil’s nebula is an FUor like outburst, McGehee et al. (2004) from optical and near infrared measurements infer that the brightening is suggestive of EXor like outburst. Ábrahám et al. (2004) compiled the infrared-submm-mm spectral energy distribution of the outburst star in its quiescent phase and find that it resembles those of FUor objects indicating the presence of circumstellar envelope. Ojha et al. (2005) have presented the short time variability as well as near infrared morphology of the McNeil’s nebula and showed a significant variation in the source brightness ( mag) within a period of one week. More recently, Rettig et al. (2005) have presented high resolution infrared spectra of V1647 Ori. They suggest that the CO emission lines are likely to originate from K gas in the inner accretion disk region.
Young stellar objects in their pre-main sequence stage generally have very weak radio emission. Although Br and H lines, which trace the hot ionised gas, have already been detected in McNeil’s nebula, no radio study exists in literature. Hence, we carried out radio observations of McNeil’s nebula on 2004 Feb 14 UT ( days after the first announcement by McNeil on 2004 Jan 23 UT; days after the outburst as inferred by Briceño et al., 2004) using the Target of Opportunity (ToO) allocation of the observing time on the Giant Metrewave Radio Telescope (GMRT). In this paper, we present the radio measurement of the region around McNeil’s nebula, carried out at 1272 MHz. We explore three possible scenarios to understand the radio emission each involving thermal bremstrahlung from the ionised gas. Section 2 describes the observations and data reduction. While Section 3 gives the results; in Section 4, radio emission from three scenarios, viz. homogeneous HII region, ionised stellar wind and shock ionised region have been considered. Physical constraints on the emitting region based on radio and other available measurements (H and X-ray) have also been discussed in this section. In Section 5, we present our conclusions.
2 Observations and Data reduction
The radio continuum interferometric observations of V1647 Ori were carried out at 1272 MHz on 2004, Feb 14.5 UT using the GMRT located at Khodad (19∘ N, 74∘ E) in India. GMRT has a “Y” shaped hybrid configuration of 30 antennas, each antenna of 45-m diameter. Of the 30 antennas, six each are placed along the east, west and south arms (arm length km). The longest interferometric baseline among the most distant antennas is about 25 km. The remaining twelve are located randomly in a compact km2 at the center (Swarup et al., 1991). The phase center of the observations was (,)2000 = ( , -00∘ 05′ 48′′), close to the centre of the diffuse optical emission (Reipurth & Aspin, 2004). The total duration of the observations was 3 hours. The standard flux calibrator 3C48 was observed at the beginning and end of the observations. The QSO B0500+019 was used for phase calibration. The continuum observations were carried out with 16 MHz bandwidth.
NRAO Astronomical Image Processing System (AIPS) was used for the reduction of data. Before analysing the data, it was carefully checked for radio interference and other instrumental problems and the corrupted data were removed. The amplitude and phase calibrated data were Fourier transformed to make images which are then deconvolved using the IMAGR task in AIPS. This task uses the CLEAN algorithm. The sky was approximated by a 2-dimensional plane ( from phase center) close to the phase tracking center. However, since a region of has been considered, a number of such 2-dimensional fields have been considered for the Fourier transformation and deconvolution. These fields were projected to a single tangent plane on the phase center using the AIPS task FLATN. Self calibration was carried out using the task CALIB to fix the final phases and obtain the improved final maps. Considering that a region larger than the primary beam () has been cleaned, the task PBCOR has been used to apply the primary beam correction to the image. For the sources detected in the radio map, the peak position as well as the flux densities (peak and integrated) were obtained using the task JMFITS in AIPS.
We have also analysed the data for V1647 Ori at 4.9 and 8.5 GHz taken from the NRAO Data Archive111The National Radio Astronomy Observatory is a facility of the National Science Foundation operated under cooperative agreement by Associated Universities, Inc. obtained using the Very Large Array (VLA) in the B/C configuration. The observation was carried out on March 05, 2005. Since the VLA datasets did not include any of the standard flux calibrators, the VLA phase calibrator, 0541-056, itself was used for both the phase as well as flux calibration. A method of analysis, in AIPS, similar to that described above was used for the reduction of this data.
3 Results
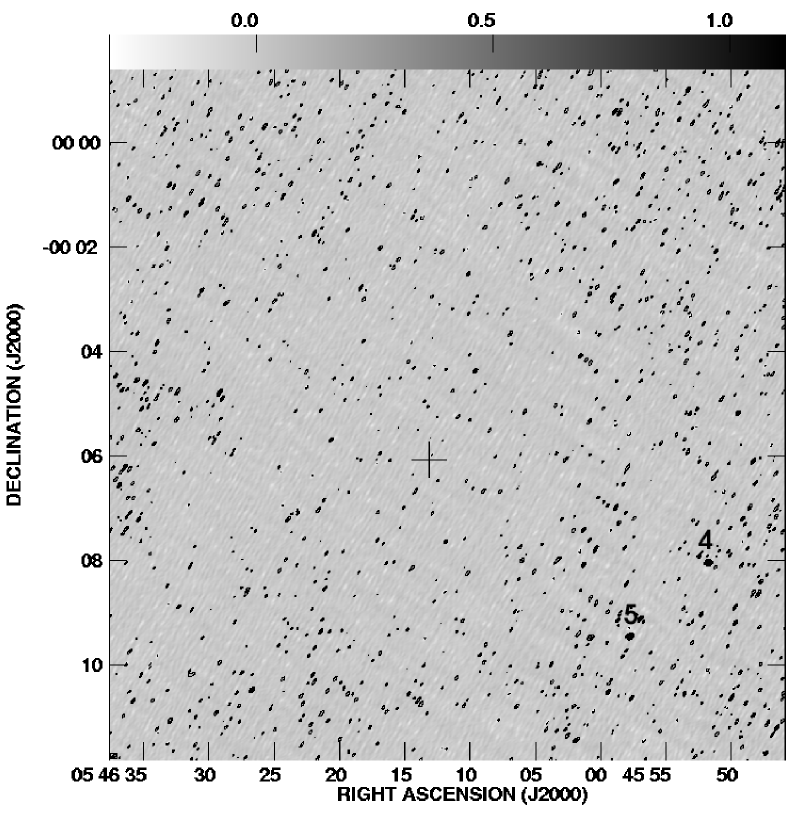
A map of nearly region at 1272 MHz has been generated, centred on V1647 Ori. Emission from a part of this region () around V1647 Ori is shown in Fig 1. The position of V1647 Ori is marked by a ‘’ symbol. The synthesized beam size is with position angle = – 48.9∘ (FWHM along the major axis corresponds to AU for pc). The rms noise in our map is Jy/beam. No radio emission has been detected in our map at the location of V1647 Ori or around () it. We place a fairly strict 5 upper limit of mJy/beam for the radio emission from this source. Away from the McNeil’s nebular region, eight radio sources were clearly detected in the map. The coordinates as well as the integrated flux densities of these sources are presented in Table 1. The integrated flux densities of the sources are in the range 0.94 - 8.42 mJy. At this bright level, there are several sources detected by the NRAO VLA Sky Survey (NVSS) at 1400 MHz, which have also been listed in Table 1. Seven of the eight sources detected by us in a circular region of diameter 25′ appear in the NVSS catalog. The faintest one among the sources detected in our image, labelled by identification number 4 in Fig 1, does not appear in the NVSS catalog. The separations in the positions of these sources between our GMRT map and the NVSS catalog are in the range of 1.8′′ - 5.2′′ which is reasonable considering the larger synthesized beam for NVSS (). The identification (ID) numbers of the sources (Table 1) have been used to label them in Fig 1.
Maps of the region around V1647 Ori at 4.9 and 8.5 GHz were generated using the VLA data. The rms noise in the maps were 25 and 18 Jy/beam and the synthesized beam sizes are and at 4.9 and 8.5 GHz, respectively. No radio emission has been detected at the position of V1647 Ori in these maps at either frequency and we place 5 upper limits of 125 and 90 Jy/beam at 4.9 and 8.5 GHz, respectively. In what follows, the limit obtained from GMRT measurements has been used to quantitatively constrain the physical parameters of the region around V1647 Ori. The upper limits at 4.9 and 8.5 GHz could be uncertain by a factor upto and , respectively, due to variability of the calibrator (Tornikoski et al. 2001). In spite of this, the limits at higher frequencies from VLA would also support similar conclusions based on limits at 1272 MHz.
4 Discussion
Next, we explore possible scenarios and discuss the implications of our upper limit on radio emission from V1647 Ori. It is believed that the source of outburst, V1647 Ori, is a very young low mass stellar object (Vacca et al., 2004; Ábrahám et al., 2004). In the literature, a number of suggestions have been made about radio emission from embedded low-mass young stellar objects (Gibb, 1999).
The radio emission could arise from (a) shocks in Herbig-Haro flows (Curiel et al., 1993), (b) ionised stellar wind/jet (Martin, 1996) (c) ionised region surrounding a protostellar accretion shock (Neufield & Hollenbach, 1996), or (d) magnetic fields close to the star giving rise to star-disk interaction (André, 1996). For V1647 Ori, we explore the possibilities of thermal radio emission from homogeneous HII region, ionised stellar winds and shocks by outflows.
4.1 Homogeneous HII region
Here, we consider radio emission from a homogeneous HII region around the young stellar object V1647 Ori. In this scenario, we assume that the radio emitting region is (i) spherically symmetric and of constant density, (ii) pure hydrogen and dust free, (iii) isothermal, (iv) identical to the H emitting region and optically thin in H (case A of Osterbrock, 1989). The measured H emission and the radio upper limit are used to constrain physical parameters like density and size of the emitting region for an assumed temperature. In the case of a low-mass stellar object like V1647 Ori, a possible source of ionising radiation (ultraviolet photons) could be from the boundary layer between the stellar surface and the accretion disk (Hartmann, 1998).
Using the normalised H profile of V1647 Ori obtained by Walters et al. (2004) on Feb 13, 2004, from a slit whose smaller side corresponds to 600 AU ( pc) and their calibrated photometry in the B, V, R and I bands, we obtain the peak of the H emission to be erg cm-2 s. The total integrated and dereddened H emission from the slit using (from Vacca et al., 2004) and the extinction law of Rieke & Lebofsky (1985) is 4.2 erg cm-2 s-1. According to Retigg et al. (2005), the temperature of the gas in the inner accretion disk of V1647 Ori is K based on the CO emission lines in the infrared. Vacca et al. (2004) interpret the Brackett transitions to be emitted from a gas of temperature 10,000 K. We, therefore, consider temperatures of 2,500 K, 5,000 K and 10,000 K for our discussion here. For various radii of the emitting region, we determine the electron densities consistent with the measured H emission using the recombination coefficients given by Osterbrock (1989). These electron densities have been used to determine the total radio flux at 1272 MHz using the formulation of Spitzer (1978).
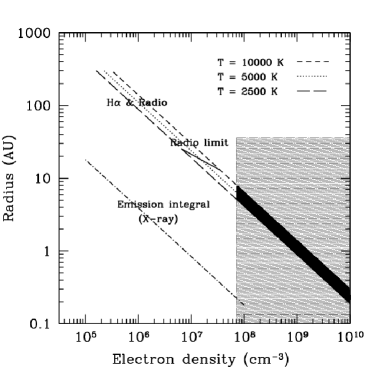
Fig 2 shows the relation between electron density and various radii of the emitting region (in AU). These curves, labelled as ‘H and Radio’ in the figure, are presented for three temperatures K - K. The solid line intersecting the curves for different temperatures represents the radio flux limit of 150 Jy. The region below this line and along the curves represents the allowed parameter space. Here, for a given temperature, the pair of radius and electron density gives rise to consistent values of H emission and radio upper limit. The solid line corresponds to an emitting region (radius) of 13-26 AU for 10,000 K - 2,500 K. For the same temperature range, the electron densities vary as cm cm-3, respectively.
4.2 Ionised stellar wind
We next explore radio emission from an ionised stellar wind. There is an indication of strong stellar winds from the outburst source V1647 Ori (P-Cygni profiles observed in the H line; Vacca et al. 2004). The radio emission from ionised stellar winds of young stellar objects has been discussed by Panagia (1991). Under the simplistic assumptions that the stellar wind is (a) fully ionised, (b) spherically symmetric with constant mass-loss rate and velocity, (c) isothermal with the temperature of stellar wind being the same as that of stellar photosphere, and (d) is in quasi-LTE conditions, the monochromatic radio flux density is given by (Panagia & Felli, 1975)
where is the expected radio flux density at frequency from the ionised stellar wind, is the temperature, is the mass-loss rate, is the terminal velocity of the stellar wind, and is the distance to the source. Temperatures of isothermal stellar winds vary between K to K for stars of mass 1 (Lamers and Cassinelli, 1999). For this temperature range, our upper limit of radio emission implies the ratio of mass-loss rate to velocity of the stellar wind, (), to be . Using the inferred mass-loss rate () and wind velocity ( km s-1) from the P-Cygni profile of the H emission by Vacca et al., (2004), we find that , which is consistent with our upper limit.
In order to explain the H measurement (Section 4.1) for K and using the density determined from the mass-loss rate of a spherical stellar wind close to the stellar surface for a 1 star, the emission should be in the form of an extremely narrow bipolar flow of solid angle sr, which appears unphysical.
4.3 Shock-ionised Gas
We consider shocks by outflows as a possible source of radio emission from V1647 Ori although the near infrared (H2) and optical ([SII]) studies by Reipurth & Aspin (2004) and Vacca et al. (2004) showed no evidence of shocked gas. In addition, the star associated with McNeil’s nebula was proposed as the exciting source of HH23 (Eislöffel & Mundt 1997; Kastner et al. 2004). Shocks could form due to a supersonic stellar wind impinging upon a dense clump of gas in the flow close to the exciting source (Hartigan et al. 1987). Fast shocks (shock velocity km s-1) due to winds from young stellar objects into molecular clouds are a potential source of free-free radio emission since the shock energy ionises the compressed gas. If a stellar wind with a mass-loss rate of and terminal velocity is shocked due to the presence of an obstacle such as a molecular cloud, then the radio continuum flux density, , in the optically thin limit is given by (Curiel et al., 1989)
where represents the geometrical fraction of the stellar wind that is shocked, is the distance to the source, is the temperature and is the frequency. For a temperature of K, and using the values of distance, mass-loss rate and velocity of stellar wind of V1647 Ori given in Section 4.2, we find that the expected radio flux is Jy. Hence, our limit implies that if the shocked ionised gas is responsible for the radio emission, the fraction of the wind encountering the dense molecular obstacle is %.
4.4 X-ray measurements and its implications
Recently, an X-ray outburst has been detected from V1647 Ori, which illuminates the McNeil’s nebula, by Kastner et al. (2004) based on their observations using the Chandra satellite. Their reported observations correspond to three epochs (14 Nov. 2002, 7 March 2004 and 22 March 2004) showing quiescent (LOW), outburst (HIGH) and post-outburst emission. Thereafter Grosso et al., 2005, have detected enhanced X-ray variability from a long integration using the XMM-Newton satellite on 4 April 2004. Kastner et al (2004) have modelled their observations and concluded that the plasma responsible for the X-ray emission during the HIGH state is characterised by a temperature K and X-ray luminosity erg s-1. The corresponding values for and during the LOW state are K and erg s-1 respectively. The XMM-Newton data imply slightly different values ( K, K, erg s-1; Grosso et al.). They propose that while the soft X-rays could originate from accretion shock onto the photosphere of a low mass star, the harder component is likely to be due to magnetic reconnection events. Here, we consider the implications on expected radio emission at 1272 MHz based on the Chandra measurements.
The X-ray emission from hot plasmas are well quantified in terms of “band cooling coefficients” in different energy ranges as a function of temperature. We have used the band cooling coefficients calculated by Raymond, Cox & Smith (1976). Considering the Chandra X-ray band to be 0.5–8 keV, we obtain the emission integral, (where is the electron density and is the volume occupied by the plasma), to be cm-3 during the LOW state and cm-3during the HIGH state. Assuming a spherical emitting region of constant density, the above values constrain the radius, and for the HIGH state as shown by a dash-dotted line in Fig 2.
We estimate the expected radio emission from the X-ray emitting plasma, assuming it to be optically thin, following Spitzer (1978). They are 0.01 and 0.05 Jy corresponding to the LOW and HIGH states respectively (for pc). These values are much smaller than (and hence consistent with) our upper limit at 1272 MHz. In case the assumption of optical thinness does not hold, then the emission would be even lower.
Next, we consider the hot plasma to be clumpy with two components in pressure equilibrium, the hotter component (electron density , temperature ) responsible for the X-ray emission and the other (, ) component for the radio. The pressure equilibrium implies . Let the volume filling factor for the hotter component be . If , then . Assuming = 5,000 K, we estimate the for the radio emitting gas corresponding to both the states, which we translate to radio flux density for optically thin case. The values turn out to be rather large, viz., and Jy corresponding to LOW and HIGH states respectively. Both are much larger than our limit of 150 Jy. If the non-detection of V1647 Ori at 1272 MHz is purely due to optical depth effects, we can constrain the size, , and density, , of the radio emitting phase using the upper limit in this two phase plasma scenario. We find AU and cm-3 ( cm-3) for LOW (HIGH) state corresponding to a volume filling factor, , which is depicted in Fig 2 by the striped region.
In ionised stellar wind picture, the X-ray emission considering that (i) the X-ray luminosity is dominated by the free-free emission of hydrogen (ii) K, and (iii) density determined from mass-loss rate of a spherical stellar wind close to the stellar surface for a 1 star, is erg s-1; much lower than that measured by .
In Section 4.3, we have considered shocked gas as a source of radio emission. Here, we extract physical parameters of this scenario from the X-ray measurements using the prescription of Raga et al. (2002). In this scheme, a bow shock is created at a thin surface near the apex of a dense, approximately spherical obstacle of radius which emits X-ray of luminosity, , given by
Here, is the pre-shock number density and is the shock velocity. Taking the X-ray luminosity of V1647 Ori from measurements (Section 4.4) and km s-1, we obtain the size of the X-ray emitting shocked region as a function of . This variation of density with for the LOW and HIGH states is shown in Fig 3.
5 Conclusions
In the present study, three scenarios have been explored to explain the radio, H and X-ray measurements of McNeil’s nebula. For the case of homogeneous HII region, the size of the emitting region and the electron density must lie in the dark-shaded region of Fig 2 ( K) in order to be consistent with all the three measurements. A typical solution would be for T K and cm-3; the size and radio flux are then given by AU and 19 Jy, respectively. In the ionised stellar wind picture, the expected X-ray emission is very small. The H measurement also cannot be explained in this scenario. The shocked gas picture can be consistent with X-ray measurements provided the pre-shock number density and the radius of the dense spherical obstacle fall near the curves shown in Fig 3. However, for these parameters, the H measurement cannot be explained.
Although we have considered extremely simple pictures under idealized assumptions, we conclude that the homogeneous HII region scenario explains the radio, H as well as X-ray measurements consistently while the ionised stellar wind and shocked gas pictures do not. For the latter two scenarios, we cannot rule out the possibility that these emissions (radio, X-ray and H) are at different length scales. However, in that case, the physical connection implied by the outburst and time variability in all three wavebands will remain unexplained.
Acknowledgements.
We thank the anonymous referee for many useful suggestions which have improved the paper. We thank the Centre Director, NCRA-TIFR and members of the Target of Opportunity (ToO) time allotment committee for making time available for our observations. We thank the staff of the GMRT who have made the radio observations possible. GMRT is run by the National Centre for Radio Astrophysics of the Tata Institute of Fundamental Research.| GMRT | NVSS | Separationa | ||||||
| ID no. | RA (J2000) | Dec(2000) | Int flux | RA(J2000) | Dec (J2000) | Int flux | ||
| h m s | ∘ ′ ′′ | mJy | h m s | ∘ ′ ′′ | mJy | ′′ | ′′ | |
| 1 | 05 45 27.26 | -00 05 47.7 | 2.55 | 05 45 27.46 | -00 05 47.6 | 7.5 | -3.0 | -0.1 |
| 2 | 05 45 39.42 | 00 05 00.2 | 8.41 | 05 45 39.64 | +00 04 58.1 | 23.9 | -3.3 | 2.1 |
| 3 | 05 45 43.93 | -00 13 56.5 | 2.24 | 05 45 43.94 | -00 14 00.1 | 2.9 | -0.15 | 3.6 |
| 4 | 05 45 51.72 | -00 08 03.0 | 0.94 | - | - | - | - | - |
| 5 | 05 45 57.71 | -00 09 27.8 | 1.24 | 05 45 57.49 | -00 09 24.5 | 2.6 | 3.3 | -3.3 |
| 6 | 05 46 29.53 | -00 19 41.4 | 4.88 | 05 46 29.80 | -00 19 44.4 | 15.5 | -4.1 | 3.0 |
| 7 | 05 46 40.76 | -00 18 23.8 | 8.42 | 05 46 40.80 | -00 18 25.5 | 12.0 | -0.6 | 1.7 |
| 8 | 05 46 43.98 | 00 01 41.7 | 4.59 | 05 46 44.07 | +00 01 44.8 | 5.9 | -1.4 | -3.1 |
aGMRT - NVSS
References
- (1) Ábrahám, P., Kóspál, Á., Csizmadia, Sz., Moór, A., Kun, M. & Stringfellow, G., 2004, A&A, 419, L39
- (2) André, P., 1996, ASP Conf. Ser. Vol. 93, eds. Taylor A. R., Paredes, J. M., p273
- (3) Andrews, S. M., Rothberg, B. & Simon, T., 2004, ApJ, 610, L45
- (4) Anthony-Twarog, B. J., 1982, AJ, 87, 1213
- (5) Briceño, C., Vivas, A. K., Hernández, J. Calvet, N., Hartmann, L., Megeath, T., Berlind, P., Calkins, M. & Hoyer, S., 2004, ApJ, 606, L123
- (6) Curiel, S., Rodriguez, L. F., Canto, J., Bohigas, J., Roth, M. & Torrelles, J. M., 1989, Astro. Lett. and Comm., 27, 299
- (7) Curiel, S., Rodriguez, L. F., Moran, J. M. & Canto, J., 1993, ApJ, 415, 191
- (8) Eislöffel, J. & Mundt, R., 1997, AJ, 114, 280
- (9) Gibb, A. G., 1999, MNRAS, 304, 1
- (10) Grosso, N., Kastner, J. H., Ozawa, H., Richmond, M., Simon, T., Weintraub, D. A., Hamaguchi, K. & Frank, A., 2005, astro-ph 0504111
- (11) Hartigan, P., Raymond, J. & Hartmann, L., 1987, ApJ, 316, 323
- (12) Hartmann, L., 1998, Accretion processes in star formation, Cambridge University Press
- (13) Kastner, J. H., Richmond, M., Grosso, N., Weintraub, D. A., Simon, T., Frank, A., Hamaguchi, K., Ozawa, H. & Henden, A., 2004, Nature, 430, 429
- (14) Lamers, H. J. G. L. M. & Cassinelli, J. P., 1999, Introduction to Stellar Winds, Cambridge University Press
- (15) Martin, S. C., 1996, ApJ, 473, 1051
- (16) McGehee, P. M., Smith, J. A., Henden, A. A., Richmond, M. W., Knapp, G. R., Finkbeiner, D. P., Ivezić, Z. & Brinkmann, J., 2004, ApJ, 616, 1058
- (17) McNeil, J. W., 2004, IAU Circ, 8284
- (18) Neufield, D. A. & Hollenbach, D. J., 1996, ApJ, 471, L45
- (19) Ojha, D. K., Kusakabe, N., Tamura, M., Nakajima, Y., Fukagawa, M., Sugitani, K., Baba, D., Kato, D., Kurita, M., Nagashima, C. et al. 2005, PASJ, 57, 203
- (20) Osterbrock, D. E., 1989, Astrophysics of gaseous nebulae and active galactic nuclei, University Science Books
- (21) Panagia, N. & Felli, M., 1975, A&A, 39, 1
- (22) Panagia, N., 1991, The Physics of Star Formation and Early Stellar Evolution, p565, (eds.) C. J. Lada & N. D. Kylafis, Kluwer Academic Publishers.
- (23) Raga, A. C., Noriega-Crespo, A. & Velázquez, P. F., 2002, ApJ, 576, L149
- (24) Raymond, J. C., Cox, D.P., & Smith, B. W., 1976, ApJ 204, 290
- (25) Reipurth, B. & Aspin, C., 2004, ApJ, 606, L119
- (26) Rettig, T. W., Brittain, S. D., Gibb, E. L., Simon, T. & Kulesa, C., 2005, ApJ, 626, 245
- (27) Rieke, G. H. & Lebofsky, M. J., 1985, ApJ, 288, 618
- (28) Spitzer, L. J., 1978, Physical processes in the interstellar medium, John Wiley Publications
- (29) Swarup, G., Ananthakrishnan, S., Kapahi, V. K., Rao, A. P., Subrahmanya, C. R. & Kulkarni, V. K., 1991, Current Science, 60, 95
- (30) Tornikoski, M., Jussila, I., Johansson, P., Leinela, M. & Valtaoja, E., 2001, AJ, 121, 1306
- (31) Vacca, W. D., Cushing, M. C. & Simon, T., 2004, ApJ, 609, L29
- (32) Walter, F. M., Stringfellow, G. Y., Sherry, W. H. & Field-Pollatou, A., 2004, AJ, 128, 1872