ULTRACAM photometry of the eclipsing cataclysmic variables GY Cnc, IR Com and HT Cas
Abstract
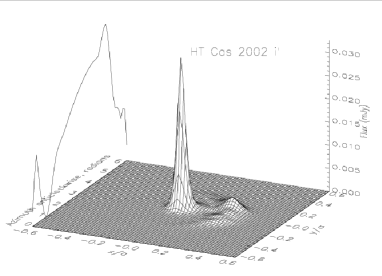
We present high-speed, three-colour photometry of the eclipsing cataclysmic variables GY Cnc, IR Com and HT Cas. We find that the sharp eclipses in GY Cnc and IR Com are due to eclipses of the white dwarf. There is some evidence for a bright spot on the edge of the accretion disc in GY Cnc, but not in IR Com. Eclipse mapping of HT Cas is presented which shows changes in the structure of the quiescent accretion disc. Observations in 2002 show the accretion disc to be invisible except for the presence of a bright spot at the disc edge. 2003 observations, however, clearly show a bright inner disc and the bright spot to be much fainter than in 2002. Although no outburst was associated with either set of quiescent observations, the system was mJy brighter in 2003, mainly due to the enhanced emission from the inner disc. We propose that these changes are due to variations in the mass transfer rate from the secondary star and through the disc. The disc colours indicate that it is optically thin in both its inner and outer regions. We estimate the white dwarf temperature of HT Cas to be K in 2002 and K in 2003.
keywords:
binaries: eclipsing – stars: dwarf novae – stars: individual: GY Cnc – stars: individual: IR Com – stars: individual: HT Cas – novae: cataclysmic variables| Target | UT date | Cycle | Filters | Exposure | No. of | No. of | Seeing |
|---|---|---|---|---|---|---|---|
| (start of night) | time (s) | frames | eclipses | (arcsec) | |||
| GY Cnc | 2003 May 19 | 6826 | u′g′z′ | 2.1 | 2256 | 1 | |
| GY Cnc | 2003 May 23 | 6849 | u′g′i′ | 1.6 | 2150 | 1 | 1.0 |
| IR Com | 2003 May 21 | 37857 | u′g′i′ | 3.2 | 676 | 1 | 1.0 |
| IR Com | 2003 May 23 | 37880 | u′g′i′ | 3.2 | 720 | 1 | 1.0 |
| IR Com | 2003 May 25 | 37902 | u′g′i′ | 3.2 | 901 | 1 | 1.5 |
| HT Cas | 2002 Sep. 13 | 119537 | u′g′i′ | 1.1 | 5651 | 1 | 1.2 |
| HT Cas | 2002 Sep. 14 | 119550 | u′g′i′ | 0.97–1.1 | 5470 | 1 | 1.3–2.3 |
| HT Cas | 2003 Oct. 29 | 125116 | u′g′i′ | 1.3 | 4659 | 1 | 1.4 |
| HT Cas | 2003 Oct. 30 | 125129–30 | u′g′i′ | 1.3 | 6930 | 2 | 1.0–1.5 |
1 Introduction
Cataclysmic variable stars (CVs) are a type of close binary system in which the white dwarf primary star (of mass ) accretes matter from the secondary star (of mass ), usually a cool main-sequence star. This accretion occurs via a ballistic gas stream originating from the inner Lagrangian (L1) point and an accretion disc surrounding the primary. A ‘bright spot’ is frequently formed at the point of impact of the gas stream and accretion disc. Foreshortening of this feature gives rise to an orbital hump in the light curve as the bright spot rotates into view.
If the rate of mass transfer into the disc is greater than the rate of flow of material through the disc, matter will build up in the disc until a critical density is reached, whereupon a thermal instability (Osaki, 1974; Meyer & Meyer-Hofmeister, 1981; Smak, 1982, 1984; Faulkner & Lin, 1983; Mineshige & Osaki, 1983) causes the disc viscosity to greatly increase, resulting in a huge rise in the rate of mass transfer through the disc. The result is an increase in the system brightness of between two and five magnitudes, known as a dwarf nova eruption, the presence of which defines the sub-class of CVs known as the dwarf novae. This disc instability model has been reviewed several times (e.g. Osaki, 1996; Lasota, 2001). For an excellent review of CVs in general, see Warner (1995).
The light curves of eclipsing CVs reveal a wealth of information about these objects. Successive eclipses of the white dwarf, bright spot and accretion disc by the secondary star can be used to determine the system parameters to a high degree of accuracy (see, for example, Feline et al. 2004a,b,c). Spatial structure in the accretion disc can be directly determined from observations using the eclipse mapping technique developed by Horne (1985) and recently reviewed by Baptista (2001).
GY Cnc (= RX J0909.8+1849 = HS 0907+1902) is a eclipsing dwarf nova with an orbital period hr. GY Cnc was detected in both the Hamburg Schmidt objective prism survey (Hagen et al., 1995) and the ROSAT Bright Source catalogue (Voges et al., 1999), and identified as a possible CV by Bade et al. (1998). Spectroscopic and photometric follow-up observations by Gänsicke et al. (2000) confirmed the status of GY Cnc as an eclipsing dwarf nova by detecting it in both outburst and quiescence. Shafter et al. (2000) used multi-colour photometric observations of GY Cnc to determine the temperatures of the white dwarf, bright spot and accretion disc and the disc power-law temperature exponent, which they found to be largely independent of the mass ratio assumed. Spectroscopic and photometric observations obtained by Thorstensen (2000) constrain the mass ratio and the orbital inclination (after applying corrections to the radial velocity of the secondary star ). The spectral type of the secondary star has been estimated as M (Gänsicke et al., 2000; Thorstensen, 2000). GY Cnc was observed during decline from outburst in 2001 November by Kato, Ishioka & Uemura (2002b), who suggest that GY Cnc is an “above-the-gap counterpart” to the dwarf nova HT Cas.
IR Com (= S 10932 Com) was discovered as the optical counterpart to the ROSAT X-ray source RX J1239.5 (Richter & Greiner, 1995). IR Com exhibits high (16.5 mag) and low (18.5 mag) brightness states (Richter & Greiner, 1995; Richter et al., 1997), with outburst amplitudes of mag (Richter et al. 1997; Kato, Baba & Nogami 2002a). Wenzel, Richter & Luthardt (1995) detected eclipses in the light curve of IR Com and determined an orbital period of 2.1 hr, just below the period gap. Richter et al. (1997) present photometric and spectroscopic observations of IR Com, which illustrate the highly variable nature of the target. Kato et al. (2002a) reported observations of IR Com at, and during, the decline from outburst. None of the published light curves of IR Com show much evidence for the presence of an orbital hump in the light curve before eclipse, or for asymmetry of the eclipse itself (although the limited time-resolution of the observations may mask such asymmetries to an extent). Kato et al. (2002a) again suggest that IR Com is a twin of HT Cas.
HT Cas is a well-known and well-studied faint eclipsing dwarf nova. It has a quiescent magnitude of and an orbital period of 1.77 hr. The literature on HT Cas is extensive; here we only discuss a selection of relevant work. The system parameters of HT Cas have been well-determined by Horne, Wood & Steining (1991) using simultaneous U, B, V and R observations in conjunction with those of Patterson (1981): and . In a companion paper, Wood, Horne & Vennes (1992) determined the temperature of the white dwarf ( K) and estimated the distance to the system ( pc). They also eclipse-mapped the accretion disc, illustrating the flat radial temperature profile typical of quiescent dwarf novae. Vrielmann, Hessman & Horne (2002) have recently reconstructed the temperatures and surface densities of the quiescent accretion disc of HT Cas using physical parameter eclipse mapping. This method also yields an estimate of the distance, pc. Marsh (1990) detected the secondary star in HT Cas using low-resolution spectra, estimating the spectral type as M. Marsh (1990) found the secondary star to be consistent with main-sequence values for the mass, radius and luminosity. Robertson & Honeycutt (1996) discuss the long-term quiescent light curve of HT Cas, with particular regard to the (unusual) presence of high- and low-states (at 16.4 and 17.7 mag). Wood et al. (1995) detected an X-ray eclipse of HT Cas using ROSAT observations during one of the system’s low-luminosity states. The X-rays are believed to originate in a boundary layer between the white dwarf and inner accretion disc.
In this paper, we present light curves of GY Cnc, IR Com and HT Cas, obtained with ULTRACAM, an ultra-fast, triple-beam CCD camera; for more details see Dhillon & Marsh (2001) and Dhillon et al. (in preparation). Our data for GY Cnc and IR Com are of the highest time-resolution yet obtained, and are the first simultaneous, three-colour light curves for these objects. We present eclipse maps of HT Cas in quiescence in 2002 and 2003, which show distinct changes in the structure of the accretion disc which are related to the overall brightness of the system.
 |
 |
 |
2 Observations
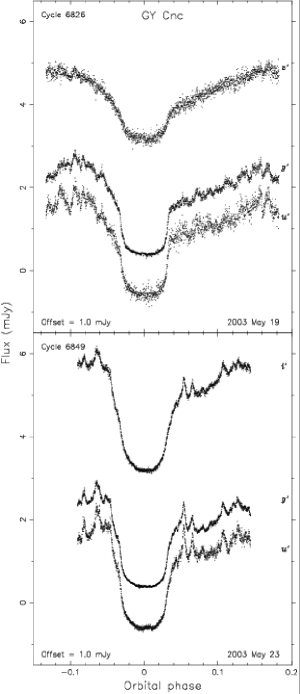
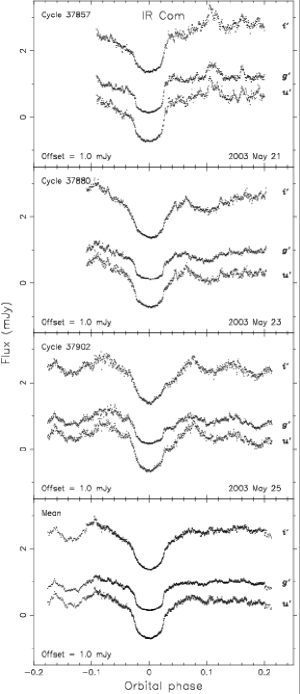
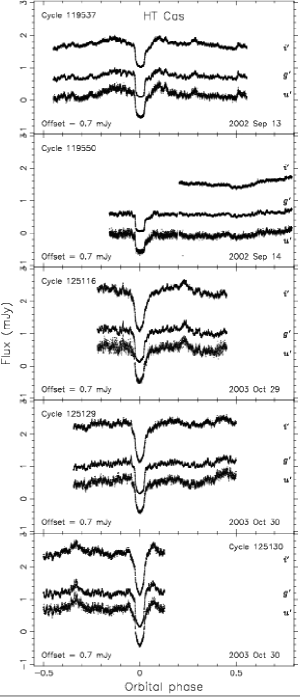
GY Cnc, IR Com and HT Cas were observed using ULTRACAM (Dhillon & Marsh 2001; Dhillon et al., in preparation) on the 4.2-m William Herschel Telescope (WHT) at the Isaac Newton Group of Telescopes, La Palma. The data were obtained in three colour bands simultaneously. The observations are summarised in Table 1. Data reduction was carried out as described in Feline et al. (2004b,c) using the ULTRACAM pipeline data reduction software. All HJD times quoted are UTC corrected to the heliocentre (i.e. not TDB). The resulting light curves of GY Cnc, IR Com and HT Cas are shown in Fig. 1.
3 Orbital ephemerides
The times of white dwarf mid-ingress and mid-egress were determined by locating the times when the minimum and maximum values, respectively, of the light curve derivative occurred (Wood, Irwin & Pringle, 1985). The times of mid-eclipse given in Table 2 were determined by assuming the white dwarf eclipse to be symmetric around phase zero and taking . If the sharp eclipse is caused by the obscuration of the bright spot rather than the white dwarf, then phase zero, as defined by the ephemerides below, may not necessarily correspond to the conjunction of the white and red dwarf components. As discussed in sections 4–6, however, it is probable that the sharp eclipse in all three objects (and certainly HT Cas) is of the white dwarf.
The orbital ephemeris of GY Cnc was determined using the seven eclipse timings of Gänsicke et al. (2000), the eight timings of Shafter et al. (2000), the seven timings of Kato et al. (2000), the two timings of Vanmunster (2000), the four timings of Kato et al. (2002b) and the six ULTRACAM timings determined in this paper and given in Table 2. Errors adopted were days for the data of Gänsicke et al. (2000) and Shafter et al. (2000), days for the data of Kato et al. (2000), Vanmunster (2000) and Kato et al. (2002b) and days for the ULTRACAM data. A linear least squares fit to these times gives the following orbital ephemeris for GY Cnc:
| Target | UT Date | Cycle | ||||
|---|---|---|---|---|---|---|
| (start of night) | u′ | g′ | i′ | z′ | ||
| GY Cnc | 2003 May 19 | 6826 | 249.397235 | 249.397223 | – | 249.397248 |
| GY Cnc | 2003 May 23 | 6849 | 253.432215 | 253.432254 | 253.432254 | – |
| IR Com | 2003 May 21 | 37857 | 251.503269 | 251.503250 | 251.503194 | – |
| IR Com | 2003 May 23 | 37880 | 253.505096 | 253.505153 | 253.505153 | – |
| IR Com | 2003 May 25 | 37902 | 255.419890 | 255.419966 | 255.419909 | – |
| HT Cas | 2002 Sep. 13 | 119537 | 1.503015 | 1.503035 | 1.502995 | – |
| HT Cas | 2002 Sep. 14 | 119550 | 2.460443 | 2.460477 | – | – |
| HT Cas | 2003 Oct. 30 | 125129 | 413.338089 | 413.338159 | 413.338199 | – |
| HT Cas | 2003 Oct. 30 | 125130 | 413.411832 | 413.411792 | 413.411769 | – |
To determine the orbital ephemeris of IR Com, we used the 24 timings of Richter et al. (1997, as listed in Kato et al. 2002a), the 14 eclipse timings of Kato et al. (2002a) and those nine, given in Table 2, determined from the ULTRACAM data. The errors adopted for the data of Richter et al. (1997) and Kato et al. (2002a) were days for cycles , , , and and days for subsequent cycles, except where stated otherwise by Kato et al. (2002a). Those adopted for the ULTRACAM timings were days. The orbital ephemeris of IR Com was determined by a linear least squares fit to the above timings, and is
To determine the orbital ephemeris of HT Cas we used the 11 mid-eclipse times of Patterson (1981), the 23 times of Zhang, Robinson & Nather (1986), the 15 times of Horne et al. (1991) and the 11 ULTRACAM times given in Table 2. The times of Patterson (1981), Zhang et al. (1986) and Horne et al. (1991) were assigned errors of days and the times in Table 2 assigned errors of days. A linear least squares fit to these times gives the following orbital ephemeris for HT Cas:
The loss of accurate timings for the 2003 October 29 HT Cas data meant that these data were phased according to the orbital period derived above, with the mid-point of the observed eclipse as the zero-point. The cycle number was accurately determined from the times in the hand-written observing log. This may result in a slight fixed time offset for these data due to the uncertainty in determining the point of mid-eclipse.
These ephemerides were used to phase all of our data.
4 GY Cnc
In keeping with previous observations (summarised in section 1), the light curve of GY Cnc shown in Fig. 1 shows a deep primary eclipse, with the g′ flux dropping from a peak value of approximately 3 mJy (15.2 mag) to about 0.6 mJy (17.0 mag) at mid-eclipse. This places the system slightly above its quiescent brightness of , shortly after an outburst which reached twelfth-magnitude on 2003 May 13 (Waagen, private communication; observed by the amateur organisation the American Association of Variable Star Observers, AAVSO). The system was therefore likely to still be in decline from outburst. The eclipse morphology appears to be that of a gradual disc eclipse with a sharp eclipse of the white dwarf or bright spot superimposed thereon. We suspect that the sharp eclipse is that of a white dwarf, not the bright spot, as in both cycles observed the ingress and egress are of the same order in terms of both duration and depth. The eclipse is flat-bottomed, suggesting that the disc and white dwarf are completely obscured at these phases. The eclipse of the disc appears to be asymmetric, with the ingress being rather sharper than the more gradual egress. This is indicative of asymmetry in the disc structure, possibly due to an extended bright spot at the disc rim. The changing foreshortening of the bright spot, the cause of the orbital hump often observed in other dwarf novae, would also account for the rather greater flux before eclipse than after. Indeed, the ingress observed on 2003 May 23 appears to show two steps, which we attribute to first the bright-spot then the white dwarf entering eclipse. The likely presence of an extended bright spot is another reason why we suspect that the sharp, discrete eclipse visible in both nights’ data is that of the white dwarf. The light curve of Fig. 1 is morphologically similar to quiescent light curves in the literature (Gänsicke et al., 2000; Shafter et al., 2000; Thorstensen, 2000).
5 IR Com
The light curve of IR Com, shown in Fig. 1, also exhibits a deep primary eclipse. The light curve is highly variable outside of eclipse, with a maximum g′ flux of about 1.6 mJy (15.9 mag) and a minimum during eclipse of approximately 0.16 mJy (18.4 mag). The average out-of-eclipse g′ flux level of IR Com during our observations was 1.0 mJy (16.4 mag), consistent with the system being in quiescence. From the light curve of IR Com shown in Fig. 1 it is clear that the eclipse morphology of this object is highly variable. There is a clear eclipse of a compact structure, either the white dwarf or bright spot, as evidenced by the sharpness of the ingress and egress. The highly variable nature of the light curve of IR Com makes it difficult to determine whether the sharp eclipse is of the white dwarf or bright spot. The mean light curve of IR Com shown in Fig. 1 shows the main features of the light curve much more clearly, as flickering is much reduced. The sharp eclipse is revealed to be nearly symmetric, with evidence for an eclipse of the disc in the V-shaped eclipse bottom and the slopes before and after the sharp eclipse. No sign of the eclipse of another compact object is seen, so the sharp eclipse must be of the white dwarf (in which case the bright spot is extremely faint) or an eclipse of the bright spot (in which case the white dwarf remains visible at all phases).
Contact phases of the sharp eclipse of IR Com were determined using the derivative of the light curve, as described by Feline et al. (2004b,c, and references therein). For reasons of space, we do not reproduce these contact phases here, but we note that they do not show any evidence for asymmetry in the duration of ingress and egress (as is frequently the case with the eclipse of a bright spot, where the ingress is of a longer duration than the egress). Additionally, using the Nauenberg (1972) mass–radius relation for a cold, rotating white dwarf with Kepler’s third law (as described in Feline et al. 2004b,c) for reasonable values of shows that the eclipse contact phases are entirely consistent with the eclipsed object being of the correct size for a white dwarf. As Kato et al. (2002a) point out, their mid-eclipse timings show no significant differences between outburst and quiescence, implying that in both quiescence and outburst the brightness distribution is centred on the white dwarf. These points lead us to believe that the primary eclipse is of the white dwarf, rather than of the bright spot.
No unambiguous bright spot feature is visible in either the individual or mean light curves of IR Com shown in Fig. 1. From the absence of flickering during primary eclipse, it appears that the flickering is confined to the inner regions of the accretion disc or the white dwarf itself. The origin of the flickering in IR Com is most likely the boundary layer between the white dwarf and accretion disc.
 |
 |
 |
 |
 |
 |
 |
 |
 |
 |
 |
 |
6 HT Cas
6.1 Light-curve morphology
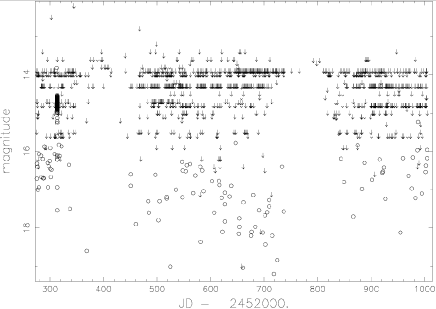
The light curves of HT Cas shown in Fig. 1 are typical of those found in the literature (e.g. Patterson, 1981; Horne et al., 1991). The typical out-of-eclipse g′ flux for the 2002 data is 0.7 mJy (16.8 mag), and the typical mid-eclipse g′ flux is 0.1 mJy (18.9 mag; see also Fig. 3). The peak g′ flux in the 2002 dataset is approximately 1.0 mJy (16.4 mag). HT Cas is slightly brighter in the 2003 data: the typical out-of-eclipse g′ flux is 1.2 mJy (16.2 mag), and the mid-eclipse g′ flux is again about 0.1 mJy (18.9 mag; see also Fig. 4). The 2003 data set is entirely consistent with HT Cas being in its high quiescent state (Robertson & Honeycutt, 1996), but the 2002 data appears to be somewhere between the high and low states described therein. The data from 2002 show other clear differences from the data of 2003. First, the eclipse bottoms in 2002 are much flatter than those of 2003, implying that the brightness distribution in 2002 was more centrally concentrated than in 2003. Second, the eclipse depth in 2003 was greater than in 2002, which, as we shall see, is due to increased disc emission and not an increase in the brightness of the white dwarf. There is also visible in the 2002 data a clear shoulder during egress. This appears to be the egress of the bright spot, similar in appearance to the feature seen in the light curves of Patterson (1981). Unfortunately for the aim of determining the system parameters from the eclipse contact phases, no bright spot ingress is visible. This variability of the light curve is typical of HT Cas (e.g. Patterson, 1981; Horne et al., 1991; Robertson & Honeycutt, 1996). The fact that the flux increase between 2002 and 2003 is slight illustrates that these brightness and morphological variations are not due to an overwhelming increase in the disc flux ‘drowning out’ the bright spot, as occurs during outburst. Observations of HT Cas by the AAVSO (Waagen, private communication; Fig. 2) show no evidence for an outburst of HT Cas before the 2003 October observations – the change in the light curve is not due to the system being on the way up or down from an outburst. We term the 2003 and 2002 data the ‘high’ and ‘low’ quiescent states, respectively (although we caution that these probably differ from the various high and low quiescent states discussed in the literature).
6.2 Eclipse mapping
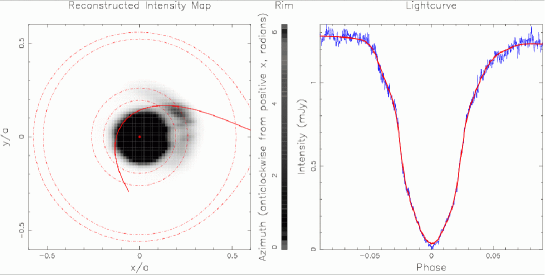
The eclipse mapping method was developed by Horne (1985). It reconstructs the two-dimensional brightness distribution of the (assumed flat) accretion disc from the information contained in the one-dimensional light curve. The disc is divided into a Cartesian grid, centred on the white dwarf, each element of which has an equal area. The intensity of each element is an independent parameter, which is adjusted by an iterative procedure to find the best fit to the light curve. The summation of the intensities of each visible grid element at each phase produces the light curve. The eclipse geometry is defined by the mass ratio and the orbital inclination . The parameters adopted for these reconstructions were those derived by Horne et al. (1991), and . The fit is constrained by minimising and maximising the entropy with respect to some default map (Horne, 1985). This latter constraint is required since the one-dimensional data cannot fully constrain the two-dimensional reconstruction of the disc intensity. One would expect Keplerian shear to minimise any azimuthal structure in the accretion disc, so the default map is usually chosen so that it suppresses azimuthal structure in the disc whilst preserving the radial structure. Rutten et al. (1993) used default maps of limited azimuthal smearing, which attempt to preserve a degree of azimuthal structure in the reconstructed intensity distribution. We have adopted a default map of limited azimuthal smearing (constant angle; Baptista, Catalán & Costa 2000), with radians and . We used the maximum entropy optimisation package memsys (Skilling & Bryan, 1984) to perform the iterative procedure. The grid was a pixel array; each element was further subdivided into a grid in order to determine its fractional visibility at each orbital phase. This subdivision process saves computational time during the iterative procedure whilst increasing the quality of the final reconstruction. The 2002 u′ and g′ light curves and all the 2003 light curves were rebinned by a factor of three (using a weighted mean) in order to reduce flickering and to make them comparable to the 2002 i′ data.
As the eclipse mapping method assumes that all the light originates from the accretion disc, any light remaining uneclipsed at mid-eclipse breaks the anti-correlation between the relative eclipse depth and the eclipse width implied by this assumption. This additional light is placed by the maximum entropy procedure in those parts of the disc least constrained by the data, such as the region farthest from the secondary star (the ‘back’) of the disc. Therefore, a constant was subtracted from the light curves prior to fitting. Ideally, this offset would be estimated by maximum entropy methods, either by computing a series of eclipse maps with differing offset values and selecting the map with the highest entropy or by including the offset as an additional free parameter in the eclipse mapping code (Rutten et al., 1992, 1994; Baptista et al., 1995; Baptista et al., 1996). Unfortunately, these techniques both fail for highly asymmetric accretion discs (Baptista et al., 1996) such as that of HT Cas in quiescence, because the spurious structure introduced in the reconstructed map by the uneclipsed component mixes with the asymmetric emission, forming a more symmetrical structure in the disc. This increases the entropy of the reconstructed map, meaning that the map with the largest entropy is not that with the correct offset. The offsets for these data were therefore first estimated from the mid-eclipse flux level, and fine-tuned by computing a series of eclipse maps with different offset values and selecting the map with the least spurious structure. These offsets are given in the relevant figure captions and are discussed further in section 7 and Fig. 6.
The maximum entropy method assumes that all variations in the light curve are due to the eclipse by the secondary star. As such, the orbital hump, which is due to the changing foreshortening of the bright spot, can introduce spurious features into the reconstructed map of the disc intensities. For example, Baptista et al. (2000) attempted to correct for the orbital hump by fitting a spline function to phases outside eclipse, dividing the light curve by the fitted spline and scaling the result to the value of the spline function at phase zero (see also Horne, 1985). This technique worked well on the light curve of IP Peg in outburst to which Baptista et al. (2000) applied it, but it is not suitable for the light curves of quiescent dwarf novae because not all parts of the disc contribute to the orbital hump: the white dwarf emits isotropically whereas the bright spot does not (Horne, 1985; Bobinger et al., 1997). The orbital hump was accounted for by a disc rim (e.g. Bobinger et al., 1997), divided into 50 segments of equal angle. The rim was assumed to be of negligible height, so that the flat disc assumption is not violated. We have estimated the radius of the disc rim from the position of the reconstructed bright spot, since the disc radius, of in 2002 and in 2003, is larger than that derived by Horne et al. (1991) of .
We have chosen not to deconvolve and remove the white dwarf from the light curves as the presence of flickering and the lack of a clear distinction between the eclipses of the white dwarf, bright spot and accretion disc makes this difficult to do so reliably (see, for example, Feline et al. 2004a). Besides, clear evidence for the features reproduced in the eclipse maps and discussed below can be seen directly in the light curves themselves.
As only a few light curves were used, the noise in the light curves is dominated by flickering rather than by photon noise. Iterating to a reduced is therefore inappropriate in this case and leads to the noise in the light curves (flickering) being transposed to the eclipse maps. Consequently, the eclipse maps were computed by progressively relaxing the constraint until the noise in the eclipse maps was satisfactorily ameliorated (as judged by visual inspection).
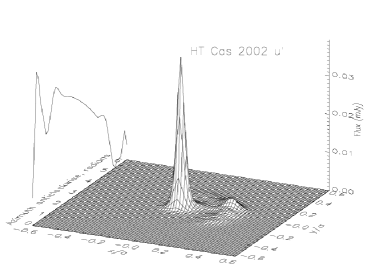
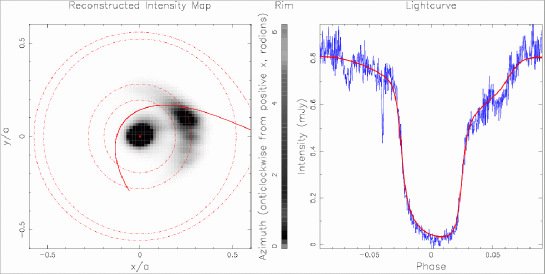
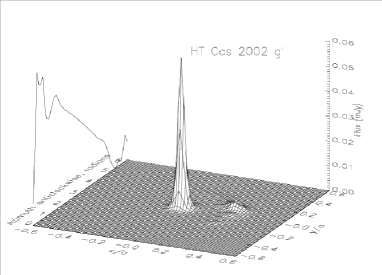
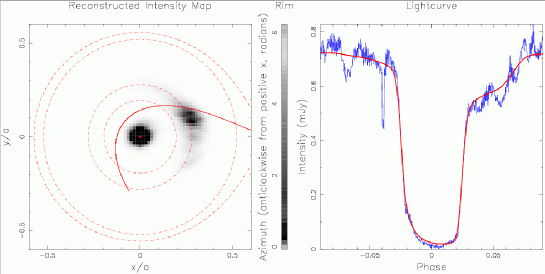
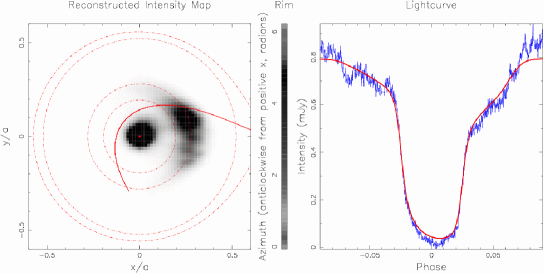
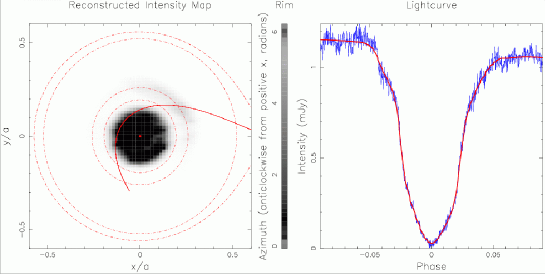
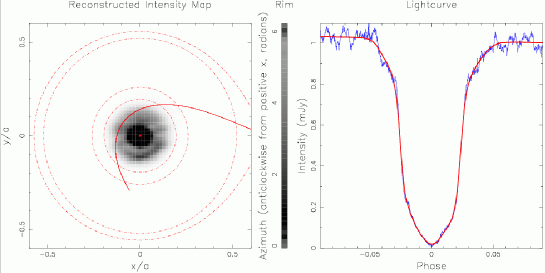
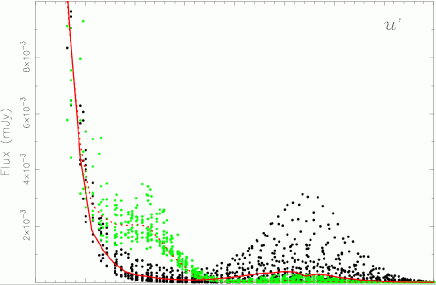
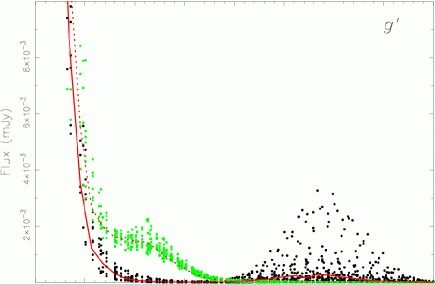
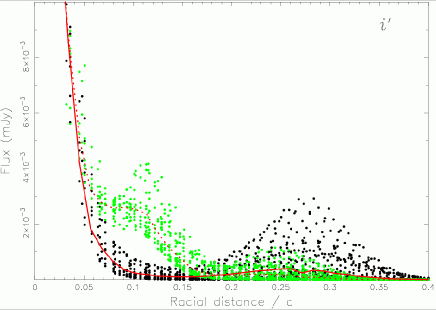
The reconstructed eclipse maps of HT Cas shown in Figs 3 and 4 show distinct morphological changes from 2002 to 2003. In both 2002 and 2003 the flux comes primarily from the white dwarf, but in 2002 there is clear evidence for a faint bright spot in the outer regions of the accretion disc. The 2003 eclipse maps show a very weak bright spot in the u′ and i′ passbands only. The absence of a bright spot in the 2003 g′ band may, however, be a contrast effect, as the white dwarf is approximately twice as bright in g′ as in the other bands. Not only is the bright spot much fainter/absent in the 2003 reconstructed maps, but there is evidence for emission from the inner portions of the accretion disc. This is best illustrated by the radial flux profiles shown in Fig. 5. Comparing the two radial profiles to the light curves shown in Fig. 1 demonstrates that the increased emission from the inner disc corresponds to a higher brightness state. The greater flux in 2003 is not, upon inspection of the eclipse maps, due to increased emission from the white dwarf, which is actually fainter in 2003 than in 2002, but due to a brighter inner disc.
By summing the flux from each element of each eclipse map whose centre lies within of the centre of the white dwarf and fitting the resulting colours to the hydrogen-rich, white dwarf model atmospheres of Bergeron et al. (1995), converted to the SDSS system using the observed transformations of Smith et al. (2002), the temperature of the white dwarf was determined to be K in 2002 and K in 2003. Varying the distance from the white dwarf over which the summation took place between – did not significantly affect the colours and therefore did not significantly affect these temperature estimates. These temperatures are consistent with those found by Wood et al. (1992, K) and by Vrielmann et al. (2002, K) from the same set of quiescent photometric observations. The effect of the variable nature of the accretion disc of HT Cas is evident in the white dwarf temperatures of HT Cas derived by Wood et al. (1995), of K during a low state (which is consistent with our results) and K during a normal state (which differs from our results by ).
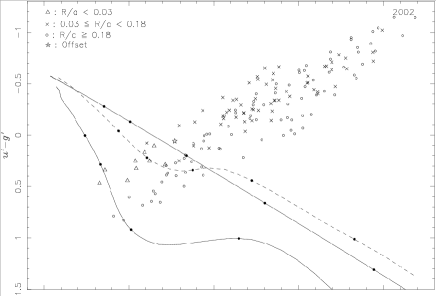
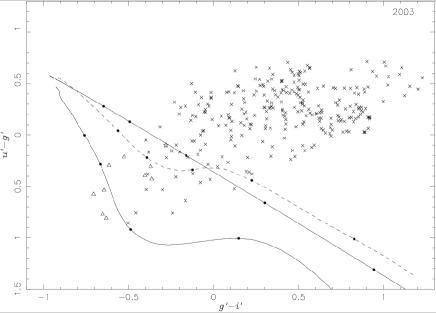
In Fig. 6 we present the colour-colour diagrams for the 2002 and 2003 eclipse maps of HT Cas. In both 2002 and 2003 the scatter of the data points from the central regions of the disc (), comprising the white dwarf and boundary layer, is consistent with an increase in the g′ flux over that expected from a lone white dwarf shifting the position of the datapoint down and to the left on Fig. 6. This suggests a contribution to this flux from the boundary layer surrounding the white dwarf. This excess g′ flux is (marginally) more pronounced in 2003 than in 2002, as might be expected given the differences between the distribution of the disc flux for these dates. The emission from both the inner () and outer () regions of the disc are concentrated to the right of the blackbody relation in Fig. 6, suggesting that the disc is optically thin (Horne & Cook, 1985; Wood et al., 1992; Baptista et al., 1996). There seems to be no significant difference between the colours of the inner and outer discs of 2002 (in 2003 the outer disc was too faint to be plotted on Fig. 6). Interestingly, in both 2002 and 2003, the offset colours lie on the blackbody relation rather than being on the main-sequence curve. A blackbody fit to the 2002 and 2003 offset colours gave K in each case.
 |
 |
 |
 |
 |
7 Discussion
We have found that the dwarf novae GY Cnc and IR Com both exhibit eclipses of the white dwarf, and have a bright spot which is faint (GY Cnc) or undetected (IR Com). We have determined updated ephemerides for both of these objects. IR Com, with its short orbital period, significant flickering, high/low quiescent states (Richter & Greiner, 1995; Richter et al., 1997) and lack of orbital hump or bright spot strongly resembles HT Cas in terms of its photometric behaviour (see also Kato et al. 2002a, ).
The colours of the offset flux of HT Cas shown in Fig. 6, which is estimated from the flux at mid-eclipse, suggest that it does not originate solely from the secondary star. Marsh (1990) detected the secondary star in HT Cas, and found it to be indistinguishable from a main-sequence star of spectral type M, which lies off to the bottom right of the plot of Fig. 6 on the main-sequence relation. We think it unlikely that the mid-eclipse flux is from outer regions of the accretion disc at the back of the disc which remain uneclipsed at phase zero, since examination of the eclipse maps shown in Figs 3 and 4 reveals that the emission from the rest of the disc is restricted to either the bright spot (in 2002) or the inner disc (in 2003). Given this, our preferred explanation for the mid-eclipse colours of HT Cas is that they are a combination of flux from the secondary star (which dominates in the i′ band) and flux from a vertically extended, optically thin disc wind, whose Balmer emission causes it to dominate in the u′ band. We note that the offset flux level seems to be correlated with the flux from the inner regions of the accretion disc, which supports the hypothesis of a disc wind originating from the inner disc region or boundary layer of HT Cas. We caution, however, that systematic errors may affect the offset fluxes due to the technique used to determine them, and that this conclusion is therefore tentative. (As the offset flux is a small fraction of the total light, except in the i′ band, any systematic errors present in the offset fluxes will not significantly affect the rest of our results.)
The eclipse maps of HT Cas shown in Figs 3 and 4 and the radial flux profiles shown in Fig. 5 clearly demonstrate that the accretion disc of HT Cas was in two distinct states during our 2002 and 2003 observations. In the 2002 data the disc provided a negligible contribution to the total light, except for the presence of a bright spot in its outer regions. In 2003 the bright spot was much fainter, but the inner disc was luminous, causing the overall system brightness to be mJy brighter than in 2002. The uneclipsed component was also slightly brighter in 2003 than 2002 (see captions to Figs 3 and 4), but was not the major cause of the differences in the flux. We proceed to review previous observations and to discuss various possible explanations for this behaviour.
The most likely reasons for the observed changes in the intensity distribution of the quiescent accretion disc of HT Cas lie in variability of the secondary star (which supplies the disc with material) or some property of the accretion disc itself. We can exclude the white dwarf as the cause of the variability since the only plausible way that this could affect the outer regions of the disc is via a magnetic field. HT Cas is a confirmed dwarf nova, whose white dwarfs do not have magnetic fields strong enough to significantly influence the motion of gas in the disc (e.g. Warner, 1995).
The most obvious mechanism for the accretion disc to produce the observed behaviour of HT Cas is via some relationship to the outburst cycle. Baptista & Catalán (2001) reported changes in the structure of the accretion disc of EX Dra (a dwarf nova above the period gap) through its outburst cycle, specifically the presence of a low-brightness state immediately after outburst during which the disc and bright spot were exceptionally faint. In EX Dra, the low-brightness state is due to reduced emission from all parts of the disc and white dwarf; our results, however, demonstrate that the quiescent luminosity of HT Cas depends on which areas of the disc are luminous. Robertson & Honeycutt (1996) find that both the transition between the quiescent high and low states and the duration of the low state in HT Cas occur on time-scales of days to months compared to the outburst cycle length of days (Wenzel, 1987). Truss, Wynn & Wheatley (2004) proposed a (slowly cooling) hot inner region of the disc in order to explain the constant quiescent brightness observed in (most) dwarf novae, which is contrary to the increase of 1–3 magnitudes predicted by most disc instability models (see Lasota, 2001 for a review). This fails to account for the observed changes in the outer accretion disc of HT Cas, but does provide a plausible explanation for the variability of the inner regions of the disc. This model, however, necessitates an outburst between the two sets of observations reported here, which amateur observations (Fig. 2) can neither confirm nor refute. We conclude that this latter scenario is the only plausible way in which the changes in the accretion disc of HT Cas could be related to its position in the outburst cycle.
The secondary star can also induce changes in the accretion disc. For example, variability of the rate of mass transfer from the secondary star is often (plausibly) cited as a mechanism to explain the quiescent variability of dwarf novae (and other CVs). Baptista & Bortoletto (2004) observed the short-period dwarf nova V2051 Oph in high and low quiescent states. Eclipse maps showed that the increased emission in the high state was due to greater emission from the bright spot and gas stream region, implying a higher mass transfer rate from the secondary star. Interestingly, this is the opposite to what we find for HT Cas.
Variability of the secondary star is in fact the mechanism usually proposed to explain the well-documented presence of high/low quiescence states in HT Cas (e.g. Berriman, Kenyon & Boyle, 1987, Wood, 1995; Robertson & Honeycutt, 1996). The most frequently cited explanation is that suggested by Livio & Pringle (1994), of star spots passing over the inner Lagrangian point temporarily lowering the mass transfer rate from the secondary star. Another possible causal process is magnetic variability of the secondary star. Ak, Ozkan & Mattei (2001) found cyclical variations in the quiescent magnitudes and outburst intervals of 22 CVs, which they attributed to solar-type magnetic activity cycles of the secondary stars. This can result in an increased mass transfer rate from the secondary star as well as the removal of angular momentum from the outer regions of the disc, causing material to accumulate in the inner regions of the disc rather than in the outer regions. The magnetic activity cycle of the secondary stars derived by Ak et al. (2001) is, however, on the wrong time-scale (years) to explain the frequency of the high/low state transitions and durations (days/months) observed by Robertson & Honeycutt (1996).
In summary, variations in the rate of mass transfer from the secondary star can explain the variability of the bright spot, but fail to account for the changes in the inner disc. These can be explained by a larger mass transfer rate through the accretion disc (possibly due to a rise in the disc viscosity and/or the scenario proposed by Truss et al. 2004) increasing the emission from the inner disc via viscous dissipation.
We conclude that the variability of the quiescent accretion disc of HT Cas is caused by variations both in the rate of mass transfer from the secondary star and through the accretion disc. In our 2002 observations then, the rate of mass transfer through the disc was lower and the rate of mass transfer from the secondary star greater than in 2003. It is clearly desirable to undertake long-term monitoring of HT Cas (or a similar object, e.g. IR Com) with the aim of eclipse mapping the changes that occur in the disc during quiescence and especially during a transition between the high and low states in order to determine the triggers and physical mechanisms underlying this behaviour.
Acknowledgments
We thank the anonymous referee for useful comments. WJF is supported by a PPARC studentship. TRM acknowledges the support of a PPARC Senior Research Fellowship. ULTRACAM is supported by PPARC grant PPA/G/S/2002/00092. This research has made use of NASA’s Astrophysics Data System Bibliographic Services. Based on observations made with the William Herschel Telescope operated on the island of La Palma by the Isaac Newton Group in the Spanish Observatorio del Roque de los Muchachos of the Instituto de Astrofisica de Canarias. We acknowledge with thanks the variable star observations from the AAVSO International Database contributed by observers worldwide and used in this research.
References
- Ak et al. (2001) Ak T., Ozkan M. T., Mattei J. A., 2001, A&A, 369, 882
- Bade et al. (1998) Bade N., Engels D., Voges W., Beckmann V., Boller T., Cordis L., Dahlem M., Englhauser J., Molthagen K., Nass P.and Studt J., Reimers D., 1998, A&AS, 127, 145
- Baptista (2001) Baptista R., 2001, in Boffin H. M. J., Steeghs D., Cuypers J., eds, Astrotomography: Indirect Imaging Methods in Observational Astronomy Springer-Verlag Lecture Notes in Physics, Berlin, p. 307
- Baptista & Bortoletto (2004) Baptista R., Bortoletto A., 2004, AJ, 128, 411
- Baptista & Catalán (2001) Baptista R., Catalán M. S., 2001, MNRAS, 324, 599
- Baptista et al. (2000) Baptista R., Catalán M. S., Costa L., 2000, MNRAS, 316, 529
- Baptista et al. (1995) Baptista R., Horne K., Hilditch R. W., Mason K. O., Drew J. E., 1995, ApJ, 448, 395
- Baptista et al. (1996) Baptista R., Steiner J. E., Horne K., 1996, MNRAS, 282, 99
- Bergeron et al. (1995) Bergeron P., Wesemael F., Beauchamp A., 1995, PASP, 107, 1047
- Berriman et al. (1987) Berriman G., Kenyon S., Boyle C., 1987, AJ, 94, 1291
- Bobinger et al. (1997) Bobinger A., Horne K., Mantel K.-H., Wolf S., 1997, A&A, 327, 1023
- Dhillon & Marsh (2001) Dhillon V. S., Marsh T. R., 2001, New Ast. Rev., 45, Issue 1-2, 91
- Faulkner & Lin (1983) Faulkner J., Lin D. N. C., 1983, MNRAS, 205, 359
- Feline et al. (004a) Feline W. J., Dhillon V. S., Marsh T. R., Brinkworth C. S., 2004a, MNRAS, 355, 1
- Feline et al. (004b) Feline W. J., Dhillon V. S., Marsh T. R., Stevenson M. J., Watson C. A., Brinkworth C. S., 2004b, MNRAS, 347, 1173
- Feline et al. (004c) Feline W. J., Dhillon V. S., Marsh T. R., Stevenson M. J., Watson C. A., Brinkworth C. S., 2004c, MNRAS, 354, 1279
- Gänsicke et al. (2000) Gänsicke B. T., Fried R. E., Hagen H.-J., Beuermann K., Engels D., Hessman F. V., Nogami D., Reinsch K., 2000, A&A, 356, L79
- Girardi et al. (2004) Girardi L., Grebel E. K., Odenkirchen M., Chiosi C., 2004, A&A, 422, 205
- Hagen et al. (1995) Hagen H.-J., Groote D., Engels D., Reimers D., 1995, A&AS, 111, 195
- Horne (1985) Horne K., 1985, MNRAS, 213, 129
- Horne & Cook (1985) Horne K., Cook M. C., 1985, MNRAS, 214, 307
- Horne et al. (1991) Horne K., Wood J. H., Steining R. F., 1991, ApJ, 378, 271
- Kato et al. (002a) Kato T., Baba H., Nogami D., 2002a, PASJ, 54, 79
- Kato et al. (002b) Kato T., Ishioka R., Uemura M., 2002b, PASJ, 54, 1023
- Kato et al. (2000) Kato T., Uemura M., Schmeer P., Garradd G., Martin B., Maehara H., Kinnunen T., Watanabe T., 2000, Inf. Bull. var. Stars, 4873
- Lasota (2001) Lasota J. P., 2001, New Ast. Rev., 45, 449
- Livio & Pringle (1994) Livio M., Pringle J. E., 1994, ApJ, 427, 956
- Marsh (1990) Marsh T. R., 1990, ApJ, 357, 621
- Meyer & Meyer-Hofmeister (1981) Meyer F., Meyer-Hofmeister E., 1981, A&A, 104, L10
- Mineshige & Osaki (1983) Mineshige S., Osaki Y., 1983, PASJ, 35, 377
- Nauenberg (1972) Nauenberg M., 1972, ApJ, 175, 417
- Osaki (1974) Osaki Y., 1974, PASJ, 26, 429
- Osaki (1996) Osaki Y., 1996, PASP, 108, 39
- Paczyński (1977) Paczyński B., 1977, ApJ, 216, 822
- Patterson (1981) Patterson J., 1981, ApJS, 45, 517
- Richter & Greiner (1995) Richter G. A., Greiner J., 1995, in Bianchini A., Della Valle M., Orio M., eds, Proc. Abano-Padova Conf. on Cataclysmic Variables pp 205, 177
- Richter et al. (1997) Richter G. A., Kroll P., Greiner J., Wenzel W., Luthardt R., Schwarz R., 1997, A&A, 325, 994
- Robertson & Honeycutt (1996) Robertson J. W., Honeycutt R. K., 1996, AJ, 112, 2248
- Rutten et al. (1994) Rutten R. G. M., Dhillon V. S., Horne K., Kuulkers E., 1994, A&A, 283, 441
- Rutten et al. (1993) Rutten R. G. M., Dhillon V. S., Horne K., Kuulkers E., van Paradijs J., 1993, Nat, 362, 518
- Rutten et al. (1992) Rutten R. G. M., van Paradijs J., Tinbergen J., 1992, A&A, 260, 213
- Shafter et al. (2000) Shafter A. W., Clark L. L., Holland J., Williams S. J., 2000, PASP, 112, 1467
- Skilling & Bryan (1984) Skilling J., Bryan R. K., 1984, MNRAS, 211, 111
- Smak (1982) Smak J., 1982, Acta Astronomica, 32, 199
- Smak (1984) Smak J., 1984, Acta Astronomica, 34, 161
- Smith et al. (2002) Smith J. A., Tucker D. L., et al. 2002, AJ, 123, 2121
- Thorstensen (2000) Thorstensen J. R., 2000, PASP, 112, 1269
- Truss et al. (2004) Truss M. R., Wynn G. A., Wheatley P. J., 2004, MNRAS, 347, 569
- Vanmunster (2000) Vanmunster T., 2000, vsnet-alert, No. 4210
- Verbunt & Rappaport (1988) Verbunt F., Rappaport S., 1988, ApJ, 332, 193
- Voges et al. (1999) Voges W., Aschenbach B., Boller T., Bräuninger H., Briel U., Burkert W., Dennerl K., Englhauser J., Gruber R., Haberl F., Hartner G., Hasinger G., Kürster M., Pfeffermann E., Pietsch W., Predehl P., Rosso C., Schmitt J. H. M. M., Trümper J., U. Z. H., 1999, A&A, 349, 389
- Vrielmann et al. (2002) Vrielmann S., Hessman F. V., Horne K., 2002, MNRAS, 332, 176
- Warner (1995) Warner B., 1995, Cataclysmic Variable Stars. Cambridge University Press, Cambridge
- Wenzel (1987) Wenzel W., 1987, 308, 75
- Wenzel et al. (1995) Wenzel W., Richter G. A., Luthardt R., 1995, Inf. Bull. var. Stars, 4182
- Wood et al. (1992) Wood J. H., Horne K., Vennes S., 1992, ApJ, 385, 294
- Wood et al. (1985) Wood J. H., Irwin M. J., Pringle J. E., 1985, MNRAS, 214, 475
- Wood et al. (1995) Wood J. H., Naylor T., Hassall B. J. M., Ramseyer T. F., 1995, MNRAS, 273, 772
- Wood (1995) Wood M. A., 1995, in Koester D., Werner K., eds, European Workshop on White Dwarfs, Lecture Notes in Physics, Volume 443, p. 41
- Zhang et al. (1986) Zhang E.-H., Robinson E. L., Nather R. E., 1986, ApJ, 305, 740