11email: manuel.perucho@uv.es, jose-maria.marti@uv.es 22institutetext: Toruń Centre for Astronomy, Nicholas Copernicus University, PL-97-148 Piwnice k.Torunia (POLAND)
22email: mhanasz@astri.uni.torun.pl
Nonlinear stability of relativistic sheared planar jets
The linear and non-linear stability of sheared, relativistic planar jets is studied by means of linear stability analysis and numerical hydrodynamical simulations. Our results extend the previous Kelvin-Hemlholtz stability studies for relativistic, planar jets in the vortex sheet approximation performed by Perucho et al. (2004a,b) by including a shear layer between the jet and the external medium and more general perturbations. The models considered span a wide range of Lorentz factors () and internal energies () and are classified into three classes according to the main characteristics of their long-term, non-linear evolution. We observe a clear separation of these three groups in a relativistic Mach-number Lorentz-factor plane. Jets with a low Lorentz factor and small relativistic Mach number are disrupted after saturation. Those with a large Lorentz factor and large relativistic Mach number are the stablest, due to the appearance of short wavelength resonant modes which generate local mixing and heating in the shear layer around a fast, unmixed core, giving a plausible solution for the problem of the long-term stability of relativistic jets. A third group is present between them, including jets with intermediate values of Lorentz factor and relativistic Mach number, which are disrupted by a slow process of mixing favored by an efficient and continuous conversion of kinetic into internal energy. In the long term, all the models develop a distinct transversal structure (shear/transition layers) as a consequence of KH perturbation growth, depending on the class they belong to. The properties of these shear layers are analyzed in connection with the parameters of the original jet models.
Key Words.:
Galaxies: jets - hydrodynamics - instabilities1 Introduction
Transversal structure in extragalactic jets could be the natural consequence of current formation mechanisms (see, e.g., Sol et al. 1989; Celotti & Blandford 2000), in which an ultrarelativistic presumably electron/positron outflow from the high latitude region close to the spinning black hole (and powered by, e.g., the extraction of energy from the hole) is surrounded by a mildly relativistic, electron/proton, hydromagnetic outflow launched from the outer parts of the accretion disk. Recent numerical simulations of jet formation from black hole magnetospheres (Koide et al. 1997) also lead to outflows with two-layered shell structure consisting of inner, fast gas pressure driven jets surrounded by slower, magnetically dominated winds. On larger scales, shear layers (with distinct kinematical properties and magnetic field configurations) have been invoked in the past by several authors (Komissarov 1990, Laing 1996, Laing & Bridle 2002a,b) in order to account for a number of the observational characteristics of FR I radio sources. The model of De Young (1993) to explain the FRI/FRII morphological dichotomy is based on deceleration of the jet flow at the inner galactic core and the subsequent formation of turbulent shear layers in FRIs. Recently, Swain et al. (1998) found evidence of shear layers in FR II radio galaxies (3C353), and Attridge et al. (1999) have inferred a two-component structure in the parsec-scale jet of the source 1055+018. On the other hand, first simulations of radio emission from three-dimensional relativistic jets with shear layers (Aloy et al. 2000) allowed several observational trends in parsec and kiloparsec jets to be interpreted: inhomogeneous distributions of apparent speeds within radio knots (Biretta et al. 1995); rails of low polarization along jets (as in 3C353; Swain et al. 1998); top/down jet emission asymmetries in the blazar 1055+018 (Attridge et al. 1999). Stawarz & Ostrowski (2002) have studied the contribution to the radiative jet output from turbulent shear layers in large-scale jets.
Given all the pieces of theoretical and observational evidence concerning the ubiquity of shear layers in extragalactic jets, it appears natural to analyze their influence on the dynamics and stability of relativistic jets. An attempt to investigate the growth of the Kelvin-Helmholtz (KH) instability in some particular class of sheared, cylindrical relativistic jets was pursued by Birkinshaw (1991). However, this study is limited to the ordinary and low-order reflection modes, and the domain of jet parameters considered involves only marginally relativistic flows (beam flow velocities ; is the speed of light) and non-relativistic (jet, ambient) sound speeds (). Other approaches to linear analysis of the stability of relativistic stratified jets (Hanasz & Sol 1996, Hardee & Hughes 2003) and sheared, ultrarelativistic jets (Urpin 2002) have also been taken. Several recent works combine linear analysis and hydrodynamical simulations in the context of both relativistic jets (Rosen et al. 1999, Hardee 2000, 2001) and GRBs (Aloy et al. 2002).
In this paper, we focus on the study of the evolution of relativistic (planar) flows with shear layers through the linear and non-linear regimes relying on both linear, analytical stability analysis and hydrodynamical numerical simulations. The present work complements the one presented in Perucho et al. (2004a,b; hereafter, Paper I and II, respectively), in which we characterized the effects of relativistic dynamics and thermodynamics in the development of KH instabilities in planar, relativistic jets in the vortex sheet approximation. We used a more general setup for simulations with the inclusion of a set of symmetric (pinching) and antisymmetric (helical) sinusoidal perturbations in two dimensional slab jets and a thicker shear layer () than that used to mimic vortex sheet evolution. The use of slab jets allows for inclusion of helical perturbations, which are known to be present in extragalactic jets. Moreover, two dimensional simulations provide the possibility of a much larger resolution than three dimensional ones. The aim of this work is to study the stability properties of jets depending on their initial parameters and the effect of shear layers in those properties. We used the temporal approach, which allows for larger resolution, and fixed two different grid sizes, depending on the thermodynamical properties of jets, which are neither directly related nor coupled to the wavelength of a specific mode, as was the case in Papers I and II. Jet parameters are based on those of previous papers for direct comparison. We generalized our results with simulations where only one antisymmetric mode is perturbed (similar to simulations in Paper I), and simulations of cylindrical jets, where several modes are perturbed (as in simulations presented in this paper).
2 Setup for numerical simulations
The equations governing the evolution of a relativistic perfect-fluid jet (see Paper I) are
| (1) |
| (2) |
| (3) |
In the preceding equations, is the speed of light, the particle rest mass density. stands for the relativistic density which is related to the particle rest mass density and the specific internal energy , by . The enthalpy is defined as , and the sound speed is given by , where is the adiabatic index. The relation between pressure and the specific internal energy is . The velocity of the fluid is represented by , and is the corresponding Lorentz factor. The operator appearing in Eq. (3) is the standard Lagrangian time derivative.
The steady initial flow is 2D-planar and symmetric with respect to the plane. The flow moves in the positive direction. Our simulations were performed in the so-called temporal approach, as in Papers I and II. In this approach, the evolution of perturbations in a peridiocal slice of an infinite jet is followed along the time. In order to study the effects of shearing in the development of the instability, we assumed a continuous transition between the jet and the ambient (the same as the one considered by Ferrari et al. 1982). The profiles of the axial velocity and proper rest-mass density across this transition layer, and , respectively, are given by
| (4) |
| (5) |
In the previous expressions, represents the fluid flow velocity in the jet axis, whereas and are the proper rest-mass density at the jet axis and in the ambient, respectively. The exponent controls the shear layer steepness; in the limit the configuration tends to the vortex-sheet case. In our present calculations we have used , corresponding to a shear layer of thickness , about twice that used in Papers I and II, in order to mimic the vortex sheet limit. From now on all quantities representing the jet will be assigned the ’’ subscript and the quantities representing the ambient medium will be assigned the ’’.
Following conclusions given in the Appendices of both Paper I and Paper II, the numerical resolution used was in the transversal direction times in the axial direction. Note that we reduced the transversal resolution with respect to the simulations in Papers I and II. One reason for that were computational time limitations, as now our grids are twice as large in the transversal direction as those used in Paper I, since we are now combining symmetric and antisymmetric structures. However, in the present simulations, transversal resolution is not as critical as in the previous works, since we are not interested in mimicking the evolution of instability in the vortex sheet limit and therefore do not have steep shear layers. The saving in transversal resolution allowed us to double axial resolution, which affects the non-linear results (see Appendix in Paper II). The physical sizes of grids are axially times transversally for hot jets (models D, see Table 1) and axially times transversally for cold jets (models A and B in Table 1). The different axial size is due to hot models having shorter unstable modes; see Sect. 3.1, where we show linear problem solutions for one cold and one hot jet.
Previous to these simulations, we performed several representative runs (B05, D05, B20, D20) with the aim of studying the evolution of models under single eigenmode perturbations in planar antisymmetric geometry, exciting the first reflection antisymmetric mode at its peak growth rate. These simulations were used to check the consistency of the numerical results in the linear phase with the linear stability analysis for relativistic, sheared flows. Discussion of the evolution of these models through the non-linear regime can be found in Appendix A. Tests were also performed in order to assess the difference in the evolution of linear and non-linear regimes using a general sinusoidal perturbation (to be used in this paper) and a superposition of eigenmodes, as done with the first body mode alone in Paper I. Results showed that structures and qualitative properties of the resulting flow were basically the same. This fact confirms that general perturbations excite eigenmodes of the system.
The parameters used in the simulations are shown in Table 1. We swept a wide range in Lorentz factors (from 2.5 to 20) and in specific internal jet energies (from to ) in order to obtain a global view of the response of different initial data sets to perturbations. All the models correspond to a single-component ideal gas with adiabatic exponent . These parameters were chosen in order to study the stability regions found in Paper II: Class I for cold and slow models, which were deeply mixed and mass loaded; Class II for hot and fast jets, which were slowly mixed in the nonlinear regime, progressively losing their axial momentum; Class III for hot and slow jets, with properties between Classes I and II, and Class IV for cold/warm and fast models, which were the stablest in the nonlinear regime. We performed simulations for models B05111Boldface will be used for new simulations in order to differentiate them from those in Paper II with the same name., B10, B20, D05, D10, and D20 of Paper II, and added A2.5 (same thermodynamical properties as A05 in Paper II), A10, B2.5, and D2.5. Models A2.5, B2.5, and B05 correspond to regions of Class I jets. Models D10 and D20 correspond to Class II, D2.5 and D05 to Class III, and A10,B10 and B20 belong to Class IV.
Perturbations we applied adding the following sinusoidal form to transversal velocity, :
| (6) |
where is the amplitude given to the perturbation, are the wavenumbers of the grid box (so that and stand for the harmonics of the symmetric (pinching) and antisymmetric (helical) modes, respectively), and and are random phases given to each mode. In our simulations, four symmetric () plus four antisymmetric modes () were excited, i.e., the fundamental mode of the box and the first three harmonics.
Numerical simulations were performed using a finite-difference code based on a high-resolution shock-capturing scheme which solves the equations of relativistic hydrodynamics written in conservation form (Martí et al. 1997 and references therein). Before performing the simulations, several improvements were made in the numerical code. In particular, the relativistic PPM routines (Martí & Müller 1996) were properly symmetrized. The code was recently parallelized using OMP directives. Simulations were performed with 4 processors on SGI 2000 and SGI Altix 3000 machines.
3 Results
3.1 Linear regime
3.1.1 Perturbation theory
We introduced an adiabatic perturbation of the form to the flow equations (1-3), and () being the frequency and wavenumber of the perturbation along (across) the jet flow. We followed the temporal approach, in which perturbations grow in time, with real wavenumbers and complex frequencies, with the imaginary part being the growth rate. By linearizing the equations and eliminating the perturbations of rest mass density and flow velocity, a second-order ordinary differential equation for the pressure perturbation , is obtained (Birkinshaw 1991, Aloy et al. 2002)
| (7) | |||||
where is the energy-density of the unperturbed model, the pressure, the three-velocity component, the Lorentz factor, and the relativistic sound speed. The prime denotes the -derivative. Unlike the vortex sheet case, in the case of a continuous velocity profile, a dispersion relation cannot be written explicitly. The equation (7) is integrated from the jet axis, where boundary conditions on the amplitude of pressure perturbation and its first derivative are imposed
| (8) | |||||
Solutions satisfying the Sommerfeld radiation conditions (no incoming waves from infinity and wave amplitudes decaying towards infinity) are found with the aid of the numerical method, based on the shooting method (Press et al. 1997) proposed in Roy Choudhury & Lovelace (1984).
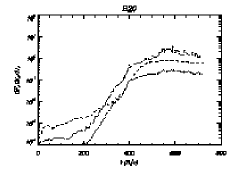
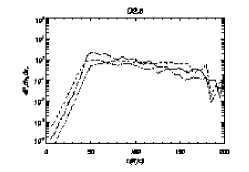
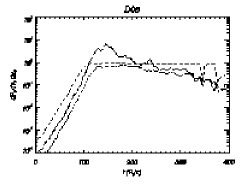
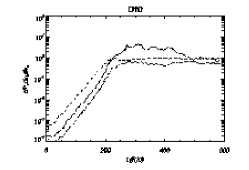
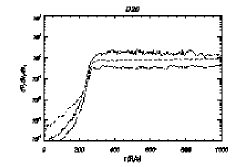
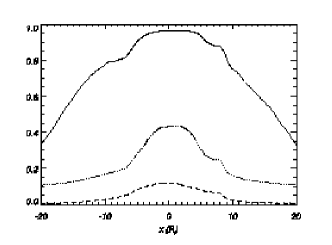
Linear stability analysis was performed for all models presented in Sect. 2, in the symmetric and antisymmetric cases. Figure 1 shows examples of solutions for the linear problem for sheared jets in models B05 and D20. Top panels in Fig. 1 show the (real part of) frequency as a function of wavenumber, and bottom panels show the imaginary part of frequency or growth rate, defined as the inverse of the time needed by a given mode to -fold its amplitude, also as a function of wavenumber. Each mode is defined by its wavelength, frequency and growth rate.
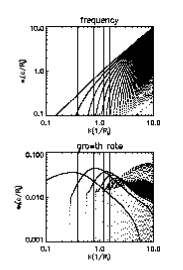
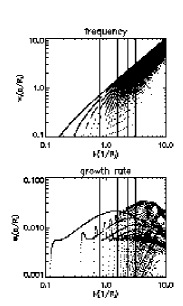
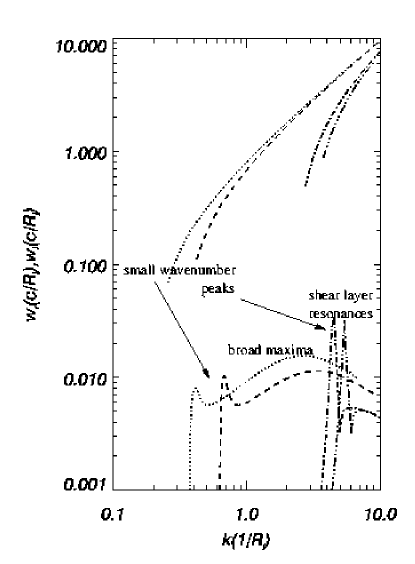
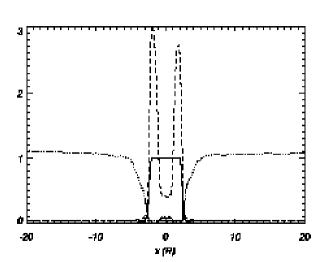
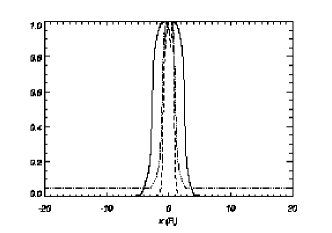
From these results, we note that the individual reflection mode solutions of the shear problem present lower growth rates for most wavenumbers, especially in the large wavenumber limit, than do the corresponding solutions in the vortex sheet case. This behaviour was noticed for the first time by Ferrari et al. (1982) for the first and second reflection modes in the non-relativistic limit. The growth rate curves corresponding to a single -th reflection mode consists of a broad maximum at higher wavenumbers and a local peak which is placed in the low wavenumber limit, near the marginal stability point of a chosen reflection mode. Regarding the relativistic case, while in the vortex-sheet limit the small wavenumber peaks for individual modes are relatively unimportant (since the maximum growth rates at these peaks are lower than those of other unstable modes), while in the presence of the shear-layer they display high growth rates for high order body modes. Therefore we shall call these peaks the shear layer resonances. In Fig. 2 we show the solution for four specific modes of model D20, from Fig. 1. Low order body modes do not show high peaks at maximum unstable wavelengths, whereas high order body modes show peaks (shear layer resonances) at this maximum wavelength and do not present broad maxima.
From Eq. (7) we see that radial structure of perturbations depends on physical parameters of the flow, as well as on the given frequency and axial wavenumber of a given perturbation. Resonances are determined by this transversal structure, and therefore we should expect changes in their characteristics depending on the properties of the shear layer and physical parameters: i) a decrease of the jet Lorentz factor reduces the dominance of the growth rates of resonant modes with respect to ordinary and low order reflection modes; ii) a decrease in the specific internal energy of the jet causes resonances to appear at longer wavelengths; iii) further widening of the shear layer reduces the growth rates and the dominance of the shear-layer resonances, suggesting that there is an optimal width of the shear layer that maximizes the effect for a given set of jet parameters; the largest growth rate of resonant modes moves to smaller wavenumbers and lower order reflection modes; iv) perturbations with wavenumber higher than some limiting value (that decreases with the shear layer width) are significantly diminished (short-wavelength cut-off), consistent with previous non-relativistic results (Ferrari et al. 1982). The discovery of the shear layer resonances and their potential role in the long-term stability of relativistic jets is reported in Perucho et al. (2005).
3.1.2 Simulations
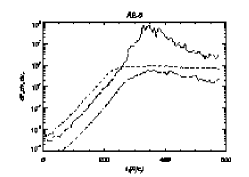
Table 2 summarizes the properties of the linear phase in our simulations. The left part of the Table (colums 2-9) gives the theoretical growth rates of the perturbed wavelengths, taken at the vertical lines in Fig. 1. The last column gives the values of the growth rate corresponding to the dominant wavelength as deduced from Fourier analysis of the transversal profiles of the rest mass density distribution in the jet. Note, however, that Fourier analysis can only give us information about wavelengths, but cannot distinguish between symmetric and antisymmetric modes. The growths of pressure, axial, and transversal velocity perturbations along the simulations are shown in Fig. 3.
| Model | Dominant | |||||
|---|---|---|---|---|---|---|
| Symm. Antis. | Symm. Antis. | Symm. Antis. | Symm. Antis. | |||
| A2.5 | 0.036 0.032 | 0.038 0.037 | 0.034 0.036 | 0.031 0.034 | 0.030 | |
| B2.5 | 0.042 0.056 | 0.070 0.052 | 0.066 0.084 | 0.073 0.080 | , | 0.070 |
| D2.5 | 0.046 0.160 | 0.131 0.182 | 0.210 0.194 | 0.142 0.256 | , | 0.200 |
| B05 | 0.037 0.035 | 0.037 0.044 | 0.036 0.038 | 0.034 0.035 | , | 0.035 |
| D05 | 0.068 0.063 | 0.085 0.063 | 0.100 0.068 | 0.068 0.110 | ,, | 0.080 |
| A10 | 0.009 0.009 | 0.006 0.006 | 0.005 0.006 | 0.006 0.006 | * | 0.004 (0.005) |
| B10 | 0.022 0.018 | 0.019 0.021 | 0.018 0.017 | 0.013 0.013 | 0.020 | |
| D10 | 0.034 0.038 | 0.041 0.037 | 0.044 0.034 | 0.051 0.035 | , | 0.040 |
| B20 | 0.011 0.010 | 0.009 0.010 | 0.007 0.007 | 0.009 0.010 | * | 0.006 (0.008) |
| D20 | 0.018 0.018 | 0.020 0.017 | 0.022 0.017 | 0.027 0.028 | , | 0.016 |
Comparison of the evolution through the linear phase of the different models in the numerical simulations and from the linear stability analysis is summarized as follows:
-
•
A2.5: modes with longer wavelengths are faster growing, and their Fourier amplitudes are consistently larger than those for shorter modes in the simulation. Growth rate found in the simulation is close to the one expected from linear stability analysis.
-
•
B2.5: first () and second () harmonics of the box have larger amplitudes in the Fourier analysis and, therefore, dominate the linear regime. Linear stability analysis gives , and as the fastest growing modes, with a similar growth rate to that found in the simulation. However, modes have smaller amplitudes.
-
•
D2.5: found growth rate for the simulation is close to that of and modes, which is confirmed by Fourier analysis. Antisymmetric mode might grow with slower rates than theory predicts due to numerical viscosity that affects shorter modes more than longer ones.
-
•
B05: Fourier analysis shows competition between fundamental and first harmonics of the box ( and , respectively). This, as well as the value of the mean growth rate, is confirmed by the linear stability analysis. The second harmonic of the box () is damped.
-
•
D05: according to Fourier analysis, and modes dominate evolution in the linear regime. The growth rate is close to that of the symmetric mode, despite the fact that symmetric and antisymmetric present faster growth rates, so they appear to be damped.
-
•
A10: Fourier analysis shows that longer modes dominate, in agreement with linear stability analysis. However, the growth rate in the numerical simulation is two times smaller than predicted. We also observe in Fourier analysis that very short modes, excited as harmonics of perturbed wavelengths, become important by the end of the linear regime.
-
•
B10: modes dominate, as predicted by linear stability analysis.
-
•
D10: as in models D2.5 and D05, and have larger amplitudes in Fourier analysis, but the smaller wavelength modes () are damped with respect to the predictions of linear stability analysis.
-
•
B20: longer modes dominate the linear evolution, in agreement with linear analysis, but the growth rate in the numerical simulation is times smaller than predicted. After some time, short, fast modes, like those appearing in model A10, become dominant and lead to a smooth transition to the non-linear regime.
-
•
D20: long modes present larger amplitudes with predicted growth rates up to the moment when shorter modes reach larger amplitudes, the same effect as found in models A10 and B20.
It is observed in several simulations (e.g., B2.5, B05, D2.5, D05, D10) that modes with similar or even slightly higher growth rates than those dominating in simulations present smaller amplitudes in the linear regime. It happens usually for shorter modes (typically , ), so it may be caused by numerical viscosity, for less cells are involved in one wavelength. However, the way in which we perturb the jet may also favor the dominating growth of certain modes starting with a larger amplitude. We added a general sinusoidal perturbation, so the input amplitude of the perturbation at a given wavelength is shared in a random way among all the modes present at that wavelength. This makes some modes start their growths with smaller amplitudes, as we could see in the Fourier analysis of different models. Initial low amplitudes are more probable for short wavelength modes, as more eigenmodes are present at a given wavenumber in this range (see Fig. 1). From an initial lower amplitude, and taking into account that they have similar growth rates to other modes, they grow with smaller amplitudes for the rest of the linear phase.
Models A10 and B20, marked with an asterisk in Table 2, have fitted growth rates in the first part of the linear regime below the predicted values. Note that these models have the lower growth rates. After this initial phase, short harmonics start dominating the linear growth.
| Model | |||
|---|---|---|---|
| B05 | 0.052 | ||
| D05 | 0.11 | ||
| A10 | 0.013 | 0.017 | 0.009 |
| B10 | 0.035 | ||
| D10 | 0.057 | ||
| B20 | 0.026 | 0.036 | 0.036 |
| D20 | 0.035 | 0.070 | 0.047 |
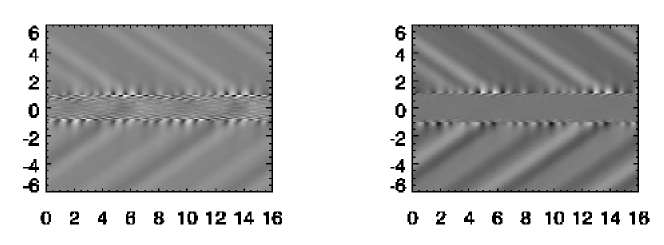
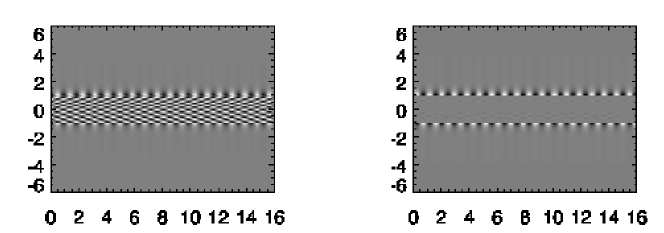
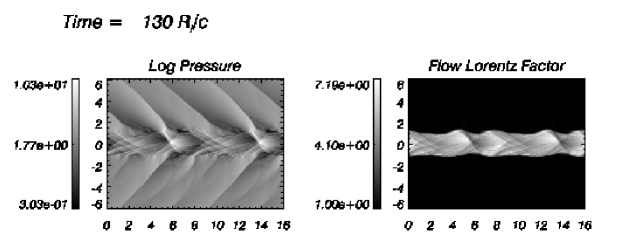
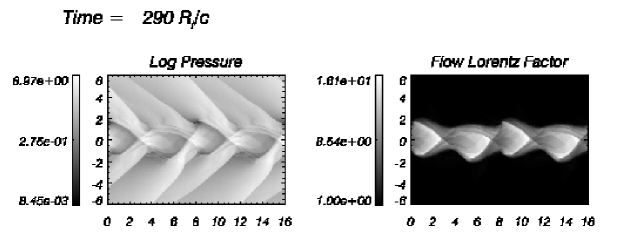
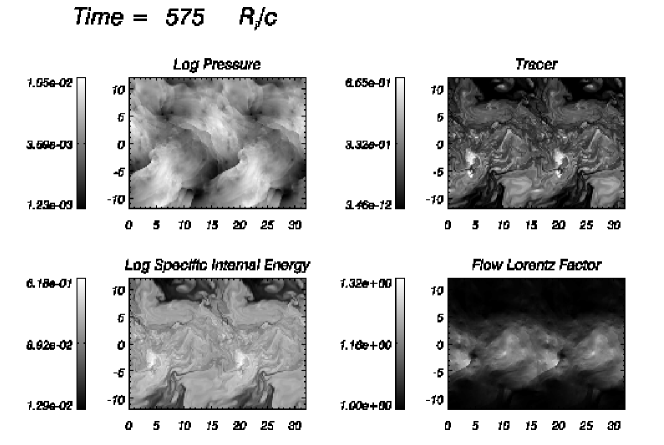
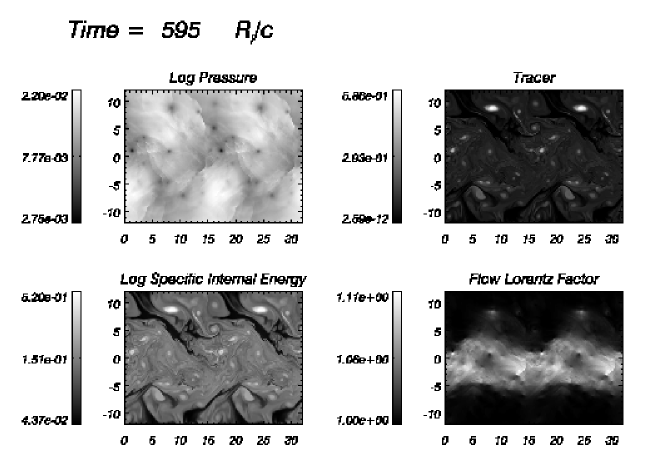
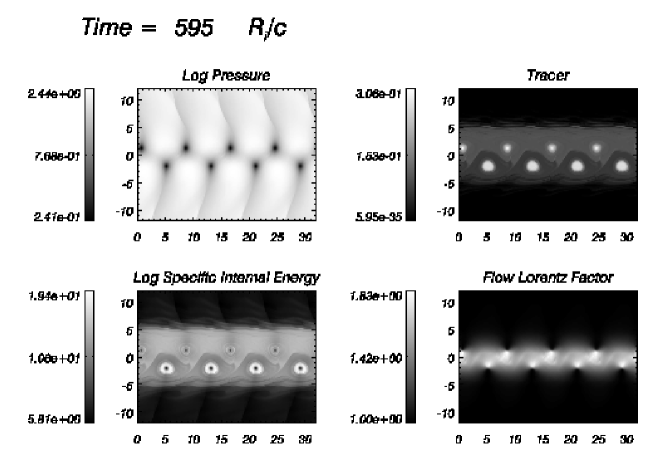
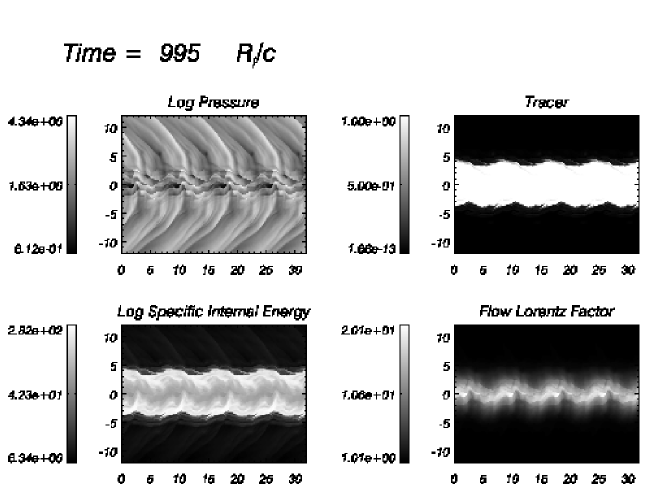
We have observed the appearance of fast growing, very short modes in models A10, B20, and D20, which are clearly associated to the resonant modes presented above in the previous section and which could have been excited as harmonics of the initially perturbed wavelengths. The same kind of resonant mode might have developed in model C20 of Paper II and caused the irregular linear growth found with respect to the rest of models. These modes generate a rich internal structure in the jet due to their large perpendicular wavenumber or, equivalently, short perpendicular wavelengths (characteristic of high order body modes). A direct comparison between the structure generated by these resonant modes in the numerical simulations and that coming from linear stability analysis can be seen in Fig. 4. In this figure, we display one snapshot from model D20 and the theoretical counterpart using one of those resonant modes. The upper plots correspond to the numerical simulation in the linear regime, where the signature of the initial perturbations (,, and ) are the oblique waves seen outside the jet. As seen in these plots, resonant modes grow to amplitudes larger than those of the long waves, as indicated by the black/white scale saturating precisely on the interface. The lower plots represent the theoretical structure that we would find if we had only excited a resonant mode and that is fairly similar to the one appearing in the shear layer of the simulated jet. Let us point out, however, that it is difficult to identify the exact mode in the simulation, as the resonant modes overlap so much (see Fig. 1) and it may happen that what we see is the structure resulting from a combination of competing resonant modes.
According to the linear stability analysis, resonant modes have the highest growth rates in high Lorentz factor jets and, among them, in colder jets. This could be the reason why they only appear in simulations of models A10, B20, and D20. Table 3 collects the models which present maximum growth rate for all resonant modes (i.e., at any wavelength), found in the solutions to the linear problem, above the growth rates of the perturbed modes. Maximum growth rates for resonant modes in those models where they have been found, along with the fitted growth rates in the simulation, are listed. Typically, the growth rates from the numerical simulations are about times higher. This difference remains unexplained, but it could be caused by second-order effects, like interaction between modes.
Summarizing, two kinds of linear growth are found in these simulations, one dominated by longer modes typical of slower jets and another one where short, fast modes appear. This difference is important, for the transition to the non-linear evolution depends critically on the dominant modes at the end of the linear regime.
Table 4 shows the times at which linear phase ends. As the end of the linear regime we selected the moment when one of the variables (usually axial velocity) changes its slope (departs from the linear growth, see definitions in Paper I). On the other hand, we noticed that the longitudinal velocity perturbation grows linearly up to values close to the speed of light and then beyond the sound speed. This means that shocks should form at the end of linear phase, as it is the case; see Fig. 3 in Paper I, where we observe weak shocks starting to appear as conical structures. We could have selected the end of the linear regime as the moment when these shocks start to appear. This would relate the end of the linear regime directly to the internal sound speed. We see that colder jets have longer linear phases than hot ones, due to smaller typical growth rates in the former. times are larger than those in Paper I, as growth rates are reduced by the presence of the shear layer. Model A10 presents the longest linear phase.
3.2 Saturation and transition to nonlinear regime
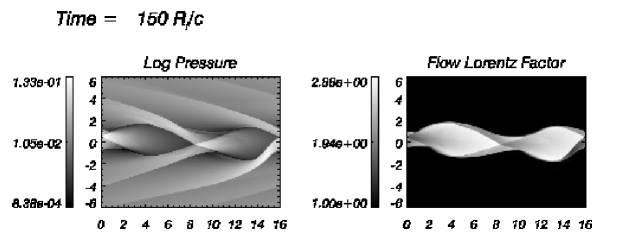
Saturation of perturbations is reached (see Paper I) when perpendicular velocity cannot grow further in the jet reference frame due to the speed of light limit. Saturation times for the different models are listed in Table 4. In this phase, structures generated by dominating modes become visible in the deformations of the jet. In Fig. 5 we show snapshots of three models (B2.5, D05, and D10) at saturation time where mode competition derived from Fourier analysis is clearly observed. Asymmetric structures appear as a result of several symmetric and antisymmetric modes with large amplitudes.
In Paper II we also discussed how at the end of the saturation phase nearly all the simulations lead to a sharp peak in the pressure oscillation amplitude. These peaks are also seen in the present simulations (see Fig. 3). The relative values of pressure oscillation amplitude at the peak and the corresponding times are listed in Table 4. The values of were connected with the non-linear evolution of the flow. Those cases in which developed a shock in the jet/ambient interface followed by the sudden disruption of the jet. From Table 4, we see that peak values in the present simulations are in general qualitatively the same as the corresponding ones in Paper I. Colder and slower jets have larger peaks and hence suffer stronger shocks after saturation. The main difference between the values in this paper and those presented in Paper I appears for models B20 and D20, where shock strength is much smaller due to the appearance of resonant, stabilizing modes, as we discuss next.
The parallel and perpendicular wavelengths of the shear-layer resonant modes, and , respectively, are both small () with . Therefore their wavevectors are almost perpendicular to the jet axis so the waves propagate from the shear layer towards the jet axis. On the other hand, the resonant modes have high growth rates, exceeding the growth rate of other modes, so they start to dominate in the evolution. Subsequently, the resonant modes saturate as soon as the flow velocity oscillation amplitude approaches the speed of light. As the maximum amplitude is reached, the sound waves steepen while travelling towards the jet axis and form shock fronts on the leading edges of wave profiles Dissipation of the oscillation energy of resonant modes in shocks changes the background flow, so that the amplification conditions of the longer wavelength modes change during the course of time, reducing the value of and preventing the formation of a strong shock.
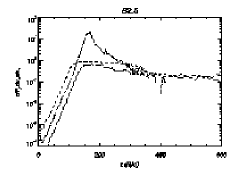
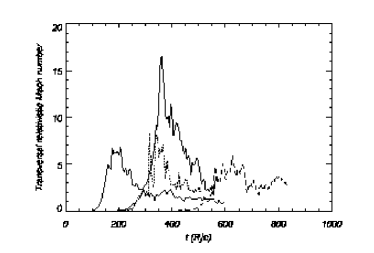
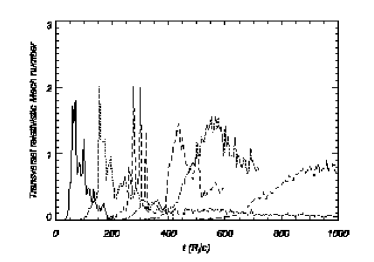
Finally, as found in Paper II, the generation of the shock wave at the jet/ambient interface is imprinted in the evolution of the maxima of the transversal Mach number of the jet with respect to the unperturbed ambient medium. This quantity is defined as , with and the Lorentz factors associated to and , respectively. A value significantly larger than 1 around points towards a supersonic expansion of the jet at the end of the saturation phase. This magnitude is shown in Fig. 6. We observe a clear inverse tendency of the peak value of this magnitude from colder to hotter and from slower to faster jets, with the exception of A10 with respect to B10 and D10, due to the presence of the resonant stabilizing modes preventing the formation of a strong shock.
It is important to note that models with (A2.5, B2.5, B05, and B10) coincide with those developing larger transversal Mach numbers, see top panels of Fig. 5 for model B2.5, where pressure maxima are observed at the jet center and in the interaction of the growing wave with the ambient.
3.3 Fully non-linear regime
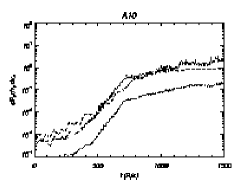
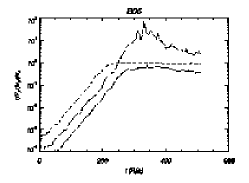
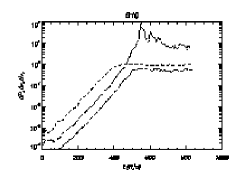
In Paper II, the non-linear evolution of the instability in the different models was characterized through the processes of jet/ambient mixing and momentum transfer. In Fig. 7 we show the width of the mixing layer as a function of time for all the models. The times at which mixing starts in the different models appear listed in Table 4. In all cases these times are around . Generally, models developing wider shear layers are also more mixed; i.e., the amount of mass in zones with jet mass fraction strictly different from 0 and 1, is higher. We observe that those models with larger values of (lower Lorentz factor and colder jets) develop wider layers () soon after saturation due to turbulent mixing induced by the shock, while those models where resonant modes appear do not show strong mixing with the ambient. Models B10 and D10 undergo a mixing process, though slower than the former.
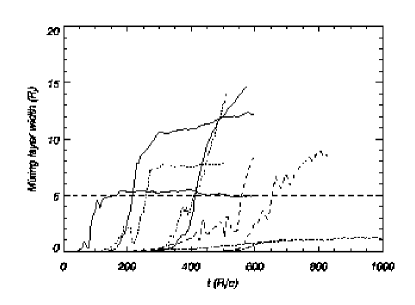
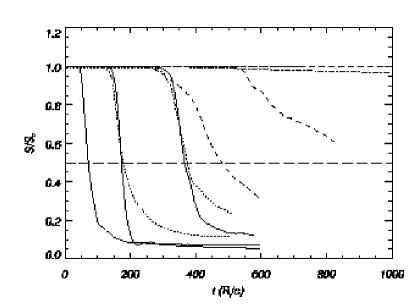
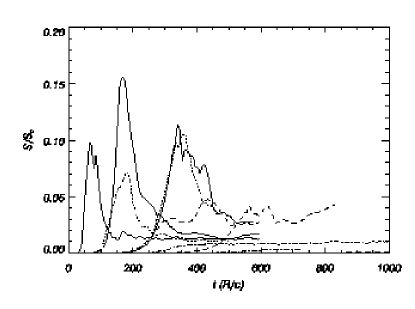
Figure 8 shows the fraction of initial axial momentum kept by the jet as a function of time. Axial momentum is lost first through sound waves forming the linear perturbations and second, but more important, through shocks themselves and by subsequent mixing, which implies sharing of momentum with the ambient medium. Correlation with Fig. 7 is remarkable. Models developing wide mixing layers coincide with those losing more than of their initial axial momentum just after saturation; models B10 and D10 share their momentum with the ambient medium continuously in the non-linear regime; and models where resonant modes dominate saturation keep almost all their initial momentum by the end of the simulations. Results derived from Fig. 8 are corroborated by Fig. 9. In the latter we plot the total transversal momentum in the jets normalized to the corresponding longitudinal momentum. Transversal momentum in the jet (initially zero) is generated through turbulent motions and continuous conversion of kinetic into internal energy. The value of the normalized transversal momentum at a given time is an indication of how far from equilibrium the jet is. We observe that colder and lower Lorentz factor models present strong peaks at , coincident with the triggering of the shock and the sudden transfer of longitudinal momentum seen in the previous plot: Those models where resonant modes appear barely generate any transversal momentum, and models B10 and D10 do not present strong peaks at saturation but display a steady transmission of the transversal momentum through the non-linear regime (see Fig. 9), implying continuous loss of energy.
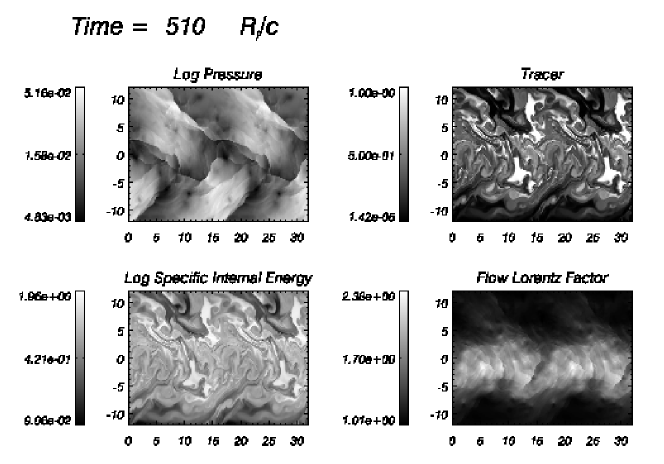
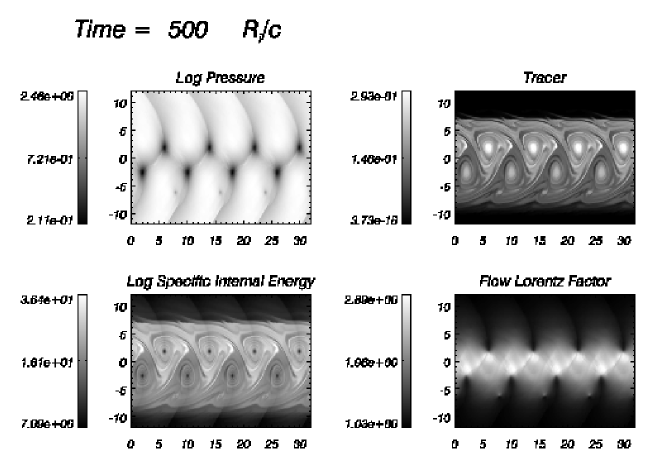
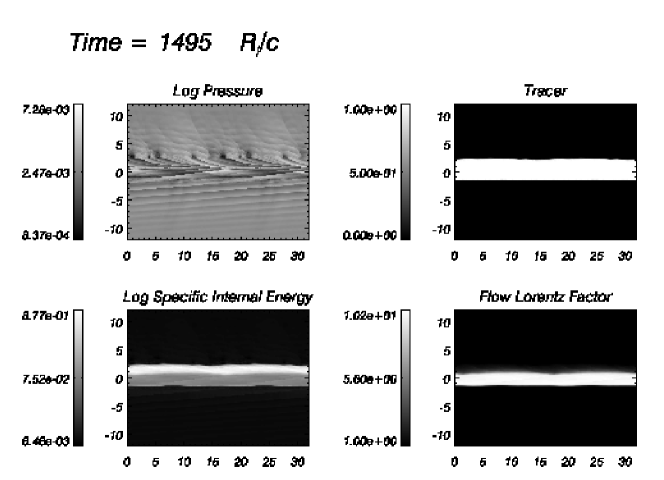
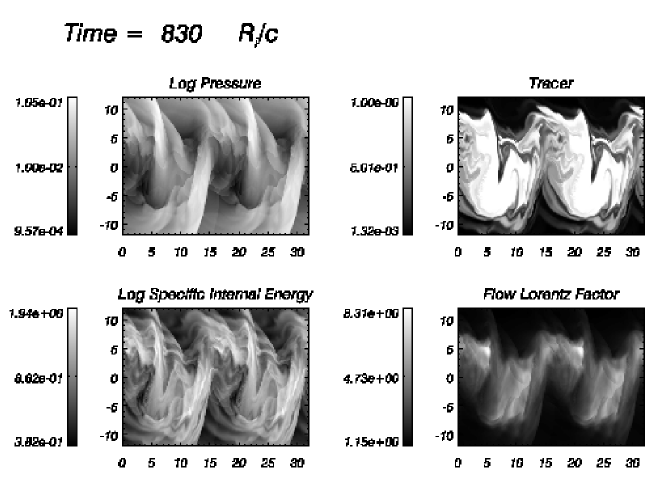
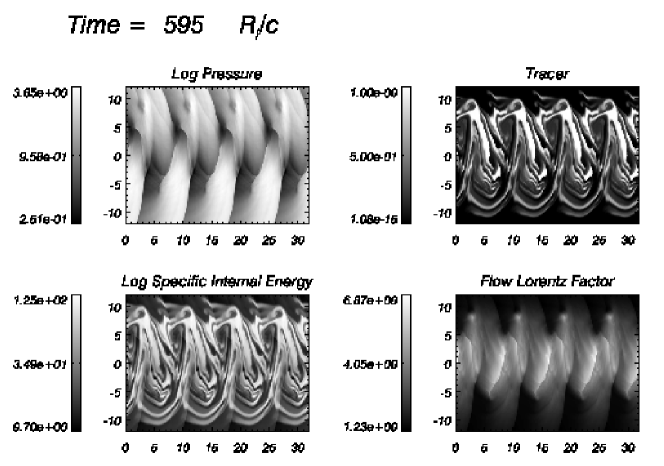
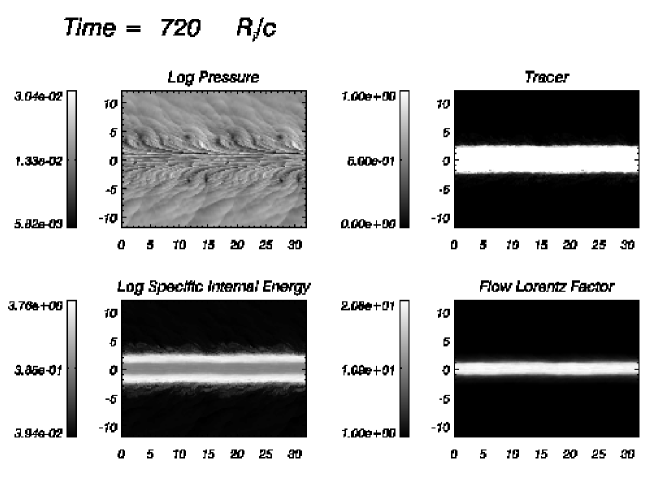
Panels showing several physical quantities for all models at the end of simulations are presented in Figs. 10-19. Colder and slower models (A2.5, B2.5, and B05) show turbulent mixing in a wide region and are barely relativistic by the end of the simulations. Models D2.5 and D05 have mixed deeply (the jet mass fraction is less than one everywhere) but keep larger Lorentz factors. Moreover, these models seem to have stopped the widening process of the mixing layer as it is deduced from the flattening of the mixing layer width as a function of time in Fig. 7. Models B10 and D10 are also undergoing turbulent mixing. From Figs. 7 and 8, it is deduced that B10 and D10 are still mixing and transferring momentum by the end of simulations. These models will eventually lose a large amount of their initial longitudinal momentum, thereby becoming colder and denser due to mass entrainment from the ambient medium. Finally, models A10, B20 and D20 present a fast core wide with rich internal structure as a consequence of the resonant modes (see subsection on the linear regime), which is surrounded by a hot and slow shear layer that extends up to in models A10 and B20 or in model D20. Let us point out that model A10 (Fig. 15) displays a highly asymmetric structure, resulting from the development of resonant modes only on the upper interface. This is a consequence of the combination of symmetric and antisymmetric modes, and probably of nonlinear interactions between resonant modes, which result in destructive interference on one side of the jet and constructive interference on the other.
4 Discussion
4.1 Non-linear stability
Simulations presented in Papers I and II, performed for the most unstable first reflection mode of the corresponding models, confirmed the general trends resulting from the linear stability analysis: the faster (larger Lorentz factor) and colder jets have smaller growth rates in the linear regime. In Paper II, the non-linear evolution of the instability in the different models was characterized through the processes of jet/ambient mixing and momentum transfer. The models were then classified into four classes (I to IV) according to the particular nature of these processes in each of the models. Class I models (corresponding to cold and slow jets) were deeply mixed and mass-loaded by the end of the simulation. Models in Class II (hot and fast jets) were slowly mixed in the nonlinear regime, progressively losing their longitudinal momentum. Models in Class III (hot and slow jets) have properties between Classes I and II. Finally, Class IV (containing cold/warm and fast models) appeared as the most stable in the nonlinear regime. Shear layers formed in all the models as a result of the non-linear evolution. Models in Classes I/II developed broad shear layers and appeared totally mixed, cooled, and slowed down. In contrast, models in Classes III/IV have an inner core surrounded by thinner layers and keep a larger amount of their initial longitudinal momentum. We performed a number of additional simulations keeping the properties of the ambient medium fixed and changing the rest-mass density of the jet and the Lorentz factor. Results confirmed that these models behave like previous simulations, and are naturally placed in the classification already defined.
The stability classes considered in Paper II were defined according to the jet response to single modes. In this paper we revisit this classification scheme in the light of the present results based on more general perturbations. From the analysis of Figs. 7, 8, and 9, we classified jets depending on their nonlinear behaviour in three different groups:
-
•
Unstable 1 (UST1) models: jets which are disrupted after a strong shock is formed after the linear regime, enhancing turbulent mixing with ambient medium. It includes models A2.5, B2.5, D2.5, B05, and D05, i.e., lower Lorentz factor jets. The mixing layer width becomes larger than (Fig. 7), and they share more than of their initial momentum with the ambient medium (Fig. 8).
-
•
Unstable 2 (UST2) models: jets which are disrupted in the non-linear phase by a continuous process of momentum transfer to the external medium, like B10 and D10. This is observed in Fig. 9 as a non-decreasing transversal momentum in the nonlinear regime. These models eventually end up sharing a large fraction of initial momentum and developing a wide mixing layer.
-
•
Stable (ST): jets which develop resonant modes and remain collimated for long time, A10, B20, and D20. These models have a thin mixing layer and share a very small fraction of their axial momentum with the ambient medium. They expand, but remain collimated.
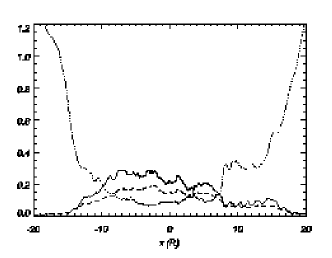
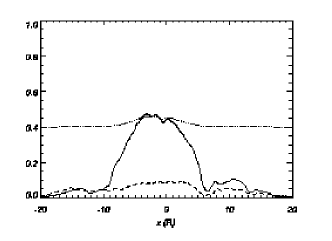
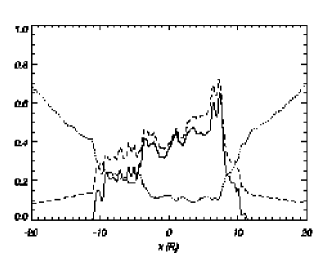
In the course of their evolution, the jets develop a rich transversal structure in all the physical variables. This structure is different depending on the non-linear evolution of the jets. Figure 20 displays the transversal profiles of relevant physical quantities averaged along the jet at the end of the simulations for model A2.5, representative of models in UST1, D10 of UST2, and B20 of ST.
Model A2.5 shows a totally mixed, mass-loaded flow with averaged maximum speed , i.e., barely relativistic, as these jets are efficiently slowed down by mass entrainment after the disruption. The mass loading is inferred from the low values in the tracer profile (), which imply a large fraction of ambient medium material inside the jet. The efficient conversion of kinetic energy into internal energy enhanced by the shock triggered in the early post-linear phase causes the jet to increase its specific internal energy.
UST2 jets undergo a slower process of mixing, so they still keep a larger fraction of axial velocity and Lorentz factor by the end of the simulation, even though they appear to be totally mixed ( everywhere). However, as we have mentioned in the previous section, the mixing and slowing process is still going on in B10 and D10, so it is clear that if the simulation had continued, the longitudinal velocity and Lorentz factor values would be smaller than those found. We also observe that the more mass-loaded parts of the jet (i.e., the region with ) are consistently colder.
Finally, the jet in model B20 remains very thin. The velocity profile of the model has widened by by the end of the simulation, coinciding with the generation of a hot shear layer. This layer is seen in the figure as an overheated and underdense () region shielding the unmixed core (), which keeps almost all its initial axial momentum and Lorentz factor. The core has a rich internal structure (see the pressure panel in Fig. 18) that also manifests in the spiky structure of the shows longitudinal momentum profile.
A comparison of the present non-linear evolution classification scheme and that of Paper II (classes I-IV) allows us to conclude that, in general, models in Classes I and III fall into UST1, whereas models in Class II corresponds to UST2 and those in Class IV to ST. The reason models D2.5 and D05 (belonging formerly to Class III) move to UST1 may be the inclusion of longer wavelength perturbations, along with the antisymmetric modes, which are more disruptive than the symmetric first reflection mode used in the previous work, and the lack of axial resolution in the latter, as discussed in the Appendix of Paper II. This can be seen by comparing structures and evolution of model D05 here and in Paper II, in particular the evolution of the mixing and momentum transfer.
Regarding UST2 here compared to former class II, B10 and D10 undergo a very similar slow process of momentum transfer to the external medium to that observed for D10 and D20 in Paper II, although their temperatures are very different and the shock in B10 is much stronger than in D10 (see Table 4). The reason for this slow momentum exchange may be the same as proposed in Paper II for models D10 and D20, i.e., a continuous conversion of kinetic into internal energy due to the large initial Lorentz factor, which acts as a source of transversal momentum favoring the process of mixing and mass-loading. Model B10 changes from Class I in Paper II to UST2 here, meaning that disruption occurs by slow mixing in the new simulation, compared to sudden disruption in the previous one.
Models in Class IV were characterized by a rich internal-structure jet preserving a large fraction of initial momentum and Lorentz factor. ST models share these features, but now we are able to clearly associate them to with the growth of resonant modes, which could be the reason for the breaking of the linear slope in model C20 in Paper I (see Fig. 2 there). Steepening of short wavelength perturbations at the shear layer generates small shocks which favor local mixing and an efficient conversion of kinetic into internal energy. As a result of this process, the shear layer heats up and the jet expands to form a hot and underdense layer around the jet core (see Fig. 20). It is remarkable that model A10 is largely asymmetric by the end of the simulation (see Fig. 15). This is a consequence of the resonant modes only growing on one side of the jet during the linear regime, and it is understood on the basis of asymmetry resulting from mixture of symmetric and antisymmetric modes. This effect, though much less evident, is also observed in model B20. Finally, model D20 has moved from class II in Paper II to ST here, clearly due to the appearance of resonant modes. This fact allows us to conclude that the fate of ST models would be exactly the same as those in UST2, if it were not for the growth of resonant modes; hence, their importance in the long term stability of these jets.
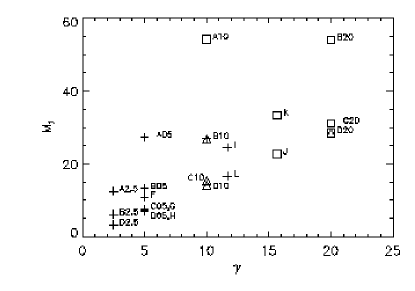
We classified jets depending on their nonlinear behaviour in three different groups, which are clearly separated in a relativistic internal jet Mach number vs. jet Lorentz factor plot (Fig. 21). In this plot, we also include models from Paper II, in order to show the general character of our results and to note that this division of the stability properties of jets is more accurate than in Paper II, with the jet-to-ambient enthalpy ratio instead of the relativistic Mach number. A clear correlation between the two plotted parameters and the non-linear stability properties of the jets is observed. Models B10 and D20 are represented with two different symbols to show the change of nonlinear behaviour from Paper II. These are placed in transition regions of the plot, either in Lorentz factor (B10) or in relativistic Mach number (D20). This fact could explain differences in the non-linear behaviour as caused by changes in the initial jet profiles, what is quite evident in the case of D20, for resonant modes appear due to the presence of the shear layer. As in the previous discussion, we have given the same symbols (crosses) as for UST1 jets here to models in Class III of Paper II, as we do not consider that they have different non-linear behaviour in both simulations. Figure 21 can be considered as the relativistic counterpart of the (Mach number-density ratio) diagram in Bodo et al. (1994); note that the density ratio, , is inverted with respect to ours. In our case the Mach number is relativistic; and the density ratio, which stands for the inertia of the flow, is replaced by the Lorentz factor here, as relativistic momentum is , so it dominates the inertia of relativistic jets. Our conclusions are similar to theirs, for denser (higher Lorentz factor) and highly supersonic jets (high relativistic Mach number) are the stablest. However, in our case, we found a higher degree of stability due to the growth of resonant, stabilizing modes.
This result agrees with the conclusion of Hardee (2000), where linear stability arguments show that distortions induced by instabilities are smaller for higher Lorentz factor flows, although they were not associated to the shear resonances reported by us.
Finally, simulations discussed in Appendices A (single antisymmetric mode in planar geometry) and B (single symmetric mode in cylindrical geometry) have confirmed general trends of the present clasification scheme, generalizing our results.
4.2 Astrophysical implications
One of the current open problems in extragalactic jet research is to understand the morphological dichotomy between FRI and FRII jets. Several possible explanations have been proposed which mainly fall in one of these two general possibilities: either (i) FRI and FRII sources are intrinsically the same, and the morphology and jet evolution depend mainly on the ISM in which they are embedded in the first kiloparsecs, or (ii) they depend on intrinsic differences stemming from the jet formation process (black hole rotation, Blandford 1994; accretion rate, Baum et al. 1995; black hole mass, Ghisellini & Celotti 2001; the so-called magnetic switch, Meier et al. 1998), or (iii) a combination of both (e.g., Snellen & Best 2003). Of course, all the mechanisms could come into play with differing effects and significance depending on the source.
Leaving the basis of the morphological dichotomy aside, current models (Laing & Bridle 2002a,b and references therein) interpret FRI morphologies as the result of a smooth deceleration from relativistic (, Pearson 1996) to non-relativistic transonic speeds () on kpc scales. On the contrary, flux asymmetries between jets and counter-jets in the most powerful radio galaxies and quasars indicate that relativistic motion () extends up to kpc scales in these sources, although with smaller values of the overall bulk speeds (, Bridle et al. 1994). Current models for high energy emission from powerful jets at kpc scales (e.g., Celotti et al. 2001) offer additional support to the hypothesis of relativistic bulk speeds on these scales.
The results concerning the long-term evolution of relativistic jets presented in this paper and summarized in Fig. 20 confirm that slower and smaller Mach number jets (UST1) are entrained by ambient material and slowed down to after becoming overpressured (due to conversion of kinetic into internal energy) and being disrupted by nonlinear instabilities effects which cause flaring and rapid expansion of the mixing flow. UST2 jets undergo a smooth slowing down; and though by the end of the simulation jet velocity is , this process is continuous, and eventual loss of velocity to mildly relativistic values is to be expected. Finally, ST jets keep their initial highly relativistic velocities, and their steadiness by the end of simulations makes them firm candidates for remaining collimated over long distances. Hence our results would point to a high Lorentz factor, highly supersonic jets as forming FRII Class, whereas FRI jets would be found in the opposite corner of the diagram (slow, small Mach number jets). The validity of our results extends to models with different jet-to-ambient-density ratios and specific internal energies as seen in Paper II.
Our conclusions point to an important contribution by intrinsic properties of the source to the morphological dichotomy. Nevertheless, the importance of the ambient medium cannot be ruled out on the basis of our simulations, since we consider an infinite jet in pressure equilibrium flowing in an already open funnel and surrounded by a homogeneous ambient medium. Thus our approach does not take into account the consequences of the interaction of the jet with the ambient in order to penetrate it or the effects of a spatially varying atmosphere. Simulations following the spatial approach (perturbations grow with distance) for jets propagating in different ISM profiles and using a more realistic microphysics (allowing for a local mixture of electron, positron, and proton Boltzmann gases) will be performed in order to clarify these points.
As dicussed in the introduction of this paper, there are plenty of arguments indicating the existence of transversal structure in extragalactic jets at all scales. In the simulations presented here, the initial states were defined with a continuous transition layer of thickness . As discussed in the previous paragraphs, this shear layer has played an important role in the long-term stability of the jet flow. Besides this, thicker shear layers have been generated in the course of the non-linear evolution. Relatively thin (), hot shear layers are found in present ST models (the physically meaningful counterparts of the layers found in the three-dimensional, low-resolution simulations of Aloy et al. 1999, 2000), which could explain several observational trends in powerful jets at both parsec and kiloparsec scales (see Aloy et al. 2000 and references therein). Conversely and according to our simulations, these transition layers could be responsible for the stability of fast, highly supersonic jets, preventing the mass-loading and subsequent disruption. Finally, the type of shear layers developed by models UST1/2 could mimic the transition layers invoked in models of FRIs (Laing & Bridle 2002a,b).
5 Conclusions
We performed a number of simulations spanning a wide range of parameters, such as Lorentz factor and specific internal energy, for a general setup where a slab-sheared jet is perturbed with a set of symmetric and antisymmetric sinusoidal perturbations, in order to characterize the stability properties of relativistic jets.
The most remarkable feature regarding the linear evolution of instabilities is the finding of resonant modes in our simulations, which were later confirmed by applying linear stability theory to sheared flows. These modes are important for the long-term stability properties of some jets (ST), for they remain collimated and unmixed, thereby keeping a large amount of initial axial momentum. Jets in which these modes do not grow fast enough with respect to longer modes are disrupted either after a shock or by slow momentum transfer and mixing.
We classified jets depending on their nonlinear behaviour in three different classes, which are clearly separated in a relativistic internal Mach number vs. Lorentz factor plot (Fig. 21). UST1 models are disrupted after a shock forms in the early post-linear phase, and ambient gas penetrates deep into the jet stream, decelerating and cooling the initial flow down. UST2 models are slowly decelerated by an efficient conversion of kinetic energy into internal energy, which causes momentum transfer and mixing. Finally, ST models present little expansion, but remain collimated and isolated from the ambient by a hot shear layer. ST models would fall into UST2, if resonant modes were not present, as occurs for model D20 in Paper II.
Our simulations admit a clear interpretation in the context of the morphological dichotomy of radio jets. Results presented here could point to high Lorentz factor, highly supersonic jets as forming FRII Class, whereas FRI jets would be related to slow, small Mach number jets. In the former, the generation of a hot shear layer surrounding a stable core could be related to the transversal structure observed in several powerful jets.
Acknowledgements.
The authors want to thank J.A. Miralles for clarifying discussions during the development of this work. Calculations were performed on the SGI Altix 3000 computer CERCA at the Servei d’Informàtica de la Universitat de València. This work was supported in part by the Spanish Dirección General de Enseñanza Superior under grant AYA-2001-3490-C02 and by the Polish Committee for Scientific Research (KBN) under grant PB 0656/P03/2004/26. M.H. acknowledges financial support from the visitor program of the Universitat de València. M.P. benefited from a predoctoral fellowship of the Universitat de València (V Segles program).References
- (1) Aloy, M.A., Gómez, J.L., Ibáñez, J.M, Martí, J.M, and Müller, E., 2000, ApJL, 528, 85
- (2) Aloy, M.A., Ibáñez, J.M, Miralles, J.A., Urpin, V., 2002, A&A, 396, 693
- (3) Attridge, J.M., Roberts, D.H., Wardle, J.F.C., 1999, ApJL, 518, 87
- (4) Baum, S.A., Zirbel, E.L., and O’Dea, C.P., ApJ, 1995, 451, 88
- (5) Bicknell, G.V., Proc. Astr. Soc. Austr., 1985, 6, 130
- (6) Biretta, J. A., Zhou, F., Owen, F. N., 1995, ApJ, 447, 582
- (7) Birkinshaw, M., MNRAS, 1991, 252, 505
- (8) Blandford, R.D., 1994, in ASP Conf. Ser., Vol. 54, Proc. 1st Stromlo Symp.: The Physics of Active Galaxies, Bicknell, G.V., Dopita, M.A., Quinn, P.J., eds., 23
- (9) Bodo, G., Massaglia, S., Ferrari, A., and Trussoni, E., A&A, 1994, 283, 655
- (10) Celotti, A., Blandford, R.D., 2001, in Proceedings of Black Holes in Binaries and Galactic Nuclei. Kaper, L., van den Heuvel, E.P.J., Woudt, A.P., eds., 206
- (11) De Young, D.S., 1993, ApJL, 405, 13
- (12) Ferrari, A., Massaglia, S., Trussoni, E., MNRAS, 1982, 198, 1065
- (13) Ghisellini, G., and Celotti, A., A&A, 2001, 379, L1
- (14) Gómez, J.L., Alberdi, A., and Marcaide, J.M., A&A, 1993, 274, 55
- Hanasz (1995) Hanasz, M., 1995, PhD Thesis, Nicholas Copernicus University, Toruń.
- (16) Hanasz, M., Sol, H. 1996, A&A, 315, 355
- Hanasz (1997) Hanasz, M., 1997, in Relativistic jets in AGNs, Ostrowski, M., Sikora, M., Madejski, G., Begelman, M., eds., Kraków, p. 85 (astro-ph 9711275)
- Hardee et al. (1998) Hardee, P.E., Rosen, A., Hughes, P.A., Duncan, G.C., 1998, ApJ, 500, 559
- (19) Hardee, P.E. 2000, ApJ, 533, 176
- (20) Hardee, P.E. 2001, in Gamma-Ray Astrophysics, Ritz, S., Gehrels, N., Shrader C.R., eds., 276
- (21) Hardee, P.E., Hughes, P.A., 2003, Astrophys. J., 583, 116
- (22) Koide, S., Shibata, K., Kudoh, T. 1998, ApJL, 495, 63
- (23) Komissarov, S.S., 1990, Ap&SS, 165, 313
- (24) Laing, R.A., 1996, IAUS, 175, 147
- (25) Laing, R.A., Bridle, A.H. 2002a, MNRAS, 336, 328
- (26) Laing, R.A., Bridle, A.H. 2002b, MNRAS, 336, 1161
- (27) Martí, J.M, Müller, E., 1996, JCP, bf 123, 1
- (28) Martí, J.M, Müller, E., Font, J.A., Ibáñez, J.M, and Marquina, A., 1997, ApJ, 479, 151
- (29) Meier, D.L., Godon, P., Edgington, S., Payne, D.G., Lind, K.R., 1998, in ASP Conf. Ser., Vol. 144, IAU Colloquium 164: Radio Emission from Galactic and Extragalactic Compact Sources, Zensus, J.A., Taylor, G.B., and Wrobel, J.M., eds., 51
- (30) Pearson, T.J., 1996, in Energy Transport in Radio Galaxies and Quasars, Hardee, P.E., Bridle, A.H., and Zensus, J.A., eds., 97
- (31) Perucho, M., Hanasz, M., Martí, J.M, and Sol, H., A&A, 2004, 427, 415
- (32) Perucho, M., Martí, J.M, and Hanasz, M., A&A, 2004, 427, 431
- (33) Perucho, M., Hanasz, M., Martí, J.M, and Miralles, J.A., 2005, in preparation
- Rosen et al. (1999) Rosen, A., Hughes, P.A., Duncan, G.C., Hardee, P.E. 1999, ApJ, 516, 729
- (35) Roy Choudhury, S., Lovelace, R.V.E., ApJ, 1984, 283, 331
- (36) Snellen, I., and Best, P., 2003, New Atron. Rev., 47, 225
- (37) Sol, H., Pelletier, G., Asseo, E., 1989, MNRAS, 237, 411
- (38) Stawarz, L., Ostrowski, M., 2002, ApJ, 578, 763
- (39) Swain, M.R., Bridle, A.H., and Baum, S.A., 1998, ApJ, 507, L29
- (40) Urpin, V. 2002, A&A, 385, 14
- (41) Wardle, J.F.C., and Aaron, S.E., 1997, MNRAS, 286, 425