-
Galaxy Groups: Proceedings from a Swinburne University Workshop
Abstract: We present the proceedings from a 2-day workshop held at Swinburne University on the 24th-25th of May 2005. The workshop participants highlighted current Australian research on both theoretical and observational aspects of galaxy groups. These proceedings include short 1-page summaries of a number of the talks presented at the workshop. The talks presented ranged from reconciling N-body simulations with observations, to the H i content of galaxies in groups and the existence of “dark galaxies”. The formation and existence of ultra-compact dwarfs in groups, and a new supergroup in Eridanus were also discussed.
Keywords: galaxies : clusters : general – methods : N-body simulations – cosmology : theory – dark matter – gravitation : catalogues – surveys – galaxies: photometry – radio lines: galaxies.
1 Introduction
The majority of galaxies in the Universe lie in groups (Tully 1987; Eke et al. 2004a). However, the physical processes operating in groups are poorly understood. For example, to what extent do gravitational interactions and the intra-group medium determine the morphology and star formation properties of galaxies residing in and around groups? Simulations of groups of galaxies have not been reconciled with the observations: In general, many more satellite galaxies are predicted than are seen in galaxy groups (e.g. Moore et al. 1999; Klypin et al. 1999).
Environment appears to play a key role in the evolution of galaxies. The star formation rate of galaxies in and around (out to 2-3 virial radii) clusters is lower than that of the field (Lewis et al. 2002; Gomez et al. 2003). The galaxy density at these radii are comparable to that of groups. There are several possible mechanisms for the star formation to be quenched such as removal of the gas via ram pressure stripping (Abadi, Moore & Bower 1999; Vollmer et al. 2001; Kenney, van Gorkum & Vollmer 2004), gravitational interactions (Toomre & Toomre 1972; Vollmer 2003; Bekki et al. 2005a,b), and galaxy mergers (Zabludoff & Mulchaey 1998). The latter two are more likely to occur in galaxy groups where the relative velocities of galaxies are lower. The observed drop in star formation rate at large cluster radii suggests that ram pressure stripping cannot be solely responsible, as this only occurs in the dense intra-cluster medium near the center of clusters. Thus the pre-processing of galaxies in groups might be one of the most important factors in their evolution.
Observations of neutral hydrogen (H i) in galaxy groups can provide information about the processes that have occurred in the groups. In particular, evidence of previous galaxy interactions is often present in the neutral hydrogen where none is obvious in the optical (e.g. M81; Yun, Ho & Lo 1994). In the dense cluster environment, ram pressure stripping of H i from gas-rich spiral galaxies is observed (e.g. Vollmer et al. 2001; Oosterloo et al. 2005), corresponding with the observation that spiral galaxies near the center of clusters tend to be H i deficient (Solanes et al. 2001). There is little corresponding data on the H i content of spiral galaxies in groups. The H i content of galaxies in compact groups tends to be deficient according to Verdes-Montenegro et al. (2001), while Stevens et al. (2004) find no evidence of H i deficiencies in this environment. The few studies of loose groups tend to support moderate H i deficiencies, caused by gravitational interactions (Kilborn et al. 2005; Omar & Dwarakanath 2005).
Gravitational interactions may also play a part in the formation of a new class of galaxies, the ultra-compact dwarfs (UCD). UCDs were first discovered in the Fornax cluster by Hilker et al. (1999) and Drinkwater et al. (2000), and while they are unresolved in ground-based optical images, their spectra show they are located at the cluster velocity. UCDs have luminosities between that of globular clusters and dwarf galaxies (Bekki et al. 2003). Bekki et al. (2003) proposed that UCDs were formed from galaxy “threshing” of dwarf galaxies, where the outer parts of the galaxy were tidally removed, leaving just the nucleus.
Our Swinburne University workshop addressed some of these current issues in galaxy groups, and summaries of nine of the presentations follow.
2 Formation of intergroup and intragroup stellar and gaseous objects
K. BekkiA
A School of Physics, University of New South Wales, Sydney, NSW 2052
We investigate the formation of apparently isolated H i gas and HII regions in group of galaxies based on gas dynamical simulations of disk galaxies in groups. Details on the disk galaxy models and TREESPH code adopted in the present study have already been described in Bekki et al. (2002) and Bekki et al. (2005a,b), so we give only a brief review here. We investigate the dynamical evolution of stellar and gaseous components (including globular clusters) in an interacting pair of late-type disk galaxies with the mass ratio smaller than 0.1 (with the larger disk similar to the Galaxy) in groups of galaxies. Star formation is modeled as the Schmidt law (Schmidt 1959) with the exponent of 1.5 and the threshold gas density for star formation (Kennicutt 1998) is also included. It is found that (1) massive isolated H i clouds with the masses of can be formed as a result of tidal stripping during galaxy-galaxy interaction in groups (Bekki et al. 2005a, b), (2) star formation can occur in some of these isolated H i gas clouds if the companion galaxies are more massive and have a larger amount () of gas initially before tidal interaction (Bekki et al. 2005a), and (3) intragroup GCs can be formed by tidal stripping (Yahagi & Bekki 2005).
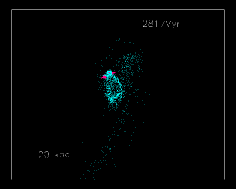
Figure 1 shows the final distributions of gas (cyan) and new stars (magenta) after tidal stripping of H i gas from the companion (the smaller galaxy) in the model with the larger disk mass of . The center of the frame coincides with the center of the larger galaxy and the companion galaxy has gone away from the larger one so that it can not be seen in this frame. It is clear from this figure that new stars can be formed in the denser part of the intragroup H i ring owing to tidal compression of the H i gas. Gaseous region around these new stars can be identified as intragroup HII regions as observed in NGC 1533 by Ryan-Weber et al. (2003). These results imply that galaxy-galaxy interaction and the resultant tidal stripping can be responsible for the formation of intragroup H i gas clouds and intragroup HII regions.
3 A Supergroup in 6dFGS
S. BroughA
A Centre for Astrophysics and Supercomputing, Swinburne University, Hawthorn, VIC 3122
Hierarchical structure formation leads us to presume that clusters of galaxies are built up from the accretion and merger of smaller structures like galaxy groups (e.g. Blumenthal et al. 1984). Although we observe clusters of galaxies forming along filaments and accreting galaxy group-like structures (e.g. Kodama et al. 2001) we lack clear examples of groups merging to form clusters - supergroups.
The Eridanus cloud lies at a distance of Mpc and includes two optically classified groups of galaxies, NGC 1407 and NGC 1332. These groups are part of the Group Evolution Multiwavelength Study (Osmond & Ponman 2004) in which their X-ray properties were analysed. The NGC 1407 group shows X-ray emission from intra-group gas, indicating the presence of a massive structure. In contrast, the X-ray emission from the NGC 1332 group is associated with NGC 1332 itself, not with intra-group gas. Omar & Dwarakanath (2005) suggest that there is intra-group gas associated with NGC 1395, however, no group has previously been associated with this galaxy.
At present there is some debate as to the nature of the Eridanus cloud, with Willmer et al. (1989) describing it as a cluster made up of three-four subclumps and Omar & Dwarakanath (2005) describing it as a loose group at an evolutionary stage intermediate to that of Ursa-Major and Fornax. The X-ray information suggests that these are distinct systems and a possible candidate for a supergroup.
To determine what this structure is, it was important to define which galaxies are associated with which structure. We obtained galaxy positions, velocities and -band magnitudes from the 6dFGS DR2 (Jones et al. 2005b) and, as 6dFGS is not yet complete, NED, catalogues for a circle of radius 15 degrees ( Mpc), centred on the position of NGC 1332, in the velocity range 500 – 2500 km s-1, obtaining 513 galaxies.
We then used the “friends-of-friends” (FOF; Huchra & Geller 1982) method to determine which galaxy was associated with which structure. Figure 2 shows that the FOF algorithm finds 3 distinct groups. The NGC 1407 and NGC 1332 groups are centred on the large ellipticals of the same name and their X-ray centroids. The Eridanus group is not centred on any large elliptical or the X-rays associated with NGC 1395.
It is possible to determine the dynamical parameters of these structures. Consistent with its X-ray information, NGC 1407 is a massive group of 19 galaxies with a high velocity dispersion, km s-1 and a low crossing time (), consistent with it being virialized. The NGC 1332 group has fewer galaxies (N = 10) but forms a compact structure with km s-1 and . The Eridanus group is made up of more galaxies (N = 31) but is a much looser, irregular structure. This is echoed in its low velocity dispersion, km s-1, and high crossing time, .
The NGC 1407 group is a massive group at a late stage in group evolution, whilst Eridanus and NGC 1332 appear to each be at an early stage of their evolution, suggesting that this is likely to be a supergroup.

We also examined the colours of the galaxies with respect to their density. The density was measured as the projected surface density of the 5 nearest neighbours to each galaxy within km s-1. -band magnitudes were obtained from HyperLEDA in order to calculate colours. The galaxies are redder in denser environments. The density at which this occurs is of the order Mpc-2, equivalent to that on the outskirts of this structure. This indicates that changes in galaxy properties are occuring at densities equivalent to those of galaxies currently infalling.
4 Hopcat and Isolated Dark Galaxies
M. T. DoyleA, M. J. DrinkwaterA, and D. J. RohdeA
A Department of Physics, University of Queensland, Brisbane, QLD 4072
4.1 Introduction
The blind HI Parkes All Sky Survey (Hipass), on the Parkes Radio Telescope was completed in 2000. This survey covers the whole of the southern sky up to Dec. = +2o. The Hipass Optical Catalogue (Hopcat) is based on the Hipass catalogue, (Hicat) (Meyer et al. 2004 & Zwaan et al. 2004), which represents the largest HI-selected catalogue at this time.
One motivation for the Hipass survey is to investigate the existance of dark galaxies. For the purposes of this paper we define a dark galaxy as any HI source that contains gas (and dark matter) but no detectable stars, and is sufficiently far away from other galaxies, groups or clusters such that a tidal origin can be excluded, i.e. isolated dark galaxies. For further details on Hopcat see Doyle et al. (2005).
4.2 Optical Galaxies for HICAT
To identify the optical galaxy match for each Hipass catalogue (Hicat) detection we use 1515 arcmin SuperCOSMOS images (Hambly et al. 2001a; Hambly, Irwin & MacGillivray 2001b; Hambly et al.2001c) to allow for uncertainity in the original Hipass position. However this creates a problem with matching the correct optical galaxy with its corresponding original Hipass detection due to multiple galaxies present in the majority of the images. To overcome this problem we cross check Hicat velocity measurements with optical and high resolution radio velocities from NED 111The NASA/IPAC Extragalactic Database (NED) is operated by the Jet Propulsion Laboratory, California Institute of Technology, under contract with the National Aeronautics and Space Administration. and the 6dF Galaxy Survey (6dFGS)(Wakamatsu et al. 2003) to validate the galaxy match choice.
An automated visual interactive program (Adric), where images centred on each Hipass source position are viewed by several people to minimises galaxy selection bias, has been developed. Adric utilizes the SuperCOS images, SExtractor image analysis (Bertin & Arnouts 1996), and NED and 6dFGS velocities for cross-checking, to reliably match Hicat HI sources with their optical counterparts. The results for the matching process are shown in Table 1. Hopcat contains optical galaxy choice categories that not only describe the type of optical galaxy match but the quality of the resulting magnitudes.
| Optical Galaxy Match Category | Percentage |
|---|---|
| Optically Matched with velocity | |
| Single Match | 42 |
| Compact group member | 16 |
| Optically Matched with no velocity | |
| Single Match | 20 |
| Compact group member | 6 |
| No Matches | |
| No Match; Multiple galaxies present | 11 |
| Blank Field; No visible galaxy | 5 |
4.3 Isolated Dark Galaxies
The selection criteria used to search for isolated dark galaxy candidates are extinction cut-off and the blank field category. We use an extinction cut at 1 mag as, beyond this extinction, optically faint galaxies will be dust obscured.
A total of 3692 galaxies have an extinction 1 mag, with only 13 galaxies also in the blank field category. From these, 11 are found to be in over-crowded fields. One object on close inspection does have a faint optical counterpart. The final dark galaxy candidate has recently been confirmed as a false HI detection.
Our conclusion is that from the 4315 HI radio detections in Hicat no isolated dark galaxies have been found.
4.4 Summary
We present the largest catalogue to date of optical counterparts for HI radio-selected galaxies, HOPCAT. Of the 4315 HI radio-detected sources from the HI Parkes All Sky Survey catalogue, we find optical counterparts for 3618 (84 per cent) galaxies. Isolated ‘Dark galaxy’ candidates are investigated using an extinction cut of 1 mag and the ’blank field’ optical galaxy match category. We conclude that there are no isolated optically dark galaxies present within the limits of the Hipass survey.
5 Ultra-Compact Dwarf Galaxies in Galaxy Groups
E. A. EvstigneevaA,B and Fornax Cluster Spectroscopic Survey team
A Department of Physics, University of Queensland, QLD 4072
UCDs were first identified by Hilker et al. 1999 (2 objects) and Drinkwater et al. 2000 (6 objects) during all-object spectroscopic survey of the Fornax cluster center. The compact objects found in these surveys, had velocities of cluster galaxies, but were unresolved in ground-based imaging. UCDs were subsequently identified in greater numbers through observations at fainter magnitudes in Fornax cluster (Drinkwater et al. 2004, Mieske at al. 2004) and Virgo cluster of galaxies (Jones et al. 2005b). Possible origins of UCDs include the following hypotheses: 1) they are luminous intra-cluster globular clusters; 2) they are extremely luminous star clusters formed from the amalgamation of stellar super-clusters that were created in galaxy interactions; 3) they are the remnant nuclei of stripped dwarf galaxies which have lost their outer parts in the course of tidal interaction with the galaxy cluster potential – threshing model; 4) they are highly compact galaxies formed in the early Universe.
The discovery of UCDs in the Fornax and Virgo clusters raises the following questions: 1) how common this type of object in clusters in general? 2) whether the local environment in a cluster affects their number densities or properties? 3) whether UCDs exist in less dense environments such as galaxy groups or in the field? To address these questions we have carried out a search for similar objects in a range of galactic environments.
We have chosen six galaxy groups at a redhift similar to that to the Fornax and Virgo clusters: Dorado, NGC1407, NGC0681, NGC4038, NGC4697, and NGC5084. We tried to select groups with a range of properties such as number of galaxies and dominant central galaxy type. If the threshing model is correct, the efficiency of UCD formation should scale with the depth of the galaxy cluster gravitational potential, characterised by the total mass/luminosity of the system or its dominant central galaxy (Bekki et al. 2003). Our sample includes both early and late type dominant central galaxies. It was interesting for us to explore not only higher density early-type environments such as e.g. Dorado and NGC1407, but also a low density spiral environment such as e.g. NGC0681. One of our selected groups, NGC4038, includes the famous Antennae system - colliding galaxies, and is very important in understanding UCDs as supermassive star clusters in interacting systems.
We have carried out a search for UCDs using the 2dF spectrograph on the Anglo Australian Telescope (AAT) in each group in a single 2 degree field centered on the group center of mass. To improve our chances of detecting UCDs in the limited observing time, we defined a subsample of objects loooking similar to bright Fornax and Virgo UCDs: they are unresolved in Schmidt photographic plates and have approximately the same luminosity range as bright Fornax and Virgo UCDs (-14 -11). We also applied a color cut bJ - r 1.7 as no UCDs have been found redder than bJ - r 1.5. We had two observing runs: in November 2004 and in April 2005. Radial velocities were determined through cross-correlation with an array of template spectra. Completeness varied from 24% to 75%.
We have found one object (UCD) in Dorado group with the velocity consistent with it lying in the group. No UCDs have been found in five other groups. We have made rough predictions for how many UCDs we can find in each group within the chosen luminosity range on the basis of the Fornax observations. We adopted two hypotheses: 1) the number of UCDs scales with the total luminosity of the system; 2) the number of UCDs scales with the luminosity of the brightest galaxy in group. The estimated numbers of UCDs turned out to be different from the observed ones, suggesting that both of the hypotheses are unlikely to be correct. However, this conclusion is very sensitive to the group distance modulus adopted.
The results presented here are very preliminary. At this point, our aim was just to see if we can find UCDs in galaxy groups. To test the models for the UCD origin, further observations are needed. We need to improve the completeness and to observe in a broader magnitude range to allow for the group distance uncertainties. Bright UCDs () do not seem to exist in large numbers in galaxy clusters and groups. Searches in a fainter magnitude range will increase the probability of finding UCDs. The new AAOmega spectrograph, replacing 2dF on the AAT, will be ideal for these purposes.
The author would like to thank her colleagues on the Fornax Cluster Spectroscopic Survey who were involved in this project: M. J. Drinkwater, R. Jurek, P. Firth, J. B. Jones, M. D. Gregg and S. Phillipps.
6 The GEMS Project and Collapsed Groups
D. A. ForbesA
A Centre for for Astrophysics & Supercomputing, Swinburne University, Hawthorn VIC 3122
6.1 GEMS
The Group Evolution Multiwavelength Study (GEMS) is a survey of 60 nearby groups. Using wide-field multiwavelength data and mock catalogues, we aim to better understand the evolution of galaxies in groups and groups themselves. The groups were selected to have deep ROSAT exposures at the location of a known (optical) group in the distance range 14 D 43 Mpc for Ho = 70 km/s/Mpc (see Osmond & Ponman 2004 for details). Thus the GEMS groups cover a range of group dynamical states. H i mapping of GEMS groups is discussed by Kilborn at this meeting, and Brough presents a dynamical study of two GEMS groups.
The motivation for this project comes from the fact that groups are poorly studied relative to clusters and yet contain most galaxies in the Universe. Recent large surveys like 2dF and SDSS have shown that star formation suppression occurs at group-like densities. But many questions remain: What is physical mechanism? What is the timescale?
A key property of galaxy groups is the virial radius. This can be calculated from the velocity dispersion of the galaxies or from the group Xray temperature (Osmond & Ponman 2004). The combination of H i mapping (e.g. McKay et al. 2004) and 6dFGS spectra have increased dramatically the number of confirmed group members We are now in a good position to compare the virial radii derived from velocity dispersion with those from Xray temperatures. Figure 1 shows an example for the NGC 5044 group (a massive group). The virial radius occurs at 0.75 Mpc for both methods. Note the number of group galaxies beyond 1 virial radius.
6.2 Isolated Galaxies
To better understand processes in groups we are also investigating isolated elliptical galaxies, to act as a control sample. We selected galaxies with T –3, D 130 Mpc, B 14 and then no neighbours within 700 km/s, 0.67 Mpc projected radius and 2 B mags (see Reda et al. 2004 for details). The aim is to understand their formation, ie are they old ‘primordial’ systems, recent mergers or collapsed groups?
Our optical imaging study indicated that some isolated galaxies appear relatively undisturbed while others have much ‘fine structure’ such as plumes and shells indicating a recent merger. Most isolated galaxies obey the cluster elliptical colour-magnitude and fundamental plane relations however again there were a few notable exceptions. These deviant galaxies tended to be ones with fine structure and evidence for young central stellar populations (Reda et al. 2005). A future work will examine the radial kinematics for isolated ellipticals (Hau & Forbes 2005, in prep.).
6.3 Collapsed Groups
The crossing times for some groups are much shorter than the age of the Universe. So if some groups have collapsed already, how would they appear? Simulations suggest that multiple mergers will result in a large, relatively isolated elliptical galaxy with a group-like Xray halo (the hot gas cooling time is generally longer than the age of the Universe). Do any of our isolated galaxies look like collapsed groups?
Our typical isolated galaxy has MB = –20.5 (and LX/LB = 30), which is too low luminosity to be an entire group. One potential collapsed group is NGC 1132 with MB = –22.0, LX/LB = 32 and over 2 B mags brighter than the second ranked galaxy. It has an old stellar population and is featureless, suggesting any merger/collapse happened along time ago.

7 Where is the H i in Galaxy Groups?
V. A. KilbornA
A Centre for Astrophysics and Supercomputing, Swinburne University, Hawthorn, VIC 3122
7.1 The GEMS H i Survey
Deep wide-field neutral hydrogen observations of galaxy groups can help us understand the evolution and formation of galaxies within groups. The existence of H i tails and bridges provide evidence of previous interactions, and the H i content of galaxies can tell us about their history. However it is only with the advent of multibeam receivers in the last ten years that such surveys are now possible. While HIPASS surveyed the whole southern sky for H i (Meyer et al. 2004) its sensitivity for detecting low mass galaxies was limited to the local volume. Thus to more thoroughly explore the H i content of groups, we have conducted further wide-field H i observations of 16 groups in the Group Evolution Multiwavelength Study (GEMS; see Forbes, this meeting for a full description). The H i observations were made at the Parkes radiotelescope, using the multibeam receiver. An area of degrees was observed around each group center. The observations are about twice as deep as HIPASS, and the velocity resoltution is ten times that of HIPASS. The sensitivity of the H i survey is , depending on the distance to the group.
7.2 Results
We detected 210 H i sources in the 16 datacubes. The positions of the H i sources were cross correlated with both the NED database, and the 6dFGRS (Jones et al. 2005). We found the majority of the H i detections corresponded with one or more previously optically catalogued galaxies, often with known redshifts. We also found fourteen H i detections that do not match with previously catalogued galaxies. A further eight H i detections provided the redshift for previously catalogued galaxies, thus the total number of new group members accross the 16 groups was 22. In some groups, there has been an addition of up to 50% of known group members, when adding in the new H i and 6dFGS redshifts.
Optical images of the 14 new H i sources were obtained from the digital sky survey (DSS). The majority of the new detections could be tentatively matched with a visible optical galaxy, however there were four cases where there was no obvious optical counterpart on the DSS images. We have obtained high resolution H i images from the ATCA for one of these H i sources, GEMS_NGC3783_12, in the NGC 3783 galaxy group. The structure of this object is reminiscant of a tidal H i cloud, as it is irregular and has a tail. The formation of this object is uncertain, and we find no H i bridge to any optical galaxy to the sensitivity of the datacube (). The cloud is 50 kpc in size, and has an H i mass of . There is one further H i cloud candidate in the NGC 3783 group, and we have two more candidates in the NGC 5044 galaxy group. ATCA observations of these H i cloud candidates are scheduled for January 2006.
We have begun to investigate the H i content of the group galaxies, and whether H i deficiencies are seen similar to that in clusters (Solanes et al. 2001) and compact groups (Verdes-Montenegro et al. 2001). We have looked at one group in depth, NGC 1566. We find the total H i content of the group is consistent with the optical members of the group. However two galaxies are about ten times more H i deficient than would be expected from their optical type and size (Kilborn et al. 2005). There is no diffuse x-ray emission in this galaxy group, and the H i deficient galaxies do not lie near the centre of the group, thus we expect the H i deficiency is caused by tidal stripping of the gas by either the group potential or other galaxies.
We can place some limits on the existence of intra-group neutral hydrogen, down to the sensitivity of our survey. Such intra-group H i is rare, and makes up less than 2% of the H i detections we found in our survey. However, our survey cannot place limits on the number of low-mass H i galaxies in groups.
So to answer the question “Where is the H i in galaxy groups” we can say that to the limit of , it is mostly contained within galaxies, and H i clouds, tidal tails and H i bridges add only a small part to the total H i content of galaxy groups.
| No. of groups observed | 16 |
| Total galaxies detected | 210 |
| Previously uncatalogued | 14 |
| New Redshifts | 8 |
| Confirmed H i clouds | 1 |
| Total new group members | 22 |
I acknowledge the GEMS team for the general survey, and thank Heath Jones for supplying the 6dF data.
8 Neutral hydrogen in the M 83 galaxy group
B. S. KoribalskiA
AAustralia Telescope National Facility, CSIRO,
P.O. Box 76, Epping, NSW 1710
ATCA and Parkes H i line observations of the grand design spiral galaxy
M 83 (NGC 5236) reveal a very extended H i distribution with a diameter
of 100 kpc, several times larger than the optical Holmberg radius.
While the inner disk of M 83 rotates remarkably regular, the H i gas
dynamics appear increasingly peculiar towards the outer regions which show
clear signs of tidal disruption. The most prominent tidal features are the
asymmetric outer H i arm bending towards the east of M 83 and a spectacular
stellar stream, consisting of mainly old stars, to the north. M 83 is
surrounded by numerous dwarf galaxies and, given its large dynamical mass,
is likely to attract and accrete them in regular intervals.
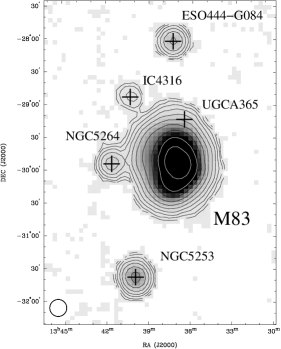
M 83 (NGC 5236; HIPASS J1337–29) is a late-type spiral galaxy with an unusually large H i envelope of 100 kpc (for = 4.5 Mpc), at least five times larger than its optical Holmberg diameter. It is a member of the nearby Centaurus A group which appears to consist of two subgroupings, one around M 83 and the other around Cen A (NGC 5128). Figure 4 shows the deep Parkes multibeam HI data of the M 83 subgrouping; no low-surface brightness H i extensions were detected between M 83 and its neighbouring galaxies down to an H i column density limit of atoms cm-2 (assuming the H i gas fills the beam).
The H i distribution of M 83, as revealed with the Australia Telescope Compact Array (Koribalski et al. 2005, in prep.) is most remarkable. No longer does this grand-design spiral look regular and undisturbed. The H i maps show streamers, irregular enhancements, an asymmetric tidal arm, diffuse emission, and a thoroughly twisted velocity field, much in contrast to its regular appearance in short-exposure optical images. M 83’s H i distribution is enormous, several times larger than its stellar disk. It is also a rather massive galaxy, mildly interacting with the neighbouring dwarf galaxies. The effect of this interaction on the dwarfs can of course be rather devastating. It is indeed quite likely that M 83 has accreted dwarf galaxies in the past. The overall impression of M 83 in the high-resolution H i images is that of a distorted one-armed spiral, indicating that it may have interacted or merged with another, smaller galaxy. While the velocity field in this extended arm appears to follow the general pattern of rotation, the gas distribution shows numerous irregularities, clumps and bifurcations.
The eastern-most H i emission of M 83 which forms part of its peculiar, outer arm lies (45 kpc) away from the center of M 83. We note that the dwarf irregular galaxy NGC 5264 lies at a projected distance of only (33 kpc) from the eastern H i edge of M 83. Given that the independently measured distances to M 83 and NGC 5264 are very similar, both galaxies are likely to be interacting.
9 Environmental Analysis of local Starburst Galaxies Selected from the 2dFGRS
M. S. OwersA, C.A. BlakeB, W.J. CouchA, M.B. PracyA and K. BekkiA
A School of Physics, University of New South Wales, Sydney, NSW 2052
B Department of Physics and Astronomy, University of British Columbia, 6224 Agricultural Road, Vancouver, B.C., V6T 1Z1, Canada
Starburst galaxies are thought to be the progenitors of the rare ‘E+A’ galaxies (or post-starburst galaxies). Blake et al. (2004) have used the 2dFGRS (Colless et al. 2001, 2003) to study the environment of a sample of nearby ‘E+A’ galaxies. In order to further constrain triggering/cessation mechanisms for starbursts, we follow the Blake et al. study and conduct an environmental analysis on a starburst sample selected from the 2dFGRS.
We use the 2dFGRS spectral line catalogue (Lewis et al. 2002) to select a sample of starburst galaxies. We use only high quality spectra from which we select emission line galaxies with well detected lines. The Baldwin, Phillips and Terlevich (BPT; Baldwin, Phillips, & Terlevich (1981)) line ratio diagram was used to differentiate between galaxies where emission is dominated by star formation from those dominated by AGN activity. We use the AGN-starburst demarcation line (Kauffmann et al. 2003) to exclude AGN and define a star-forming sample. From this star-forming sample we need to select a starburst sample, defined as galaxies having normalised star formation rates (SFR; see Lewis et al. (2002)) greater than 10 . We perform an environmental analysis on this sample including the distance to near-neighbours, projected surface densities, group membership, correlation with the remaining 2dFGRS galaxies and the luminosity function. The analyses are also performed on a random sample of 2dFGRS galaxies which act as a benchmark for comparison to our starburst sample.
The near neighbour (NN) analysis involves finding the transverse separation of the starburst and its nearest faint and bright neighbours. A faint NN is defined as a galaxy with b*(z)+1 22.5 where b*(z) is the apparent magnitude an M* (, Norberg et al. (2002)) galaxy would appear as at the redshift of the starburst and is the apparent magnitude of the faint NN. A bright NN is defined as a galaxy with b*(z)+1 22.5. The transverse separation was measured from the starburst to the nearest faint and bright neighbours, with the NN distance distributions plotted. The Kolmogorov-Smirnov statistic is used to determine if the random and starburst NN distributions are drawn from the same parent distribution. The K-S probabilities measured for both the faint and bright NN distributions are extremely small, meaning it is highly unlikely that they are drawn from the same parent distribution as the random sample. Since low K-S probabilities indicate a large difference in two distributions, we can say the faint and bright NN distributions are quite different from the random sample distributions. This means a near NN may play a significant role in triggering a starburst, particularly within 20kpc for a faint NN and 60kpc for a bright NN.
The projected surface density analysis involved measuring the transverse distance to the fifth nearest bright (as defined above) neighbour and deriving a surface density from this. The surface density distribution is compared to the random sample, with the K-S test showing a vanishingly small probability the random and starburst samples are drawn from the same parent distribution. The K-S test again shows the starburst and random samples differ significantly, with starbursts showing a difference at higher projected surface densities meaning tidal interactions with many NN may be significant in triggering a starburst.
The cross-correlation with the remaining 2dFGRS galaxies involved measuring the overdensity within comoving spheres of radius 3-15 Mpc around the starburst galaxy. We compared the starburst sample to a random sample and an elliptical galaxy sample. The starburst sample inhabits less dense regions than both the random and elliptical samples on all scales . This is consistent with the well known observation that star formation is suppressed in the cores of clusters.
We cross correlate our starburst sample with the Eke et al. (2004a) 2PIGG catalogue and determine the corrected total group luminosity (see Eke et al. (2004b)) for each group containing a starburst. We find that the starburst galaxies tend to inhabit groups with total luminosities lower than that of the random sample. That is, starbursts tend to reside in lower mass groups and avoid rich groups/clusters.
The luminosity function was measured and compared to the whole 2dFGRS luminosity function. It was found that our starburst galaxies are preferentially less luminous than the 2dFGRS sample as a whole.
We conclude that: starburst reside in low density environments, the nearest neighbour may play a role in triggering a starburst whilst many near neighbours may also induce a burst through tidal interactions and our starbursts are generally low luminosity objects.
10 The Subhalo Mass Function in Galaxy Clusters : Another Success for the Cold Dark Matter Model?
C. PowerA and Brad K. GibsonA
A Centre for Astrophysics and Supercomputing, Swinburne University, Hawthorn, VIC, 3122
One of the defining characteristics of the Cold Dark Matter (CDM) model is the hierarchical manner in which massive systems are assembled through the merging and accretion of less massive progenitors. However, this merging process is incomplete and the remnant subhaloes constitute of the virial mass in a typical CDM halo, following a power-law mass function, with the subhalo mass (Gao et al. 2004a).
In a recent study, Natarajan & Springel (2004) (NS04) have combined strong and weak lensing observations of a sample of five rich clusters taken from Natarajan et al. (2004) to construct an averaged mass function of the host dark matter halos of the most massive cluster galaxies. They compared this averaged mass function with the subhalo mass function derived from the cluster simulations of Springel et al. (2001), who studied a single rich CDM cluster simulated at progressively higher mass and force resolution; the best resolved contained million particles within the virial radius. The authors claimed good agreement between the amplitudes and slopes of the respective mass functions over the mass range , and concluded that such concordance provided further observational evidence in favour of the CDM model.
We have investigated the significance of this claim by analysing a sample of eleven rich cluster mass CDM haloes, each resolved with million particles. In contrast to NS04, we find that subhalo mass functions derived from simulated cluster haloes disagree with the mass functions derived from lensing observations in a systematic manner, as can be seen in figure 5. If we consider subhaloes within a projected radius of kpc from the centre of the simulated cluster222Comparable to Natarajan et al. (2004), we find that the number of a given mass (solid histogram) underestimates the number of cluster galaxy haloes (hatched histogram) by a factor of over the range of overlap. Agreement between observationally derived and simulated mass functions is possible only if we consider all subhaloes within the virial radius of the host (dotted histogram).

How significant is this discrepancy for the CDM model? Recent studies
have demonstrated that galaxies and subhaloes represent different
populations with distinct spatial and kinematic distributions, and
should not be directly compared (Gao et al. 2004b). Therefore, it is
unclear that the discrepancy is significant at all without a proper treament
of the galaxy formation process. This is very much work in progress!
We warmly thank the Virgo Consortium, Alexander Knebe and Stuart Gill for the use of their simulated clusters.
References
- Abadi, Moore & Bower (1999) Abadi, M. G., Moore, B., Bower, R. G. 1999, MNRAS, 308, 947
- Baldwin, Phillips, & Terlevich (1981) Baldwin, J., Phillips, M., Terlevich, R., 1981, PASP, 93, 5
- Bertin & Arnouts (1996) Bertin, E., Arnouts, S., 1996, A&AS, 117, 393
- Bekki et al. (2002) Bekki, K., Forbes, D. A., Beasley, M. A., Couch, W. J. 2002, MNRAS, 335, 1176
- Bekki et al. (2003) Bekki, K., Couch, W.J., Drinkwater, M.J., Shioya, Y. 2003, MNRAS, 344, 399
- Bekki, K. et al. (2005) Bekki, K., Koribalski, B. S., Ryder, S. D., Couch, W. J. 2005a, MNRAS, 357, L21
- Bekki, Koribalski & Kilborn (2005) Bekki, K., Koribalski, B. S., Kilborn, V. A. 2005b, MNRAS, in press, (astro-ph/0505580)
- Blake et al. (2004) Blake, C. A. et al., 2004, MNRAS, 355, 713
- Blumenthal et al. (1984) Blumenthal, G. R., Faber, S. M., Primack, J. R., Rees, M. J., 1984, Nature, 311, 517
- Colless et al. (2001) Colless, M., et al. 2001, MNRAS, 328, 1039
- Colless et al. (2003) Colless, M., et al. 2003, astro-ph/0306581 De Lucia G., Kauffmann G., Springel V., White S. D. M., Lanzoni B., Stoehr F., Tormen G. & Yoshida N. 2004, MNRAS, 348, 333
- Doyle et al. (2005) Doyle, M. T., et al., 2005, MNRAS, 361, 34
- Drinkwater et al. (2000) Drinkwater, M.J., Jones, J.B., Gregg, M.D., Phillipps, S. 2000, PASA, 17, 227
- Drinkwater et al. (2004) Drinkwater, M.J., Gregg, M.D., Couch, W.J., et al. 2004, PASA, 21, 375
- Eke et al. (2004a) Eke, V. R. et al., 2004a, MNRAS, 348, 866
- Eke et al. (2004b) Eke, V. R. et al., 2004b, MNRAS, 355, 769
- Gao et al. (2004a) Gao, L., White, S. D. M., Jenkins, A., Stoehr, F. & Springel, V. 2004a, MNRAS, 355, 819
- Gao et al. (2004b) Gao, L., De Lucia, G., White, S. D. M. & Jenkins, A. 2004b, MNRAS, 352, L1
- Gomez et al. (2003) Gomez, P. L. et al. 2003, ApJ, 584, 210
- Huchra & Geller (1982) Huchra, J. P., Geller, M. J.,1982, ApJ, 257, 423
- Hambly et al. (2001) Hambly, N. C., Davenhall, A. C., Irwin, M. J., MacGillivray, H. T., 2001a, MNRAS, 326, 1315
- Hambly, Irwin, & MacGillivray (2001) Hambly, N. C., Irwin, M. J., MacGillivray, H. T., 2001b, MNRAS, 326, 1295
- Hambly et al. (2001) Hambly, N. C., et al., 2001c, MNRAS, 326, 1279
- Hilker et al. (1999) Hilker, M., Infante, L., Viera, G., et al. 1999, A&AS, 134, 75
- Jones et al. (2004) Jones, D. H., Saunders, W., Colless, M. et al., 2004, MNRAS, 355, 747
- Jones et al. (2005) Jones, D. H., Saunders, W., Read, M., Colless, M., 2005a, astro-ph/0505068
- Jones et al. (2005) Jones, J.B., Drinkwater, M.J., Jurek, R., et al. 2005b, MNRAS, in press
- Kauffmann et al. (2003) Kauffmann, G. et al., 2003, MNRAS, 346, 1055
- Kenney, van Gorkum & Vollmer (2004) Kenney, J. D. P., van Gorkum, J. H., Vollmer, B. 2004, AJ, 127, 3361
- Kennicutt (1998) Kennicutt, R. C., Jr. 1998, ARA&A, 36, 189
- Kilborn et al. (2005) Kilborn, V. A., Koribalski, B. S., Forbes, D. A., Barnes, D. G., Musgrave, R. C. 2005, MNRAS, 356, 77
- Klypin et al. (1999) Klypin, A., Kravtsov, A. V., Valenzuela, O., Prada, F. 1999, ApJ, 522, 82
- Kodama et al. (2001) Kodama, T., Smail, I., Nakata, F., Okamura, S., Bower, R. G. 2001, ApJL, 562, 9
- Lewis et al. (2002) Lewis, I. et al., 2002, MNRAS, 334, 673
- McKay et al. (2004) McKay, N., et al. 2004, MNRAS, 352, 1121
- Meyer et al. (2004) Meyer, M. J., et al. 2004, MNRAS, 350, 1195
- Mieske et al. (2004) Mieske, S., Hilker, M., Infante, L. 2004, A&A, 418, 445
- Moore et al. (1999) Moore, B., Ghigna, S., Governato, F., Lake, G., Quinn, T., Stadel, J., Tozzi, P. 1999, ApJ, 524, 19
- Natarajan et al. (2004) Natarajan, P., Kneib, J., Smail, I. & Ellis, R. 2004, preprint (astro-ph/0411426)
- Natarajan & Springel (2004) Natarajan, P. & Springel, V. 2004, ApJ, 617, L13 (NS04)
- Norberg et al. (2002) Norberg, P. et al., 2002, MNRAS, 336, 907
- Omar & Dwarakanath (2005) Omar, A. & Dwarakanath, K. S., 2005, JApA, 26, 1
- Oosterloo & van Gorkum (2005) Oosterloo, T., van Gorkum, J. 2005, A&A, 437, 190
- Osmond & Ponman (2004) Osmond, J. P. F., Ponman, T. J., 2004, MNRAS, 350, 1511
- Reda et al. (2004) Reda, F., Forbes, D., Beasley, M., O’Sullivan, E., Goudfrooij, P., 2004, MNRAS, 354, 851
- Reda, Forbes & Hau (2005) Reda, F., Forbes, D., Hau, G., 2005, MNRAS, in press
- Ryan-Weber, Webster & Bekki (2003) Ryan-Weber, E., Webster, R., Bekki, K. 2003, in ‘The IGM/Galaxy Connection: The Distribution of Baryons at z=0’, ASSL Conference Proceedings Vol. 281, eds. J. L. Rosenberg and M. E. Putman, Kluwer Academic Publishers, Dordrecht, p. 223
-
Schmidt (1959)
Schmidt, M. 1959, ApJ, 129, 243
- Solanes et al. (2001) Solanes, J. M., Manrique, A., Garc a-G mez, C., Gonz lez-Casado, G., Giovanelli, R., Haynes, M. P. 2001, ApJ, 548, 97
- Springel et al. (2001) Springel, V., White, S. D. M., Tormen, G. & Kauffmann, G. 2001, MNRAS, 328, 726
- Stevens et al. (2004) Stevens, J. B., Webster, R. L., Barnes, D. G., Pisano, D. J., Drinkwater, M. J. 2004, PASA, 21, 318
- Toomre & Toomre (1972) Toomre, A. & Toomre, J. 1972, ApJ, 178, 623
- Tully (1987) Tully, R. B. 1987, ApJ, 321, 280
- Verdes-Montenegro et al. (2001) Verdes-Montenegro, L., Yun, M. S., Williams, B. A., Huchtmeier, W. K., Del Olmo, A., Perea, J. 2001, A&A, 377, 812
- Vollmer et al. (2001) Vollmer, B., Cayatte, V., Balkowski, C., Duschl, W. J. 2001, ApJ, 561, 708
- Vollmer (2003) Vollmer, B. 2003, A&A, 398, 525
- Wakamatsu et al. (2003) Wakamatsu, K., Colless, M., Jarrett, T., Parker, Q., Saunders, W., Watson, F., 2003, ASPC, 289, 97
- Willmer et al. (1989) Willmer, C. N. A., Focardi, P., da Costa, L. N. & Pellegrini, P. S., 1989, AJ, 98, 1531
-
Yahagi & Bekki (2005)
Yahagi, H, Bekki, K., 2005, submitted to ApJL.
- Yun, Lo & Ho (1994) Yun, M. S., Ho, P. T. P, Lo, K. Y. 1994, Nature, 372, 530
- Zwaan et al. (2004) Zwaan, M. A., et al., 2004, MNRAS, 350, 1210