HOT POPULATIONS IN M87 GLOBULAR CLUSTERS
Abstract
To explore the production of UV-bright stars in old, metal rich populations like those in elliptical galaxies, we have obtained HST/STIS far- and near-UV photometry of globular clusters in four fields in the gE galaxy M87. To a limit of we detect a total of 66 globular clusters (GCs) in common with the deep HST optical-band study of Kundu et al. (1999). Despite strong overlap in V- and I-band properties, the M87 GCs have UV/optical properties that are distinct from clusters in the Milky Way and in M31. M87 clusters, especially metal-poor ones, produce larger hot HB populations than do Milky Way analogues. In color plots including the NUV band, the M87 clusters appear to represent an extension of the Milky Way sequence. Cluster mass is probably not a factor in these distinctions.
The most metal-rich M87 GCs in our sample are near solar metallicity and overlap the local E galaxy sample in estimated Mg2 line indices. Nonetheless, the clusters produce much more UV light at a given Mg2, being up to 1 mag bluer than any gE galaxy in color. The M87 GCs do not appear to represent a transition between Milky Way-type clusters and E galaxies. The differences are in the correct sense if the clusters are significantly older than the E galaxies.
Comparisons with Galactic open clusters indicate that the hot stars lie on the extreme horizontal branch, rather than being blue stragglers, and that the EHB becomes well populated for ages Gyr. Existing model grids for clusters do not match the observations well, due to poorly understood giant branch mass loss or perhaps high helium abundances.
We find that 43 of our UV detections have no optical-band counterparts. Most appear to be UV-bright background galaxies, seen through M87. Eleven NUV variable sources detected at only one epoch in the central field are probably classical novae. Two recurrent variable sources have no obvious explanation but could be related to activity in the relativistic jet.
1 Introduction
1.1 Hot Stars in Elliptical Galaxies
Ultraviolet observations from space have shown that old stellar populations are prolific producers of hot stars. Elliptical galaxies and large spiral bulges exhibit an unexpected “ultraviolet-upturn” or “excess” (UVX), a sharp rise in flux at wavelengths shorter than 2000 Å, which is produced by stars with temperatures of K (Code 1969, Burstein et al. 1988, Greggio & Renzini 1990, Brown et al. 1997, O’Connell 1999, and references therein).
The UV upturn is the most variable photometric feature of old populations: UV to optical flux ratios vary by a factor of 100, a much larger range than for optical-IR colors (Faber 1983; Burstein et al. 1988; Dorman, O’Connell, & Rood 1995, hereafter DOR95). The first large survey of the UVX in nearby galaxies, based on observations with the International Ultraviolet Explorer (IUE), appeared to show a good correlation between its strength and metal abundance as measured by the Mg2 index at 5170 Å . A more extensive recent survey from the Galaxy Evolution Explorer (GALEX, Martin et al. 2003) by Rich et al. (2005) confirms the enormous range in UV:optical flux ratios but finds no correlation between UV properties and metallicity.
This remarkable variation in UV light has led to the expectation that the UVX could be a uniquely sensitive probe of the star formation and chemical enrichment histories of elliptical galaxies. If it can be calibrated, the UV upturn would be an important test, for instance, of the formation times of distant elliptical galaxies, since preliminary models (Greggio & Renzini, 1990; Bressan, Chiosi, & Tantalo, 1996; Yi et al., 1999) imply that it will only appear in systems 5 Gyr or older. The Hubble Space Telescope (HST) and GALEX have already detected a UVX at redshifts of (Brown et al., 1998, 2000a, 2003) and (Lee et al., 2005a), respectively.
We believe we know the kinds of stars responsible for the UVX (reviewed in O’Connell 1999). UV imaging and spectroscopy from the Astro missions provided good evidence that old, low-mass stars on the “extreme” horizontal branch (EHB), with K, and their hot descendents produce the upturns. We also understand the basic physics of the hot evolutionary phases. The EHB stars have very small envelope masses (), and smaller envelopes produce hotter objects. Differences of as little as 0.01 M⊙ can have large effects. Hence, the net UV output of an EHB population is governed mainly by envelope mass loss processes on the red giant branch and by the helium abundance. In turn, mass loss efficiency is strongly linked to age (older stars have smaller envelopes to lose) and metal abundance (mass loss is likely enhanced at higher metallicites by radiation pressure on grains and molecules). Less than 20% of the evolving population in the galaxies need to pass through the hot phase to match the observations.
What we do not yet understand is how the parent population’s global characteristics (age, helium abundance, metal abundances, dynamics) determine the distribution of EHB temperatures and hence the strength and shape of the upturns. Observations of globular clusters (GCs) undoubtedly offer the best means of clarifying these global effects. GCs are the best understood stellar systems from the standpoint of evolution, and they are (mostly) simple stellar populations with a small internal dispersion in age and abundance.
Unfortunately, the available UV data on GCs are limited and hard to interpret, and the Galactic GC sample does not overlap the galaxies in metallicity as measured by Mg2 (summarized by DOR95). Some globulars have total UV-star fractions (as indicated by their colors) that rival those of any elliptical galaxy. However, the UV fractions are largest for moderately metal-poor clusters (with [Fe/H] ), such as Cen (Whitney et al., 1994) and NGC 6752 (Landsman et al., 1996). There is large scatter at all metallicities and no strong trend with metallicity (although the UV sample is far from complete). Meanwhile, the recent GALEX observations by Rey et al. (2005) show that the far-UV properties of M31 GCs are similar to those of MWGCs. By contrast, the UV fractions among nearby galaxies in the IUE sample appear to increase strongly with metallicity. Such differences in behavior could be linked to differences in age or helium abundance or to other factors influencing the EHB, such as the dynamical environment (e.g. Paresce et al. 1991, Fusi-Pecci et al. 1993, Bailyn 1995, Sweigart 1997).
There is a critical gap in metallicity between the most metal-rich of the observed Milky Way globulars and the bulk of elliptical galaxies. This corresponds to Mg2 values in the range 0.1–0.3 (see Figure 1 of DOR95 or Figure 8 below). An obvious next step is to fill in this gap with clusters of higher metallicity. Such objects are rare in our Galaxy and also difficult to study because they tend to be preferentially situated in regions with large UV extinction. Where data have been obtained on metal-rich Galactic globulars, there is a large dispersion: 47 Tuc has a definite but small EHB population (O’Connell, 1997) while NGC 6388 and 6441 have rich EHB populations (Rich et al., 1997). A small EHB component is present in the high metallicity open clusters NGC 188 and NGC 6791 (Liebert, 1994; Landsman et al., 1998). But overall the Milky Way is not a fertile terrain for investigating the UV behavior of metal-rich clusters.
To enlarge the sample of metal rich objects that can link globular cluster populations to those in galaxies, we must instead turn to the large cluster systems of giant elliptical galaxies.
1.2 The M87 Globular Cluster System
Giant elliptical galaxies possess enormous populations of GCs, many of which have high metal abundances. Hundreds of such globulars in elliptical galaxies in the Virgo cluster have . These systems are essentially free of foreground extinction, with . Among the Virgo galaxies, M87 has the largest and best studied GC system. Numerous, faint point sources around M87 were first identified as globular clusters by Baum (1955). Early photographic studies showed that the GCs in M87 are on average bluer than the galaxy background (Racine, 1968) and that the mean color of the clusters has a radial trend such that clusters become bluer as radial distance increases (Strom et al., 1981). The radial dependence of mean color was later confirmed by the CCD observations of Lee & Geisler (1993) and Cohen, Blakeslee, & Ryzhov (1998).
Kundu et al. (1999; hereafter K99) studied the GC system in the inner region of M87 using images taken with the HST WFPC2 camera. Their sample, over a thousand clusters, allowed them to investigate the luminosity function, the optical color distribution, and structural information. An important result is the presence of bimodality in the optical color distribution. Bimodality of GC systems in early-type galaxies was first (statistically) studied by Zepf & Ashman (1993). Recent studies of HST archival data (Kundu & Whitmore 2001a, Larsen et al. 2001) have shown that bimodal color distributions are present in at least 30% and up to 60% of early-type GC systems. Several models have been proposed to explain the observed bimodal cluster groups: major mergers of late-type galaxies (Ashman & Zepf, 1992, 1998), two bursts of in situ star formation (Forbes, Brodie, & Grillmair, 1997), and hierarchical formation (Côté, Marzke, & West, 1998).
The goal of this study is to determine how the M87 metal-rich clusters compare to the Galactic globulars and the elliptical galaxies in their UV color properties. Among the observational questions of particular interest are these: (1) Does the M87 cluster system overlap in UV properties with the Galactic system or is it distinct? (2) Does the M87 cluster system overlap with the E galaxies? (3) Does the M87 system represent a transition between Milky Way-type clusters and the galaxies? (4) Are secondary dependencies found in UV properties, e.g. a dependence on galactocentric radius at a given metallicity? (5) Do the UV properties of the two M87 cluster subsystems differ?
We have obtained near- and far-UV photometry of M87 globular clusters using the imaging mode of the HST Space Telescope Imaging Spectrograph (STIS) to answer these questions. In the next section we describe our observations and reductions and our far-UV detection rate. Subsequent sections discuss interpretation of the resulting photometry, comparison to the globular clusters in the Milky Way and M31, the absence of radial trends in our photometry, comparison to elliptical galaxies, comparison to existing model grids for clusters, possible selection effects, and the surprisingly large sample of “UV-only” sources we detect.
2 Observations and Data Reduction
2.1 Observations
The data used in this study consist of HST/STIS far- and near-UV images of four different fields in the inner () region of M87. At our adopted distance modulus of (Whitmore et al., 1995) for M87, this region corresponds to kpc. Figure 1 shows the location of the far- and near-UV fields superposed on the median-subtracted WFPC2 image of K99. The fields are labeled from 1 to 4, and we use these designations throughout this paper.
Fields 1, 2, and 3 were observed with the HST/STIS far-UV camera in HST Program GO-8643 (PI: R. O’Connell). This camera has a field of view of 25″25″with 0.024″pixels. Total exposure time was 10,480 s for each field. The far-UV camera employs a multianode micro-channel array (MAMA) which has no readout noise and little sensitivity to cosmic rays. Since the long wavelength cutoff is determined by the rapidly decreasing detector sensitivity longward of 2000Å, red leaks are negligible. We used the F25SRF2 longpass filter (1270 – 2000 Å, pivot wavelength 1460 Å) to extend the bandwidth of our images as far to the blue as possible while avoiding the strong geocoronal Lyman- emission at 1216 Å. The FUV-MAMA/F25SRF2 combination admits the dayglow emission lines of O I (1302, 1356 Å), which create a relatively bright sky background. However, the O I features are strongly variable in both time and geographic latitude, and their strength cannot be confidently predicted in advance. Therefore, instead of restricting our observing periods to orbital night by using the SHADOW TIME special requirement, we observed in TIMETAG mode. In this observing mode, the data consist of a stream of time-tagged photon events and X/Y coordinates. Periods of bright dayglow emission can be rejected during the subsequent data reduction, thereby making best use of available low dayglow periods.
We also obtained three optical band images centered on the same positions as the far-UV frames of Fields 1, 2, and 3, using the STIS CCD and F28X50LP (5500 – 11000 Å, pivot wavelength 7230 Å) filter. These images were obtained mainly to verify pointings of our targets. Each CCD image has a field of view of 50″50″ of which only the central 28″50″ is usable due to the size of the filter. All three far-UV fields fall on the usable area of the CCD. The exposure time for the CCD observations was 518 seconds for each field.
Observations of Field 4 were taken from the STScI/HST Archive111http://archive.stsci.edu. These included a total of four far-UV and sixteen near-UV images. The relevant observations are those of HST Programs GO-8048, -8140, -8780, and -9461 (PI: J. Biretta). All downloaded images were observed in ACCUM mode (normal integration mode) either using FUV-MAMA/F25SRF2 in the far-UV or NUV-MAMA/F25QTZ (1480 – 3500 Å, pivot wavelength 2360 Å) in the near-UV. Each observation has four near-UV exposures with integration times of seconds. Far-UV images were available only in the GO-8140 observation, whose field coverage is shown in Figure 1. Four FUV-MAMA exposures with integration times ranging from 850 to 910 seconds were taken. The orientations of GO-8048, -8780, and -9461 observations slightly differ from one another, but the field coverage is not much different from that of Field 4 in Figure 1. We denote these three fields respectively as Field 4a, 4b, and 4c when we need to distinguish them. All of these observations were taken as part of the ongoing investigation of the variability of the M87 nonthermal jet (e.g. Perlman et al. 2003). Field 4 is subject to the bright diffuse background that increases rapidly toward the M87 nucleus.
A summary of all observational material is given in Table 1.
2.2 Image Reductions
The STIS CCD images for Fields 1, 2, and 3 were calibrated using the standard IRAF.CALSTIS222IRAF(the Image Reduction and Analysis Facility) is distributed by the National Optical Astronomy Observatories. pipeline. Each CCD image went through the steps of data quality initialization, overscanning, bias subtraction, cosmic ray rejection, dark subtraction, flat-fielding, and geometric correction. The final calibrated CCD images still show a considerable number of remaining hot pixels not removed from the dark subtraction stage. We used the IMGCLEAN procedure in IDL333The Interactive Data Language is distributed by Research Systems Incorporated (http://www.rsinc.com). IMGCLEAN and other applications routines are available through the IDL Astronomy User’s Library (http://idlastro.gsfc.nasa.gov/homepage.html) maintained by W. Landsman. to eliminate these hot pixels. IMGCLEAN was originally designed to remove cosmic ray hits from WFPC images, but extensive tests showed that it works very well on our STIS CCD images. The CCD images are only used for astrometry of sources in this study, so any photometric bias introduced by the IMGCLEAN routine has no impact.
Because the far-UV images of Field 1, 2, and 3 were obtained in the TIMETAG mode, our first step was to convert the TIMETAG tables into 2-D images. For each data set we plotted the total counts in each five second bin as a function of time. Since the total count is dominated by the sky background, higher total count rates indicate higher background counts. To reject periods of bright skyglow, we can simply reject periods of high total count rates. We note that exposures o6be02ceq of Field 1 and o6be04z4q of Field 2 were made entirely in dark background periods. The time periods are input to the INTTAG task in the IRAF/STSDAS package to produce 2-D images. In practice, it was straightforward to identify intervals with serious skyglow. Once the conversion was done for all of our exposures, we proceeded with the standard STIS imaging calibration procedures as described below.
The dark current in the STIS far-UV camera is known to have a low but spatially and temporarily variable enhancement in the upper left quadrant of the image, which is called the glow. It is known that the glow correlates well with the detector temperature. While the temperature of the detector itself is hard to measure, the charge-amplifier temperature (CAT), which is recorded in the image headers, is a reliable proxy for the detector temperature. The glow is negligible for CAT lower than 35 K but above that temperature the global count rates for dark frames increase with increasing CAT. Most of our far-UV frames have CAT higher than 35 K so we performed subtraction of the glow pattern in the following manner. First, a constant dark component was subtracted by the CALSTIS routine. Next, to deal with the glow component on the upper left-hand quadrant of some images, we used the “glow only” image as a template which is available online.444http://www.stsci.edu/hst/stis/performance/background While the glow profiles of our far-UV frames are well represented by this image, the intensity of the glow varies image by image. We have generated projected mean profiles along the X and Y axes of those images and used them as references. Then we scaled and subtracted the glow profile from the images affected by the glow and generated profiles. This step was iterated until the subtracted profile closely matched the reference profile. Each glow-subtracted image was visually inspected for any anomaly caused by this technique. It turned out that this method works reasonably well except for Field 3, which has a strong stellar background gradient due to its proximity to the M87 nucleus. Since the background dominates for this field, we did not attempt to subtract the dark glow. Finally, we flagged all of the hot pixels present in our science images.
The four individual images of Fields 1 and 2 have slight positional offsets. By inspecting the locations of the bright sources in these images, we derived and applied the integer shifts in X and Y directions for registration. (Note that a one pixel shift is a small fraction of the 70% encircled energy radius for the point spread function, which is 8 pixels.) The images were then co-added. For Field 3, there was an interval of 4 months between the two visits and the orientations differ by approximately 170 degrees. We performed a rotation on the earlier epoch images using the ROT function in IDL with the CUBIC parameter set to . The cubic convolution interpolation method used in this function closely approximates the optimum sinc interpolation function by adopting cubic polynomials. To ensure that introducing rotation does not affect the object photometry, we have compared the photometry (explained below) done on several sources in both the pre- and post-rotated images. The differences in all cases were negligible. After rotating the images, integer shifts were applied using the same approach as in Fields 1 and 2.
The MAMA images of Field 4 were also calibrated with the standard CALSTIS pipeline. We did not attempt to subtract the dark glow of the Field 4 far-UV images because of the high galaxy diffuse background. The registration and co-adding for each observation of Field 4 were done as described above, resulting in one combined FUV-MAMA image and four combined NUV-MAMA images.
In Figure 2, we show the combined STIS FUV-MAMA and STIS CCD images for Field 1, 2, and 3. Images and identifications in Field 4 are shown and discussed in §9.2.
2.3 Photometry and Flux Conversion
We derived astrometric solutions for all of our STIS images (CCD, FUV-MAMA, and NUV-MAMA) using the WFPC2 image as a reference to aid the identification of sources. The IRAF task TFINDER was used for doing the astrometry. The offsets between new solutions and old header records are less than 1″in most cases for all STIS images, and the uncertainties for the solutions are less than 0.02″.
Sources in the STIS CCD (optical-band) frames of Fields 1, 2, and 3 were identified using the automated DAOFIND routine (Stetson 1987). Since the K99 observations go deeper than ours, all sources found in our CCD images are also listed in the photometry of K99.555Both paper and electronic versions of K99 only include one hundred objects closest to the center of M87. Throughout this paper, we use an updated complete photometry list made by A. Kundu but refer to it as K99 photometry.
For the far-UV and near-UV images, we did not use an automated detection algorithm since the sources have poorly defined point spread functions (PSFs). Instead, we centroided on each object detected by eye and cross-identified them with objects listed in K99 photometry. When detected far-/near-UV sources did not match any of the objects in K99 photometry, we labeled them as “UV-only sources.” Similarly, sources not found in our far-/near-UV images but listed in K99 photometry within our field of view were labeled as “optical-only sources.” The NUV-MAMA images of Field 4 covered four different epochs separated from five months to as long as two years. We tabulate identifications separately for each epoch in Table 5 to study possible variable sources. We note that in Field 4, all UV-only sources in the far-UV frame are also found in one or more of the near-UV frames.
Aperture photometry on the UV sources was performed using a modified version of the IDL APER routine, an implementation of the DAOPHOT (Stetson, 1987) PHOTOMETRY routine. The dark current is so low in the MAMA detectors that the background levels are quantized to just a few values. The median or mode is not a good estimation of the background when dealing with such signals. According to Leitherer et al. (2001), the best way to estimate the background is to identify all hot pixels in the local background of each source, and then to use a mean for the remaining pixels. Our modified APER routine fully accommodated this approach. The net flux of each source was measured through an aperture of 8 pixels in radius, corresponding to 0.20 arcsec and using a local sky background measured within an annulus of 20 to 30 pixels in radii. In some cases, the sources are so close to each other that the background measurements are affected by the nearby sources. For those, we masked the nearby sources with apertures of appropriate size prior to doing photometry. The conversion of MAMA counts into magnitudes in the STMAG system was done using the expression:
| (1) |
where PHOTFLAM defines the inverse sensitivity in units of ergs s-1 cm-2 Å-1/(counts s-1) and EXPTIME is the exposure time in seconds. The version of the CALSTIS routine we used (v2.13, 26-April-2003) does not take into account the time dependent sensitivity changes for MAMA imaging modes. The PHOTFLAM values in the image headers all default to ergs s-1 cm-2 Å-1/(counts s-1) for the FUV-MAMA and ergs s-1 cm-2 Å-1/(counts s-1) for the NUV-MAMA, regardless of the date of observation. To calculate the correct PHOTFLAM values for our observing periods, we used the BANDPAR task in IRAF STSDAS.SYNPHOT package with the observation Julian dates as inputs.
The final integration times and PHOTFLAM values used are tabulated in Table 2. For UV-only and optical-only sources, we determined upper limits in and far-/near-UV fluxes using the nominal flux plus when the measured fluxes are positive and when the measured fluxes are negative. In the case of the UV-only sources, we re-measured the original K99 image frames at the coordinates of the UV identifications, applying the K99 photometric procedures. We attempted to construct far-/near-UV growth curves for a few of our bright sources to derive aperture corrections. However, because even the brightest sources have a poorly defined PSF, it is not possible to derive reliable aperture corrections. Therefore, we rely on the aperture corrections for point sources tabulated in Table 8 of Proffitt et al. (2003).
The foreground reddening towards M87 estimated from diffuse 100 dust emission is (Schlegel, Finkbeiner, & Davis, 1998). Using this value and the extinction law of Cardelli, Clayton, & Mathis (1989), we derived extinctions of mag and mag, implying and . All photometry was corrected for extinction using these values. Foreground estimated from HI emission is zero (Burstein & Heiles 1984), but even if we had adopted the latter value, the large color offsets discussed below between the M87 and Milky Way clusters would still persist.
Our photometric catalogs are presented in Tables 3 and 4. For each object we list the following parameters: identification number, coordinate offsets from the center of M87, radial distance from the center, far- and near-UV magnitudes and errors in the STMAG system, and dereddened UV-optical colors. Details are given in the footnotes to the tables.
2.4 Far-Ultraviolet Detection Rate
We use the WFPC2 photometry of K99 to examine the detection rate of clusters in our fields. Our limiting far-UV magnitude is , corresponding to . We detect in the FUV a total of 69 objects in Fields 1, 2, and 3, of which 50 are globular clusters identified by K99. There are 127 optically-identified clusters in the K99 sample in these fields to . (We discuss the non-K99 identifications later in §9). In Field 4, 7 and 37 objects are detected in the far- and near-UV images, respectively. In Figure 3, we show our far-UV detections with respect to optical detections in Fields 1, 2, and 3. (Field 4 has been excluded from this plot since the short exposure time and the strong background gradient make the detection rate low and not comparable to the other fields.) For , all but two K99 clusters are detected in the far-UV, resulting in a detection rate of 94% with respect to optical detections. The mean color for these 29 clusters is . K99 show that the completeness of their cluster selection for is nearly 100%. For and 24.0, our detection rate drops to 63% and 48%, respectively. Overall, we detect 39% of the K99 cluster sample. We return to this subject and consider possible selection effects in §8.
As seen in Figure 3, the clusters detected in the far-UV are at the bright end of the optical luminosity function for the M87 GC system (also see Figure 5 of K99). The two peaks in the optical color distribution found for M87 clusters by K99 lie at and . The histogram in Fig. 3 shows that most of the clusters we detect in the far-UV belong to the bluer [] subpopulation.
3 Interpretation of UV-Optical Colors
In the subsequent sections, we discuss our results for the M87 system in the context of the available UV photometry samples of Milky Way globular clusters and early-type galaxies. Most of the existing data are from the International Ultraviolet Explorer (IUE), but several other experiments also contributed data (see Appendix A and DOR95). The recently-launched GALEX mission will rapidly enlarge these samples.
The far-UV band is sensitive only to hot stars. In purely old populations, these exist in significant numbers only on the horizontal branch. The far-UV flux therefore depends mainly on the number of HB stars hotter than about 10000 K, with a modest dependence on their temperature distribution. On the other hand, such stars contribute almost nothing to the optical bands (here and ), which are instead dominated by main sequence and giant light (DOR95, Schiavon et al. 2002). Thus, we take the color to be a measure of the fraction of the stellar population that appears in the form of hot HB stars.
The situation in the near-UV ( Å) band is more complicated (Burstein et al. 1988). In the absence of HB light, the near-UV band will be dominated (over 90% contribution) by stars near the main sequence turnoff. For a given age, there will be a strong dependence of color on metallicity, estimated by Dorman, O’Connell, & Rood (2003) to be mags/dex. But hot HB stars do often have a major impact in the NUV. Dorman et al. (2003) estimated that hot HB stars contribute 40–80% of the NUV light in a sample of nearby gE galaxies, and comparable numbers should also apply to those globular clusters with bluer colors.
The color for populations with comparable ages and metallicities is in principle a measure of the temperature of the hot HB stars. The simple models of DOR95 indicate that the FUV light of objects with is dominated by HB populations that extend to the EHB range ( K).
4 Comparison of M87 to Local Group Globular Clusters
Figure 4 shows the extinction-corrected and color-absolute magnitude diagrams (CMDs) for M87 clusters. We do not include the FUV limits for the optical-only sources. For comparison, we also plot the Milky Way GCs as open triangles. The Milky Way data were taken from DOR95 but updated with the new values listed in Harris (1996) (see Appendix for details). The figure shows that we have been able to sample in M87 almost the full V-band luminosity range present in the Milky Way UV-detected sample, although the average M87 detection is more luminous than in the Milky Way. There are three M87 clusters that are brighter than the most massive Milky Way GC, Cen, in and two in . (While Cen and M54 have similar brightnesses in , Cen is brighter in the far-UV by 1.2 mags.)
The M87 clusters in Figure 4 extend to a significantly bluer color than the Milky Way GCs. Figure 5 shows the color distributions for all M87 clusters plotted in Figure 4 (upper panel) and for the clusters brighter than (lower panel). We also plot the histogram of the color distribution for Milky Way GCs. The mean color of the M87 clusters in Figure 5a is (the error being the standard error of mean); and for clusters in Figure 5b, the mean color is . Both M87 histograms have peaks at (the error being half of the bin size). The mean and peak for the Milky Way GCs are at and , respectively. Thus, the M87 GC sample we observed is significantly bluer than the MW sample. The two-sided Kolmogorov-Smirnov (K-S) test shows that the probability of the Milky Way and M87 GC color distributions being drawn from the same parent distribution is only . Only a few MW clusters, including Cen and NGC 6752, have colors comparable to the peak of the M87 distribution.
To compare our M87 results to those for M31 clusters from Rey et al. (2005), we must first convert the GALEX photometric system (defined in terms of flux per unit frequency) to our STMAG system (defined in terms of flux per unit wavelength). The conversion is . The detected M31 GCs lie in the range –2.2, within the blue envelope of the Milky Way clusters and not as extreme as the M87 sample.
In Figure 6, we show the color-color diagram for all data plotted in Figure 4. The colors corresponding to the centers of the two cluster subpopulations as defined by K99 are indicated by arrows. Most of our detections belong to the bluer group, although they tend to lie on the red side of the color centroid. They also correspond in color to the average of the Milky Way sample. Seventeen of the UV-detected M87 clusters have . These evidently belong to the red subpopulation. They are redder in , and presumably more metal-rich, than any Milky Way sample cluster. On average, these objects have redder colors than the other M87 GCs, but they are considerably bluer than metal-rich Milky Way clusters like 47 Tuc and NGC 6388. Because of the selection effects (see §8) evident in Figure 3, the true mean color of the metal-rich M87 clusters must be redder than suggested by the figure. However, it is clear that M87 clusters with metallicities considerably in excess of those in the Milky Way are capable of producing large EHB star populations.
The M87 clusters show significant scatter in Figure 6 but form a rough diagonal sequence along which clusters bluer in color are also bluer in . The slope of this sequence is measured to be . Since colors are widely used as a proxy for metallicity (assuming a modest age dispersion), this trend in turn suggests that more metal-poor GCs in our M87 sample produce larger fractional hot HB populations. The Milky Way sample is too small and inhomogeneous to establish such a metallicity-UV dependence, but it not inconsistent with the M87 trend.
Except for the two bluest Milky Way clusters in , Cen and NGC 6752, there is no overlap between the M87 and Milky Way clusters in the color-color diagram. At a given , the M87 GCs are significantly bluer in than the Milky Way clusters.
Combining both M87 and Milky Way data, there is a hint in Figure 6 of three parallel sequences in the diagram with offsets in : M87 GCs with , Milky Way GCs (unlabeled) plus M87 GCs with , and a sequence of UV-faint Milky Way GCs (labeled). The latter includes 47 Tuc. However, the inhomogeneous photometry and limited Milky Way sample preclude any definite conclusion, nor is there an obvious physical explanation for such a separation.
If we consider the color as a proxy for metallicity again, the pronounced scatter in colors at a given in Figure 6 is an extreme manifestation of the “second parameter effect” (see Lee, Demarque, & Zinn 1994 and references therein).
The main conclusion from this section is that despite strong overlap in V- and I-band properties, the M87 GCs have UV/optical properties that are distinct from clusters in the Milky Way and in M31. M87 clusters produce larger hot HB populations than do their Milky Way analogues, and metal poor GCs are better at this than are metal rich GCs. Because we have detected a large fraction of all cluster candidates in our fields (see §8), we do not believe this result is strongly biased by preferential selection of an unrepresentative extreme UV-bright tail of the M87 cluster population. M87 metal rich clusters can produce significant hot HB populations.
5 Radial Dependence of Luminosities and Colors
Figure 7 tests for a variation of the absolute far-UV magnitude, , and the colors with radial distance from M87 nucleus. Since Field 4 has a different exposure depth than the other fields, we separated this field with dashed lines in both plots. Studies of radial gradients in the optical color distribution of GCs in M87 by Strom et al. (1981), Lee & Geisler (1993), Cohen, Blakeslee, & Ryzhov (1998), and Harris, Harris, & McLaughlin (1998) show that on average, GC optical colors become bluer as radial distance increases. Harris, Harris, & McLaughlin (1998) found that the color distribution is flat for (which encompasses 3 of our 4 fields) and then becomes bluer with radial distance. Ohl et al. (1998) studied the integrated far-UV color gradient in M87, which is dominated by the diffuse background, and found that the color is flat out to a radial distance of ″. Beyond that, the color becomes redder with increasing radial distance. In our case, we find no evidence for radial trends in the colors of individual GCs in Figure 7, although our radial coverage is not large.
6 UV Colors and Metallicities in Clusters and E Galaxies
Here we present population diagnostic diagrams similar to those in DOR95, including data for both the M87 and Milky Way globular cluster samples, for two Galactic open clusters, and for early-type galaxies.
6.1 Metallicity Indicators
To place the M87 clusters in the context of other old populations with UV data, we employ the Lick Mg2 narrow-band absorption line index as a metallicity indicator. The Mg2 index is widely used in population studies, and it is available for many Milky Way GCs and nearby early-type galaxies. UV color-Mg2 diagrams were presented for early type galaxies in Figure 1 of Burstein et al. (1988) and for galaxies and Galactic globular clusters in Figure 1 of DOR95.
Unfortunately, neither Mg2 nor any other spectroscopic measures are available for our M87 clusters. To place them in the diagram, we have estimated Mg2 values from their colors using the color-[Fe/H]-Mg2 relations derived in Appendices A and B. These are based on color and spectroscopic data for GCs in the Milky Way, the gE galaxy NGC 1399, and a small sample of GCs on the outskirts of M87 (see the Appendices for details). In Appendix B we show that the three cluster systems lie on a common -[Fe/H] relation.
The inferred Mg2 values for the M87 clusters must obviously be treated with caution. However, the color range in this calibration encompasses all of our UV-detected sample, and our basic results do not depend on the details of the conversion unless there are strong nonlinearities not evident in the data sets discussed in the Appendices.
An alternative that would avoid whatever uncertainty resides in this conversion would have been to use colors, which are known to correlate well with metallicity, instead of Mg2. Unfortunately, most of the early type galaxies with existing far-UV observations do not presently have published colors.
Another potential difficulty for interpretation is that it is now well established that the abundances of the light metals in old populations, including Mg, do not change in lockstep with the iron peak (e.g. Worthey 1998; Thomas, Maraston, & Bender 2003; Schiavon 2005; and references therein). Trager et al. (2000) estimate that the light metals are enhanced by dex with respect to the Fe-peak in typical luminous elliptical galaxies. However, it is the light metals, especially O, that dominate the overall metal abundance. They therefore have a dominant influence on the evolution of galaxy spectral energy distributions, although the Fe-peak is also important through its effects on opacity. Mg is probably a better indicator of metallicity than Fe. The relatively small enhancements found by Trager et al. (2000) should not distort the metallicity scale much with respect to one based on the Fe-peak. In particular, they should not importantly affect the ranking of objects by metallicity, which is the main issue in the following discussion.
6.2 Far-UV/Mg2 Correlation
In Figure 8, we have added the M87 clusters to the far-UV color-Mg2 diagram for Milky Way GCs and nearby early-type galaxies presented by DOR95. The galaxy measurements refer to the central region covered by the IUE aperture.
The lowest inferred Mg2 indices for the M87 clusters shown in the figure coincide with the lowest values for Milky Way clusters. But the M87 sample extends to considerably higher values than does the Milky Way sample. The most metal-rich M87 GC is inferred to have solar metallicity. As in Figure 6, the M87 sample is significantly bluer in at a given Mg2 than the Milky Way clusters.
The metal-rich M87 clusters have filled the gap between the Milky Way cluster and galaxy sequences in the diagram, as we had hoped in planning the observations. However, the clusters are still clearly separated from the galaxies in this diagram. Many of the M87 GCs are mag bluer than the bluest ellipticals in .
About ten metal-rich M87 clusters overlap with the lower metallicity end of the galaxy sequence. (The S0 galaxy M85 shows evidence for star formation and internal extinction [Kinney et al. 1993], so we exclude this object from further discussion.) The lowest metallicity galaxy in the sequence is the Local Group dwarf M32. Many studies have indicated that M32 has approximately solar abundance (Worthey 2004 and references therein). Our UV-detected metal-rich M87 GC sample is –3 mags bluer than M32. In fact, it has an average color bluer than 90% of the entire galaxy sample.
Because of selection effects, we cannot compare M32 to a complete sample of M87 clusters with comparable metallicity. However, an age difference is likely to be a contributing factor to the large color discrepancy between the available metal-rich sample and M32. The luminosity-weighted age of M32 is known to be 3–5 Gyr (O’Connell, 1980; Rose, 1984; Trager et al., 2000; Schiavon, Caldwell, & Rose, 2004; Worthey, 2004), whereas the clusters are probably 8–12 Gyr old. Younger systems are expected to have a smaller UVX (other things being equal) because the envelope masses of their HB stars are larger, yielding lower HB temperatures (e.g. Yi et al. 1999, O’Connell 1999 and references therein).
Rose (1994) and Rose & Deng (1999) had already demonstrated significant population differences, probably involving age, between M32 and the metal rich Milky Way cluster 47 Tuc. They made a careful analysis of spectral features in the 2600-4400 Å region, which originate mainly on the main sequence and giant branches. The differences on the hot HB revealed in the far-UV by Figure 8 are much more conspicuous. Using the simple formulation for treating the UV spectra of old populations described in Dorman et al. (2003), we find that populations like the bluest of the M87 metal rich clusters could contribute at most about 6% of the V-band light in M32.
As mentioned in the Introduction, the recent GALEX survey of quiescent early-type galaxies (Rich et al. 2005) exhibits a large range of UV/optical color but no correlation of color with metallicity, unlike the IUE sample shown in Figure 8. The differences between the two samples are not understood and are still being explored. However, after taking account of the differences in definition between the GALEX and STMAG systems (§4), we find that roughly 40% of the GALEX sample is bluer than NGC 1399, the bluest elliptical in the nearby IUE sample. The bluest GALEX objects correspond to , which is 2 magnitudes bluer than NGC 1399. This situation is not unphysical for an old population because DOR95 showed that if all horizontal branch stars evolved through the hottest EHB channel, such colors could result. However, it does signify rather different conditions in the GALEX sample than in nearby systems. Whatever these are (e.g. contamination by recent star formation, environmental effects leading to larger ages), they may have concealed the trends with metallicity found by Burstein et al. (1988).
The key result from Figure 8 is that the metal rich subset of M87 globular clusters does indeed overlap the Mg2 values found on the elliptical galaxy sequence but the UV-detected clusters produce much more far-UV light than do the galaxies at a given Mg2. The metal-rich clusters of M87 do not appear to represent a transition between MW-type clusters and E galaxies. This comparison is tentative because of incompleteness in both samples and the uncertainty in the inferred Mg2 values for the M87 clusters. However, the effect is in the correct sense if the detected clusters have significantly older light-weighted ages than the galaxies.
6.3 Comparison With Galactic Open Clusters: Ages and Blue Stragglers
We have marked in Figure 8 the approximate locations of two well-known Galactic open clusters, NGC 188 and NGC 6791. These have estimated ages of 6 and 7 Gyr, respectively (Dinescu et al. 1995; Kaluzny & Rucinski 1995). Integrated far-UV fluxes were based on Ultraviolet Imaging Telescope observations made by Landsman et al. (1998). V-band integrated fluxes were taken from Lata et al. (2002). To estimate Mg2, we used the synthesis predictions for Lick indices by Thomas et al. (2003). We assumed the ages quoted above, [/Fe] , and adopted [Fe/H] values from Friel et al. (2002). (We did not use the empirical calibration for globular clusters discussed in the Appendices because these objects are significantly younger than the globulars.)
The positions of these clusters are rough because of lack of completeness, uncertainties in the Mg2 conversion, and stochastic effects in the (small) number of hot stars responsible for the UV light in these clusters.
Both clusters have appreciable far-UV contributions, and, as anticipated by Landsman et al. (1998), their colors are comparable to the bluest elliptical galaxies. They fall together with the metal-rich M87 clusters in Figure 8 and have much bluer colors than elliptical galaxies with similar Mg2 values. NGC 6791 is as blue as the bluest Milky Way globulars.
Theoretical models for the UV upturn (e.g. Yi et al. 1999) predict that its strength is a step function in age, with populations older than Gyr having a significant upturn (i.e. a rich EBH). Therefore, even if the locations of NGC 188 and 6791 in Figure 8 are accurate, we cannot conclude that the surrounding M87 metal rich clusters have intermediate ages like those of the open clusters. The open cluster observations can also be taken as evidence that the transition age is younger than 6-7 Gyr. If so, Figure 8 indicates that the light of most of the galaxies is dominated by populations younger than about 6 Gyr.
The far-UV in these two open clusters is produced by extreme HB stars, just as we believe is the case in the elliptical galaxies. Blue straggler stars (BSS) are not important in the far-UV in either case (Landsman et al. 1998). However, under certain circumstances, BSS can dominate the UV light. The open cluster M67 is the best example of this. Landsman et al. (1998) showed that a single, unusually hot BSS (F81, with K) contributes over 90% of the far-UV flux in M67. The predicted integrated is , comparable to that of NGC 6791. However, the more typical BSS stars, with K, make very little contributions to the light below 1600 Å (e.g. see Fig. 3 of Landsman et al. 1998).
Therefore, it is possible for BSS-rich populations to match the far-UV colors of the metal-rich M87 globulars or the bluer gE galaxies. But we do not think BSS components are important in those systems for several reasons (see Landsman et al. 1998). First, massive BSS capable of affecting the integrated far-UV light will appear only for a narrow range of population age, near that of M67 (4 Gyr). They are not important in clusters like NGC 188 and 6791, only a few Gyr older, because they become too cool. In younger populations, the UV influence of BSS is overwhelmed by the light of main sequence turnoff stars. Second, their importance in M67 has probably been enhanced by dynamical evaporation of lower mass stars, which is not a factor in galaxies and is probably less important in massive globular clusters. Finally, it is thought that many BSS are binaries produced by stellar collisions (Bailyn 1995), but the dynamical environment of galaxies is much less favorable to this process than is the case in clusters.
In the near-UV (2000–3200 Å) the influence of BSS can be considerably larger. They probably affect the NUV integrated spectra of clusters with significant BSS components, even where there is strong competition from horizontal branch stars. However, for the last two reasons discussed above, it is doubtful that BSS have much effect on the NUV spectra of galaxies.
6.4 Near-UV Color-Color Correlations
Among our data, only Field 4 has near-UV observations. Since the far-UV observations in Field 4 are not as deep as the near-UV, we have colors for only seven clusters (see Table 4).
The versus Mg2 diagram is shown in Figure 9. This is the NUV analogue to Figure 8. We plotted only M87 GCs with . Because of the large contribution of main sequence stars to the NUV fluxes, we expect the color to become redder as the metal abundance increases (Burstein et al. 1988, Dorman et al. 2003 and §3). The M87 GCs seem to follow this general trend. However, as in Figure 8, they are systematically offset to bluer colors than the Milky Way GCs for a given metallicity. The slope of the blue envelope in Figure 9 agrees roughly with expectations (see §3) for a metallicity effect if vertical scatter has been introduced by a variable hot horizontal branch population. The five most Mg-rich galaxies have bluer colors than the rest of the galaxy sample, probably due to strong contamination of the NUV light by their large EHB populations (also evident in Figure 8).
Figure 10 shows the color versus Mg2 for the three samples. The M87 GCs have colors bluer than the Milky Way GCs and comparable to the average galaxies. However, in this diagram the M87 clusters appear to be an extension of the Milky Way GCs, becoming bluer in with increasing metallicity. As noted in our discussion above on interpreting UV colors, colors bluer than indicate the presence of dominant EHB populations. Most galaxies and 6 of the M87 clusters fall in this category. M32 is again significantly redder than metal-rich M87 GCs in this plot, by mags in .
The UV color-color diagrams are shown in Figure 11. DOR95 emphasized the separation between Milky Way clusters and galaxies in similar plots. Here, the M87 GCs again extend the Milky Way sequence to the bluer side, and the distinction between the GC and galaxy sequences is preserved in both plots. DOR95 suggested that the galaxies have bluer than clusters because the more metal rich stars in the galaxies have larger NUV line blanketing.
It is interesting to note that the metal-rich Milky Way cluster NGC 6441, and to a lesser extent NGC 6388, has photometric properties in Figures 7–11 that are comparable to those of the UV-detected M87 GCs. NGC 6388 and 6441 are known to have RR Lyrae variables with periods anomalously larger than any other Milky Way clusters (Pritzl et al., 2000, 2001, 2002). Further studies of these two clusters may provide hints on the origin of the bluer colors seen in M87 GCs compared to the Milky Way counterparts.
The important empirical results here (for what is admittedly a small cluster sample) are that the M87 clusters appear to represent an extension of the Milky Way GC sequence in FUV-NUV-V-Mg2 space and that the galaxies are found to have stellar populations distinct from those in either cluster system. The UV light in the galaxies is evidently not produced by globular cluster-like subpopulations.
7 The M87 Globular Clusters in the Age-Abundance Grid
The bimodal distribution of cluster optical broadband colors seen in many elliptical galaxies indicates the presence of two different subpopulations (see §1.2). Since optical broadband colors of very old stellar populations are more sensitive to metallicity than age (e.g. see Yi 2003), the bimodality is normally assumed to reflect the presence of distinct metal-poor and metal-rich populations. The prevailing interpretation is that the bluer, metal-poor population is older and formed during the earliest phases of galaxy assembly, whereas the redder, metal-rich population formed later as a byproduct of gas-rich mergers between systems with more advanced chemical evolution. K99 argued that the color and luminosity distributions in M87 were consistent with the redder population being 3-6 Gyr younger.
However, the interpretation of the red clusters as younger is controversial (e.g. Catelan et al. 1998). Using their Keck spectra of 150 GCs and the stellar population models of Worthey (1994), Cohen, Blakeslee, & Ryzhov (1998) found no significant age different between the two subpopulations. Also, Jordán et al. (2002) used the Strömgren photometry of 628 clusters and various population synthesis models (Bruzual & Charlot, 1993; Worthey, 1994; Maraston, 1998) to conclude that within their measurement errors, the two subpopulations are coeval. By contrast, Puzia et al. (2005) recently used Lick absorption line indices to identify a group of metal-rich, younger (5-8 Gyr old) GCs in M31.
Here we investigate the extent to which our UV data can contribute to the question of M87 cluster ages. We compare our data to the most complete fiducial model grid of Lee, Lee & Gibson (2002; hereafter LLG02). The advantage of their models lies in the fact that they include detailed HB modeling and provide isochrones for a wide range of colors. LLG02 and Yi (2003) show that, with proper calibration of the HB phases, colors such as can be more sensitive to ages than any optical-band integrated color. However, the LLG02 models do not include the EHB population ( K).
Our version of LLG02 Figures 14-(a) and (b) is shown in Figure 12. We have plotted the M87 cluster sample using [Fe/H] values transformed from their colors, as described in §6.1 and the Appendices. We superpose the isochrones used in LLG02, kindly provided by H.-C. Lee. The models exhibit rapid bluing of colors for a given metal abundance as the age increases past a threshold that varies with abundance.
Because of their blue colors, the M87 clusters fall at the extreme right hand side of the LLG02 isochrone grid, where the models predict large ages for a given metallicity. According to K99, the boundary between the blue and red subpopulations is near , which corresponds to [Fe/H] . If we adopt this as a dividing line in Figure 12, we find that the models imply a large internal age spread of 2–6 Gyr in both the blue and red subpopulations. It seems clear that the LLG02 isochrones are not realistic in the context of these data because 15 M87 clusters lie beyond the Gyr contour and many of the others would be 2–4 Gyr older than Milky Way clusters. These values are unphysical because the color-magnitude diagrams for Milky Way clusters show them to be at the maximum age of Gyr allowed by current cosmological parameters.
The reason for the age discrepancies found above is almost certainly the lack of a well-established physical prescription for determining the HB distribution for a population of given age and abundance. Dependences on core mass and abundance are well understood, but there is no deterministic theory for the RGB mass loss that fixes the HB envelope mass. Higher mass loss near the helium flash on the RGB will yield a hotter HB for a given age or metallicity. The effects seen in Figure 12 could be explained with larger RGB mass loss in M87 than prevails in Milky Way clusters. In any case, we cannot use our UV observations to constrain the ages of the M87 clusters without a better understanding of RGB mass loss.
An alternative, or possibly complementary, possibility is that the M87 clusters are super-helium-rich, as recently proposed for one of the subpopulations in the Galactic globular cluster Cen by Lee et al. (2005b). We explore this possibility in a forthcoming paper (Kaviraj et al. 2005, in preparation).
8 Selection Effects
One of our main conclusions in the sections above is that the M87 globular clusters have systematically brighter FUV components than do their Milky Way counterparts. For instance, Figure 6 shows that for a given , M87 GCs are always bluer in than MWGCs. To what extent is this result affected by observational selection? Unfortunately, selection effects are difficult to judge. The Milky Way data are from various spacecraft, and target selection was inhomogeneous, based for instance on apparent magnitude and low foreground extinction rather than metal abundance or luminosity. Our M87 selection is actually much more homogeneous and is limited only by apparent UV magnitude ().
An attempt to evaluate selection effects as a function of color is shown in Figure 13. The upper panel of Figure 13 is the color/apparent magnitude diagram for the M87 optical and UV samples in fields 1-3 taken from Figure 3. Our UV sample includes almost all clusters brighter than but none fainter than . We have divided the intermediate region into two bins: (1) and , (2) and . The vertical dividing line corresponds to the color of the reddest cluster (47 Tuc) in the Milky Way UV-detected sample. Very few of the clusters in region (2) are detected in the FUV, whereas 59% of the clusters in region (1) are detected. Overall, we have UV detections for 61% of the M87 optical sample of clusters with colors in the range covered by the Milky Way GC sample.
In the lower panel, we plot the colors or upper limits for the M87 optical sample and for the UV-detected Milky Way sample. The blueward half of this panel makes a good case that the difference in UV properties between the M87 and Milky Way clusters is genuine and not a selection effect. If one takes all the detections and limits plotted in this region as a hypothetical parent distribution, it is clear that there is a very low probability of choosing by chance a sample with the redder colors of the Milky Way subset. Optical colors are known to be good, if not perfect, indicators of the main sequence and giant branch populations in clusters, and they are negligibly influenced by the HB stars that produce most of the FUV light. The inference is that for a given pre-HB population, the M87 clusters typically produce larger hot HB populations than do Milky Way clusters.
Although the Milky Way sample is incomplete, it does include most of the well-studied clusters with [Fe/H] , and there is no reason to suppose that a better MW sample would change this situation. Recall that the GALEX sample of M31 clusters (preferentially luminous ones) has properties similar to those of the MWGCs (Rey et al. 2005), so M87 is distinct from both of the other two cluster systems explored in the UV.
We doubt that cluster mass is a factor here. Although, based on their V-band luminosities, the M87 detections are on average more massive than the MW sample, the UV color distinction persists throughout nearly the full mass range present in the Milky Way sample (see Figure 4).
Turning to the redder side of the lower panel in Figure 13, we have UV detections for about 50% of the M87 clusters in the range but very few of the redder clusters. We cannot determine typical properties for the redder M87 clusters, but we can say that some very metal-rich M87 clusters produce UV-bright populations comparable to those of metal-poor MW clusters.
9 Ultraviolet-Only Sources
9.1 Far-UV Detections
A surprising result of our photometry is that in all four fields, we find sources that are detected in the far- or near-UV frames but not in the optical frames. In Fields 1, 2, and 3, we find 19 “UV-only” sources (the second digit of the ID number is set to 2 in Table 3), and in Field 4, we find 24 UV-only sources (Table 5). All of the Field 4 UV-only sources are detected in the NUV exposures (see §2.3), which go deeper than the FUV exposures, so we consider only those here.
First, we discuss the far-UV-only sources in Fields 1, 2, and 3. These lie in the range . Close structural inspections show that they are similar to other sources, but our poor PSFs limit conclusions. We photometered these sources independently on all images and found that none show significant variations beyond photon statistics. In Figure 14, we plot the color limits for these sources in the CMD. All sources have colors bluer than 0.1 in , compared to the two bluest optically-confirmed clusters found in Figure 4, which have and .
There are several alternative explanations for these sources:
-
•
First, we doubt that many are detector artifacts. MAMA detectors do not suffer from cosmic rays. Other detector artifacts should persist for some period of time; therefore they should appear in the same location in different fields, but they do not. No other studies using the STIS FUV-MAMA have reported artifacts similar to the effect found in our fields. Finally, in §9.2 below, we show that there are a number of “NUV-only” sources that are detectable at different epochs at different detector locations.
-
•
We cannot rule out the possibility that these sources are old M87 clusters with a large EHB star fraction. However, DOR95 predicts that if all RGB stars go through the EHB channel, the color cannot be bluer than . A similar limit was predicted from the models of Yi, Demarque, & Oemler (1998). Most sources in Figure 14 have colors much bluer than the theoretical blue limit. Hot PAGB stars are an alternative source of UV light, but considering the short lifetime of PAGB stars, it is unlikely that a sufficiently large population of such objects could be produced.
-
•
These sources could also be young star clusters with ages Gyr. According to Bruzual & Charlot (1993), the colors of young stellar systems can be as blue as . Colors in the observed range of 0 to correspond to cluster ages of 30–300 Myr. However, there is no other evidence for recent star formation in M87.
-
•
Some of them could be transient sources in M87 such as novae. Many classical novae in M31 are found to reach to at their maximum (Della Valle, 1991), which is comparable to integrated magnitudes of globular clusters. Baltz et al. (2003) estimate the nova eruption rate of 100-1000 per year for M87, following a simple purely theoretical calculation. Our far-UV observations span periods from a few hours to several months for different fields. Since the maxima of fast novae only last for a day or so, the UV-only sources detected in Field 3 for which exposures were split by 4 months are not likely to be of this kind. We conclude that only a few of the far-UV-only sources in Fields 1, 2, and 3 are likely to be nova eruptions caught near their maximum.
-
•
UV-bright background galaxies are perhaps the best candidates. So far, there have been only a few deep UV searches for galaxies. The UV (2000 Å) survey of galaxies in SA57 by the FOCA balloon-borne camera (Milliard et al., 1992) showed that many UV-selected late type galaxies in the redshift range have colors as blue as . They also find a number of sources showing extreme UV-optical colors (bluer than normal Hubble sequence galaxies), reaching up to . These are thought to be galaxies undergoing intense star formation with little internal extinction. The FOCA sample is much brighter than the objects we detect and has too low a surface density ( arcmin-2 down to ) to be important in our fields (our combined field coverage is 0.52 arcmin2), but there are analogues to these sources at fainter magnitudes. We can use the STIS observation of the Hubble Deep Field South (HDFS; Gardner et al. 2000) to estimate the density of the fainter UV background sources in our fields. We note that the far-UV observation of the HDFS was also done using the FUV-MAMA but with a different filter (F25QTZ; 1450 – 1900 Å, pivot wavelength 1590 Å). We converted their AB magnitudes to STMAG magnitudes for direct comparison with our far-UV magnitudes and selected the sources with colors or color limits bluer than 0.5. Then, we counted the number of sources that have far-UV magnitudes or limits in the range . We obtain a surface density of sources per arcmin2. This is in acceptable agreement with sources per arcmin2, the number density of the UV-only sources in our fields.
We therefore believe that the most likely explanation is that the far-UV-only sources in Fields 1, 2, and 3 are UV-bright background galaxies. We believe we do detect a number of M87 novae in Field 4 (see next section), but the ratio of novae to background galaxies should decline with radius, so that fewer will be found in Fields 1, 2, and 3. The statistical uncertainty of these observations is too large for a meaningful estimate of the UV optical depth of M87, but it is clearly small. Interestingly, Gardner et al. (2000) note that they do not find any objects in their UV images that do not appear on the optical image of the HDFS. In the case of the M87 fields, the bright diffuse galaxy background seriously limits the detection depth at optical wavelengths. A deeper optical image of our fields will possibly reveal the nature of these sources.
9.2 Near-UV Detections in Field 4
We now discuss the UV-only sources on the near-UV frames of Field 4. The near-UV frames were taken in four different epochs that span more than three years in time. The long span of these observations allows us to investigate the variability of the UV-only sources. In Figure 15 we plot the long-term variability of the NUV-only sources. The magnitudes of each source are plotted for four different epochs. For sources not detected in specific epochs, we provide the 3 upper limits of the magnitudes. The finding charts for these sources are provided in Figure 16.
Based on the variability of the sources, we can divide them into three different categories; (1) sources showing constant brightness: NUV-01, -03, -04, -05 , -10 , and -21; (2) sources only detected in one epoch: NUV-02, -08, -09, -11, -12, -13, -17, -18, -19, -20, and, -22; and (3) recurrent sources which appear variable: NUV-07, and -16. The sources showing constant brightness are likely to be background galaxies as discussed above for Fields 1, 2, and 3.
Sources that fall into category (2) are candidates for nova outbursts. Recently, in an attempt to search for microlensing events in M87, Baltz et al. (2003) have monitored in and broad bands the field around the center of M87 over a month-long interval. Out of the seven variable sources, they identify two as obvious novae: one classical (PC1-1) and one in a globular cluster (WFC2-6); two as possible novae (PC1-3 and PC1-3); and one as a microlensing event (WFC2-5). Shara et al. (2004) also recently reported a classical nova outburst (at optical wavelengths) in an M87 globular cluster.
Two of the Baltz et al. (2003) sources, PC1-1 and PC1-2, lie in our near-UV fields. We detected PC1-1 in only one of the epochs (GO-8780: NUV-13) while PC1-2 was not detected in any. Coincidentally, the date of the GO-8780 near-UV observation is approximately 40 days after the date PC1-1 reached its maximum brightness () in optical bands. From the light curve in Figure 6 of Baltz et al. (2003), the optical luminosity of PC1-1 seems to decline rather rapidly and after 40 days it is expected to be significantly fainter than it was at maximum light. Interestingly, the 53 day OAO-A2 observation of Nova FH Serpentis 1970 (Gallagher & Code, 1974) showed that the nova became progressively bluer during the early decline of the visual light curve with the bolometric luminosity remaining constant. Our detections of PC1-1 in the GO-8780 near-UV frames suggest that this behavior was also shown by PC1-1. It is likely that most of the other sources in category (2) are also novae.
On the other hand, the recurrent variable sources such as NUV-07, and -16 are difficult to explain. They do not fit the pattern expected for novae, and most other kinds of accretion-driven variable stellar sources are intrinsically faint in the UV. Because both sources NUV-07 and -16 lie close to M87’s nonthermal jet in projection, a more exotic alternative is that they are a new class of source induced by activity in the jet. Earlier authors have speculated that the continuing, dramatic activity in the M87 jet might, through an undetermined mechanism, trigger point-like flares in its vicinity (e.g. Sparks et al. 2000, Perlman et al. 2003). However, if triggering occurs, the observed variability will be strongly influenced by light travel time effects. These objects are interesting enough to justify detailed monitoring.
10 Summary and Conclusions
We have obtained deep HST/STIS far- and near-UV photometry of four fields near the center of the gE galaxy M87 in order to study the hot-star populations in its globular cluster system. We made new FUV-MAMA/F25SRF2 imaging observations in Fields 1, 2, and 3 (25″ square each) using TIMETAG data acquisition in order to maximize access to periods of low sky background. We extracted additional FUV and NUV images taken at four different epochs from the HST Archive for a nuclear field (Field 4). We performed aperture photometry on all UV sources detected in the fields and at the positions of all optically-identified clusters in the deep HST survey of Kundu et al. (1999).
Our limiting far-UV magnitude is , corresponding to . We detect in the FUV a total of 69 objects in Fields 1, 2, and 3, including 50 of the 127 globular clusters identified by K99 to . Most of our UV detections appear to belong to the bluer of the two cluster subpopulations identified by K99. We did not find any radial trends of UV luminosities or UV/optical colors of our clusters, although given its small range of radii our sample is not well suited for testing such trends.
We compare the UV/optical photometric properties of the M87 clusters to those of Milky Way clusters (from DOR95) and M31 clusters (from Rey et al. 2005). Despite strong overlap in V- and I-band properties, the M87 GCs have UV/optical properties that are distinct from clusters in the Milky Way and in M31. The color distribution of the M87 clusters has a strong peak at and a mean of 1.50, compared to corresponding values for the Milky Way sample of 2.35 and 2.30, respectively. In the color-color diagram, there is almost no overlap between the M87 and Milky Way samples, with M87 clusters being significantly bluer in at any . M31 clusters have UV properties like the Milky Way sample and unlike M87. In color plots including the NUV band (only seven M87 clusters here), the M87 clusters again are distinct from Milky Way clusters but appear to represent an extension of the MW sequence. NGC 6441 is the closest Milky Way analogue to the M87 clusters.
Seventeen of the UV-detected M87 clusters are redder in , and presumably more metal-rich, than any Milky Way sample cluster. Some of these have colors as blue as any metal-poor MW cluster. We do not sample the more metal rich population as well as the lower metallicity clusters. However, there is a suggestion of a trend in which lower metallicity GCs in our M87 sample have bluer colors.
It is difficult to assess selection effects, especially because the Milky Way UV sample is very inhomogeneous. Overall, in Fields 1, 2, and 3 we have UV detections for 61% of the M87 optical sample with colors in the range covered by the Milky Way GC sample. We therefore believe our UV detections are representative of the M87 GC population for metallicities found among Local Group clusters and that the difference in UV properties between them and M87 GCs is genuine and not a selection effect.
We believe the stars producing the far-UV light lie on the extreme horizontal branch. Blue stragglers are in general too cool to contribute to the far-UV, though they could be important in the near-UV light of some clusters (if not elliptical galaxies). The inference is then that for a given pre-HB population (i.e. main sequence and red giant branch), M87 clusters typically produce larger hot HB populations than do Milky Way clusters. M87 globulars with metallicities considerably in excess of those typical of the Milky Way are capable of producing large hot HB populations. The five bluest M87 clusters have a mean value of of 0.62. This implies, based on the estimate of DOR95 that the bluest possible color for an old population is , that % of the HB stars in these clusters evolve through the hot EHB channels. This sounds like a dramatic concentration, but it is only a factor of 2 higher than occurs in well-observed clusters like Cen.
Existing model grids for cluster UV properties (e.g. LLG02) do not match the M87 observations well. Effects such as larger giant branch mass loss or perhaps high helium abundances evidently act to enhance the importance of hot HB stars over the predictions for a given age and abundance.
In order to compare our M87 clusters to earlier compilations of elliptical galaxy data, we have estimated Mg2 line index values for them from their colors using a new calibration based on data for clusters in the Milky Way, the gE galaxy NGC 1399, and the outer parts of M87. We find that the three cluster systems lie on a common -[Fe/H] relation.
The most metal-rich M87 GCs in our sample are near solar metallicity and overlap the E galaxy sample in estimated Mg2 line indices. Nonetheless, the detected clusters produce much more UV light at a given Mg2, being up to 1 mag bluer than any gE galaxy in color and up to 3 mag bluer than the fiducial Local Group elliptical M32 at the same Mg2 value. The detected metal-rich clusters have an average color bluer than 90% of the entire galaxy sample. They do not appear to represent a transition between Milky Way-type clusters and E galaxies.
We find that two Galactic open clusters, NGC 188 and 6791, have EHB components that place them among the metal-rich M87 clusters in the Mg2- diagram. These have well-determined ages of 6-7 Gyr. If, as the theoretical models predict, there should be a transition age above which the EHB becomes well populated, then this is younger than 6 Gyr.
Our main conclusion is that insofar as their UV/optical properties are concerned, the Milky Way clusters, the M87 clusters, and the elliptical galaxies constitute three distinct types of stellar populations. More subtle distinctions in the optical, near-IR, and near-UV among cluster systems and between clusters and E galaxies have been established for some time (e.g. Frogel, Persson, & Cohen 1980; Burstein et al. 1984; Ponder et al. 1998). Cluster mass does not seem to be a factor in the differences between the Milky Way and M87 cluster systems because the color effects are detected at all masses. The very different dynamical environment of M87 could influence its cluster populations, for instance by affecting concentration (but this cannot be measured at the resolution of HST). Enhanced red giant branch mass loss or high helium abundances might also account for the large hot HB populations in M87 clusters. The UV color differences are in the correct sense if the detected M87 clusters have significantly older light-weighted ages than the E galaxies. Whether or not the trends of elliptical galaxy UV colors discussed in §6 are consistent with the “old base plus younger frosting” models discussed by Trager et al. (2000) is something that should be explored.
The large samples from GALEX will help to clarify the behavior of hot populations in elliptical galaxies. The existing GALEX sample (Rich et al. 2005) does not exhibit the strong metallicity-UVX correlation of the older IUE sample (in Figure 8). However, we find that 40% of the GALEX sample is bluer than any galaxy in the IUE sample, which suggests that additional factors such as age or recent star formation are playing a role.
Surprisingly, we find that 43 of our UV detections have no optical-band counterparts. We consider various explanations for these “UV-only” sources. Most appear to be UV-bright background galaxies, seen through M87, which therefore has low UV optical depth. A set of 11 NUV variable sources detected at only one epoch in the central field are probably classical novae. Two recurrent variable sources have no obvious explanation but could be related to activity in the relativistic jet.
Appendix A Ultraviolet and Mg2 Data for Milky Way Globular Clusters
DOR95 compiled UV data for Milky Way GCs from various sources and listed them in their Table 1. Because the metallicities and reddening values they used are outdated, we have updated them with the new [Fe/H] and values in the most recent version of Harris catalog (Harris, 1996)666The catalog can be found at http://physun.physics.mcmaster.ca/~harris/mwgc.dat. The update was done as following. For the , , and colors, we reverted to the “uncorrected” values using the old and the reddening law by Cardelli, Clayton, & Mathis (1989), and then corrected for reddenings, this time using the new and the same reddening law. The OAO far-UV fluxes (de Boer, 1985) were only used for four clusters: 47 Tuc, NGC 1851, M79, and M5. For M79, we averaged the colors from OAO and UIT observations listed in DOR95. The far-UV observation for Cen is taken from UIT photometry (Whitney et al., 1994). To these data, we have added integrated colors and magnitudes taken from the Harris Catalog.
The catalog was also updated by adopting Mg2 measurements from the recent literature. Specifically, the Lick/IDS Mg2 measurements and associated errors of (1) Trager et al. (1998) were adopted for NGC 5024, 5272, 5904, 6205, 6341, and 7078, and of (2) Puzia et al. (2002) were adopted for NGC 6388, 6441, and 6626. For clusters that overlap in both studies (NGC 6356, 6624, and 6637), we have taken error-weighted means.
Although DOR95 used a linear relation for the conversion of [Fe/H] to Mg2 for clusters that do not have Mg2 measurements, other authors (e.g. Burstein et al. 1984, Brodie & Huchra 1990) found nonlinear relationships. Puzia et al. (2002) noted that the linear relation breaks down in the metal-rich regime and provide a parabolic relation between various line indices and [Fe/H]. However, we found that the coefficient for the Mg2 versus [Fe/H] listed in their Table 6 is incorrect in the sense that the fitted curve in their Fig 7 is not consistent with the coefficients provided. Using the same clusters as Puzia et al. (2002), we derived the following relation:
| (A1) |
We used the relation above to derive predicted Mg2 values from their [Fe/H] for Milky Way clusters in our updated table that do not have Mg2 measurements either in Trager et al. (1998) or Puzia et al. (2002). The adopted values of all parameters for our Milky Way GCs are presented in Table 7.
For consistency, we have also updated the Mg2 measurements for the galaxies discussed in §6 by adopting the Lick/IDS Mg2 measurements of Trager et al. (1998).
The Mg2 index is, of course, sensitive to age as well as metallicity (e.g. Worthey 1994). The calibration here is technically correct only for systems in the age range -13 Gyr; but the actual age range in the Milky Way sample evidently produces only a small effect on the line index.
Appendix B Color-Metallicity Transformation for M87 Globular Clusters
Here we investigate the transformation between colors and [Fe/H] for the M87 clusters. A number of such studies of other cluster systems have been made. Couture, Harris, & Allwright (1990) derived an empirical relationship between [Fe/H] and using the compilation of Milky Way clusters by Reed, Hesser, & Shawl (1988) and Zinn (1985). More recently, Harris et al. (2000) derived the dependence of on [Fe/H] using the 1999 version of the McMaster catalog of Milky Way clusters. However, there are well-known pitfalls (see e.g. Kissler-Patig et al. 1998) in trying to extrapolate results for Milky Way clusters to higher metallicities such as those characteristic of many M87 clusters. Kissler-Patig et al. (1998) combined their data for the gE galaxy NGC 1399 with those of the Milky Way clusters in order to extend the relation to the higher metallicity range. Meanwhile, Kundu & Whitmore (1998) pointed out that the difference between the Couture, Harris, & Allwright (1990) and Kissler-Patig et al. (1998) relations are mostly due to the choice of the independent variable. They also argue that neither of the quantities should be used as an independent variable but instead use a “bisector” (Isobe et al., 1990) to derive the relationship.
To study the color-metallicity relation for M87 clusters, we use ten M87 clusters in Table 2 of the spectroscopic study by Cohen, Blakeslee, & Ryzhov (1998) that overlap with the and photometry of K99. Using the ID numbers of Cohen, Blakeslee, & Ryzhov (1998), these are 5001, 5002, 5012, 5021, 5028, 649, 697, 746, 750, and 892. The metallicities of these clusters are in the range [Fe/H] . Here, we derive our own relation for the combined sample consisting of Milky Way clusters with , NGC 1399 GCs, and M87 GCs. We used a bisector method (Isobe et al., 1990) to derive a new empirical relation as shown in Figure 17. The figure shows that, with the exception of one outlier, the M87 clusters fall on the same linear color-metallicity relation as the Milky Way and NGC 1399 clusters. The correlation is good despite what must be a finite dispersion in ages among the three systems and within each system, although it would undoubtedly be improved if ages could be assigned to individual clusters.
Table 6 lists our fitting parameters and compares them to those of other studies mentioned above. We adopt this relation for the discussion of M87 clusters in the age-abundance grid (§7). We also use this relation in combination with the results of Appendix A to estimate Mg2 values for our M87 cluster sample (§6). We use this approach in preference to attempting to determine a color-Mg2 relation for M87 using the spectroscopy of Cohen, Blakeslee, & Ryzhov (1998) because of reservations they expressed about their Mg indices.
References
- Ashman & Zepf (1992) Ashman, K. M., & Zepf, S. E. 1992, ApJ, 384, 50
- Ashman, Bird, & Zepf (1994) Ashman, K. M., Bird, C. M., & Zepf, S. E. 1994, AJ, 108, 2348
- Ashman & Zepf (1998) Ashman, K. M., & Zepf, S. E. 1998, Globular Cluster Systems (Cambridge:Cambridge Univ. Press)
- Baum (1955) Baum, W. A. 1955, PASP, 67, 328
- Bailyn (1995) Bailyn, C. D. 1995, ARA&A, 33, 133
- Baltz et al. (2003) Baltz, E. A., Lauer, T. R., Zurek, D. R., Gondolo, P., Shara, M. M., Silk, J., & Zepf, S. E. 2004, ApJ, 610, 691
- Bohlin et al. (1993) Bohlin, R. C., et al. 1993, ApJ, 417, 127
- Bressan, Chiosi, & Tantalo (1996) Bressan, A., Chiosi, C., & Tantalo, R. 1996, A&A, 311, 425
- Brodie & Huchra (1990) Brodie, J. P., & Huchra, J. P. 1990, ApJ, 362, 503
- Brown et al. (1997) Brown, T. M., Ferguson, H. C., Davidsen, A., F., & Dorman, B. 1997, ApJ, 482, 685
- Brown et al. (1998) Brown, T. M., Ferguson, H. C., Deharveng, J. -M., Jedrzejewski, R. I.. 1998, ApJ, 508, L139
- Brown et al. (2000a) Brown, T. M., Bowers, C. W., Kimble, R. A., & Ferguson, H. C. 2000a, ApJ, 529, L89
- Brown et al. (2000b) Brown, T. M., Kimble, R. A., Ferguson, H. C., Gardnerm J. P., Collins, N. R., & Hill, R. S. AJ, 120, 1153
- Brown et al. (2003) Brown, T. M., Ferguson, H. C., Smith, E., Bowers, C. W., Kimble, R. A., Renzini, A., & Rich, R. M. 2003, ApJ, 584, L69
- Bruzual & Charlot (1993) Bruzual, A. G., & Charlot, S. 1993, ApJ, 405,538
- Burstein et al. (1988) Burstein, D., Bertola, F., Buson, L. M., Faber, S. M., & Lauer, T. R. 1988, ApJ, 328, 440
- Burstein et al. (1984) Burstein, D., Faber, S. M., Gaskell, C. M., & Krumm, N. 1984, 287, 586
- Burstein et al. (2004) Burstein, D., et al. 2004, ApJ, 614, 158
- Burstein & Heiles (1984) Burstein, D., & Heiles, C. 1984, ApJS,54, 33
- Cardelli, Clayton, & Mathis (1989) Cardelli, J. A., Clayton, C., & Mathis, J. S. 1989, ApJ, 345, 245
- Catelan et al. (1998) Catelan, M., Borissova, J., Sweigart, A. V., & Spassova, N. 1998, ApJ, 494, 265
- Code (1969) Code, A. D. 1969, PASP, 81, 475
- Cohen, Blakeslee, & Ryzhov (1998) Cohen, J. G., Blakeslee, J. P., & Ryzhov, A. 1998, ApJ, 496, 808
- Côté, Marzke, & West (1998) Côté, P., Marzke, R. O., & West, M. J. 1998, ApJ, 501, 554
- Couture, Harris, & Allwright (1990) Couture, J., Harris, W. E., & Allwright, J. W. B. 1990, ApJS, 73, 671
- D’Cruz et al. (1996) D’Cruz, N. L., Dorman, B., Rood, R. T., & O’Connell, R. W. 1996, ApJ, 466, 359
- D’Cruz et al. (2000) D’Cruz, N. L., et al. 2000, ApJ, 530, 352
- de Boer (1985) de Boer, K. S. 1985, A&A, 142, 321
- Della Valle (1991) Della Valle, M. 1991, A&A, 252, L9
- Dinescu et al. (1995) Dinescu, D. I., Demarque, P., Guenther, D. B., & Pinsonneault, M. H. 1995, AJ, 109, 2020
- Dorman, Rood, & O’Connell (1993) Dorman, B., Rood, R. T., & O’Connell, R. W. 1993, ApJ, 419, 596
- Dorman, O’Connell, & Rood (1995) Dorman, B., O’Connell, R. W., & Rood, R. T. 1995, ApJ, 442, 105 (DOR95)
- Dorman (2003) Dorman, B., O’Connell, R. W., & Rood 2003, ApJ, 591, 878
- Faber (1983) Faber, S. M. 1983, Highlights of Astronomy, 6, 165
- Forbes, Brodie, & Grillmair (1997) Forbes, D. A., Brodie, J. P., & Grillmair, C. J. 1997, AJ, 113, 1652
- Friel et al. (2002) Friel, E. D., Janes, K. A., Tavarez, M., Scott, J., Rocio, K., Lotz, J., Hong, L., & Miller, N. 2002, AJ, 124, 2693
- Frogel, Persson, & Cohen (1980) Frogel, J. A., Persson, S. E., & Cohen, J. G. 1980, ApJ, 240, 785
- Fusi-Pecci (1993) Fusi-Pecci, F., Ferraro, F. R., Bellazzini, M., Djorgovski, S., Piotto, G., & Buonanno, R. 1993, AJ, 105, 1145
- Gallagher & Code (1974) Gallagher, J. S., & Code, A. D. 1974, ApJ, 189, 303
- Gardner et al. (2000) Gardner, J. P. et al. 2000, AJ, 119, 486
- Greggio & Renzini (1990) Greggio, L., & Renzini, A. 1990, ApJ, 364, 35
- Harris (1996) Harris, W. E. 1996, AJ, 112, 1487
- Harris, Harris, & McLaughlin (1998) Harris, W. E., Harris, G. L. H., & McLaughlin, D. E. 1998, 115, 1801
- Harris et al. (2000) Harris, W. E., Kavelaars, J. J., Hanes, D. A., Hesser, J. E., & Pritchet, C. J. 2000, ApJ, 533, 137
- Isobe et al. (1990) Isobe, T., Feigelson, E. D., Akritas, M. G., & Babu, G. J. 1990, ApJ, 364, 104
- Jordán et al. (2002) Jordán, A., Côté, P., West, M. J., & Marzke, R. O. 2002, ApJ, 576, L113
- Kaluzny & Rucinski (1995) Kaluzny, J., & Rucinski, S. M. 1995, A&AS, 114, 1
- Kinney et al. (1993) Kinney, A. L., Bohlin, R. C., Calzettia, D., Panagia, N., & Wyse, R. 1993, ApJS, 86, 5
- Kissler-Patig et al. (1998) Kissler-Patig, M., Brodie, J. P., Schroder, L. L., Forbes, D. A., Grillmair, C. J., & Huchra, J. P. 1998, AJ, 115, 105
- Kundu & Whitmore (1998) Kundu, A., & Whitmore, B. C. 1998, AJ, 116, 2841
- Kundu et al. (1999) Kundu, A., Whitmore, B. C., Sparks, W. B., Macchetto, F. D., Zepf, S. E., & Ashman, K. M. 1999, ApJ, 513, 733 (K99)
- Kundu & Whitmore (2001a) Kundu, A., & Whitmore, B. C. 2001a, AJ, 121, 2950
- Kundu & Whitmore (2001b) Kundu, A., & Whitmore, B. C. 2001b, AJ, 122, 1251
- Landsman et al. (1996) Landsman, W. B., Sweigart, A. V., Bohlin, R. C., Neff, S. G., O’Connell, R. W., Roberts, M. S., Smith, A. M., & Stecher, T. P. 1996, ApJ, 472, L93
- Landsman et al. (1998) Landsman, W., Bohlin, R. C., Neff, S. G., O’Connell, R. W., Roberts, M. S., Smith, A. M., & Stecher, T. P. 1998, AJ 116, 789
- Larsen et al. (2001) Larsen, S. S., Brodie, J. P., Huchra, J. P., Forbes, D. A., & Grillmair, C. J. 2001, AJ, 121, 2974
- Lata et al. (2002) Lata, S. Pandey, A. K., Sagar, R., & Mohan, V. 2002, A&A, 388, 158
- Lee, Lee, & Gibson (2002) Lee, H. -c., Lee, Y. -W., & Gibson, B., K. 2002, AJ, 124, 2664 (LLG02)
- Lee & Geisler (1993) Lee, M. G., & Geisler, D. 1993, AJ, 106, 493
- Lee, Demarque, & Zinn (1994) Lee, Y. -W., Demarque, P., & Zinn, R. 1994, ApJ, 423, 248
- Lee et al. (2005a) Lee, Y. -W. et al. 2005a, ApJ, 619, L103
- Lee et al. (2005b) Lee, Y. -W. et al. 2005b, ApJ, 621, L57
- Leitherer et al. (2001) Leitherer, C., et al. 2001, “STIS Instrument Handbook”, Version 5.1, (Baltimore: STScI)
- Liebert (1994) Liebert, J., Saffer, R. A., & Green, E. M. 1994, ApJ, 107, 1408
- Ma et al. (1998) Ma, C., et al. 1998, AJ, 116, 516
- Maraston (1998) Maraston, C. 1998, MNRAS, 300, 872
- Martin (2003) Martin, C. et al. 2003, SPIE, 4854, 336
- Milliard et al. (1992) Milliard, B., Donas, J., Laget, M., Armand, C. & Vuillemin, A. 1992, A&A, 257, 24
- O’Connell (1980) O’Connell, R. W. 1980, ApJ, 236, 430
- O’Connell (1997) O’Connell, R. W. et al. 1997, AJ, 114, 1982
- O’Connell (1999) O’Connell, R. W. 1999, ARA&A, 37, 603
- Ohl et al. (1998) Ohl, R. G., et al. 1998, ApJ, 505, L11
- Paresce (1991) Paresce, F., Meylan, G., Shara, M., Baxter, D., & Greenfield, P. 1991, Nature, 342, 297
- Perlman et al. (2003) Perlman, E. S., Harris, D. E., Biretta, J. A., Sparks, W. B., & Macchetto, F. D. 2003, ApJ, 599, 65
- Ponder et al. (1998) Ponder, J. M. et al. 1998, AJ, 116, 2297
- Pritzl et al. (2000) Pritzl, B., Smith, H. A., Catelan, M., & Sweigart, A. V. 2000, ApJ, 530, L41
- Pritzl et al. (2001) Pritzl, B., Smith, H. A., Catelan, M., & Sweigart, A. V. 2001, AJ, 122, 2600
- Pritzl et al. (2002) Pritzl, B., Smith, H. A., Catelan, M., & Sweigart, A. V. 2002, AJ, 124, 949
- Proffitt et al. (2003) Proffitt, C. R., Brown, T. M., Mobasher, B., & Davies, J. 2003, “Instrument Science Report STIS 2003-01”, (Baltimore: STScI)
- Puzia et al. (2002) Puzia, T. H., Saglia, R. P., Kissler-Patig, M., Maraston, C., Greggio, K., Renzini, A., & Ortolani, S. 2002, A&A, 395, 45
- Puzia et al. (2005) Puzia, T. H., Perrett, K. M., & Bridges, T. J. 2005, A&A, in press
- Racine (1968) Racine, R. 1968, PASP, 80, 326
- Reed, Hesser, & Shawl (1988) Reed, B. C., Hesser, J. E., & Shawl, S. J. 1988, PASP, 100, 545
- Rey et al. (2005) Rey, S. -C. et al. 2005, ApJ, in press
- Rich et al. (1997) Rich, M. R., et al. 1997, ApJ, 484, L25
- Rich et al. (2005) Rich, M. R., et al. 2005, ApJ, in press
- Rose (1984) Rose, J. A. 1984, AJ, 89, 1238
- Rose (1994) Rose, J. A. 1994, AJ, 107, 206
- Rose (1999) Rose, J. A., & Deng, S. 1999, ApJ, 117, 2213
- Sciavon (2005) Schiavon, R. P. 2005, ApJS, in press
- Schiavon, Caldwell, & Rose (2004) Schiavon, R. P., Caldwell, N., & Rose, J. A., AJ, 127, 1513
- Schiavon et al. (2002) Schiavon, R. P., Faber, S. M., Castilho, B. V., & Rose, J. A. 2002, ApJ, 580, 850
- Schlegel, Finkbeiner, & Davis (1998) Schlegel, D. J., Finkbeiner, D. P., & Davis, M. 1998, ApJ, 500, 525
- Shara et al. (2004) Shara, M. M., Zurek, D. R., Baltz, E. A., Lauer, T. R., Silk, J. 2004, ApJ, 605, L117
- Sparks et al. (2000) Sparks, W. B., Ferguson, H., Jedrzejewski, R., Macchetto, F. D., Biretta, J., & Livio, M. 2000, BAAS, 197, #75.11
- Stetson (1987) Stetson, P. B. 1987, PASP, 99, 191
- Strom et al. (1981) Strom, S. E., Forte, J. C., Harris, W. E., Strom, K. M., Wells, D. C., & Smith M. G. 1981, ApJ, 245, 416
- Sullivan et al. (2000) Sullivan, M., Treyer, M. A., Ellis, R. S., Bridges, T. J., Milliard, B., & Donas, J. 2000, MNRAS, 312, 442
- Sweigart (1997) Sweigart, A. V. 1997, ApJ, 474, L23
- Thomas et al. (2003) Thomas, D., Maraston, C., & Bender, R. 2003, MNRAS, 339, 897
- Trager et al. (1998) Trager, S. C., Worthey, G., Faber, S. M., Burstein, D., & González, J. J. 1998, ApJS, 116, 1
- Trager et al. (2000) Trager, S. C., Faber, S. M., Worthey, G., & Gonzalez, J. J. 2000, AJ, 120, 188
- Whitmore et al. (1995) Whitmore, B. C., Sparks, W. B., Lucas, R. A., Macchetto, F. D., & Biretta, J. A. 1995, ApJ, 454, L73
- Whitney et al. (1994) Whitney, J. H., et al. 1994, AJ, 108, 1350
- Whitney et al. (1998) Whitney, J. H., et al. 1998, ApJ, 495, 284
- Worthey (1994) Worthey, G. 1994, ApJS, 95, 107
- Worthey (2004) Worthey, G. 2004, AJ, 128, 2826
- Yi, Demarque, & Oemler (1997) Yi, S., Demarque, P., & Oemler, A. Jr. 1997, ApJ, 486, 201
- Yi, Demarque, & Oemler (1998) Yi, S., Demarque, P., & Oemler, A. Jr. 1998, ApJ, 492, 480
- Yi et al. (1999) Yi, S., Lee, Y.-W., Woo, J.-H., Park, J.-H., Demarque, P., & Oemler, A. 1999, ApJ, 513, 128
- Yi (2003) Yi, S. K. 2003, ApJ, 582, 202
- Yong, Demarque, & Yi (2000) Yong, H., Demarque, P., & Yi, S. 2000, ApJ, 539, 928
- Zepf & Ashman (1993) Zepf, S. E., & Ashman, K. M. 1993, MNRAS, 264, 611
- Zinn (1985) Zinn, R. 1985, ApJ, 293, 424
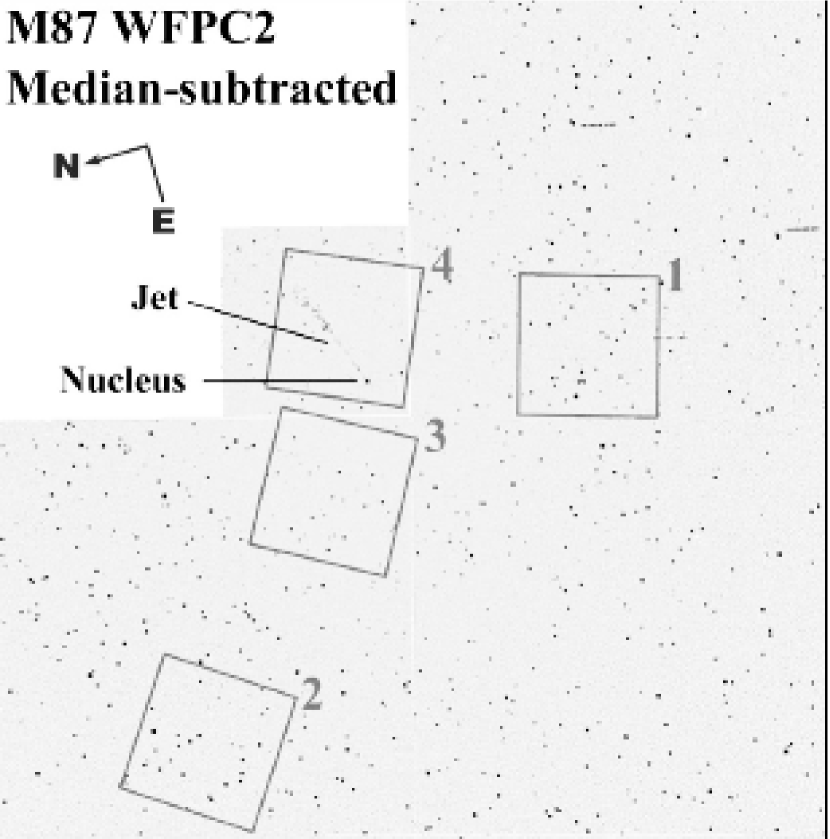
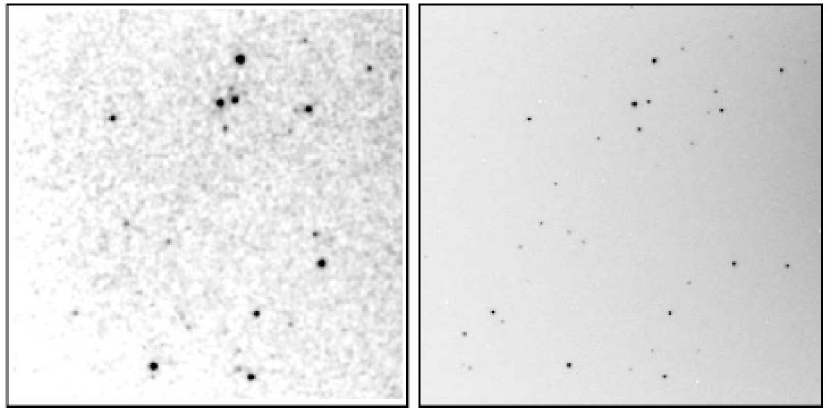
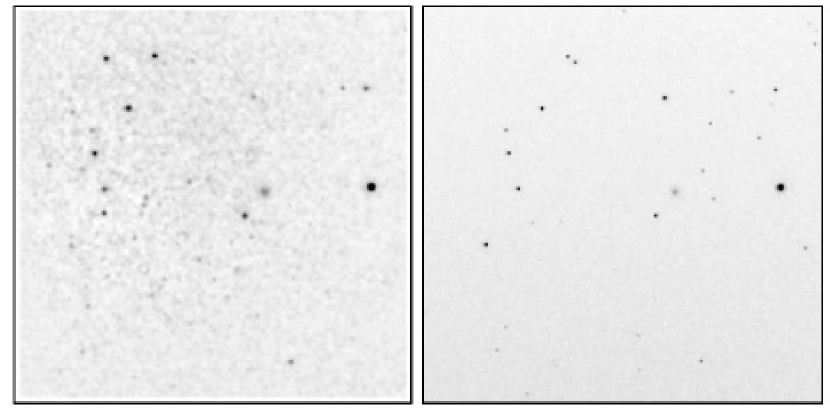
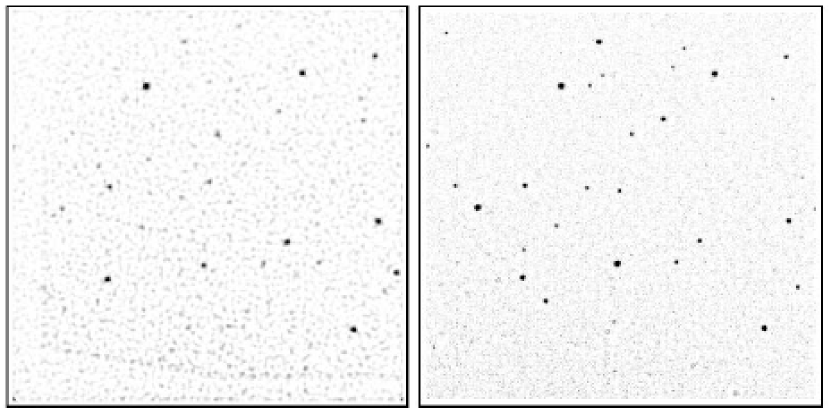


| Exp | Start | ||||
|---|---|---|---|---|---|
| Dataset | Detector | Filter | ModeaaRefer to text for TIMETAGE mode. ACCUM mode is the normal time-integration mode for imaging. | TimebbExposure times are in seconds. | TimeccStart times are in UT and in the format of Year-Month-Day Hour:Minute:Second. |
| Field 1 – RA , Dec +12°22′5038, | |||||
| o6be01oqq | FUV-MAMA | F25SRF2 | TIMETAG | 2680 | 2001-04-27 20:36:28 |
| o6be01osq | FUV-MAMA | F25SRF2 | TIMETAG | 2900 | 2001-04-27 22:08:09 |
| o6be02010 | CCD | F28X50LP | ACCUM | 518 | 2001-04-23 18:39:19 |
| o6be02ceq | FUV-MAMA | F25SRF2 | TIMETAG | 2000 | 2001-04-23 18:52:00 |
| o6be02cgq | FUV-MAMA | F25SRF2 | TIMETAG | 2900 | 2001-04-23 20:12:30 |
| Field 2 – RA , Dec +12°24′1510, | |||||
| o6be03xzq | FUV-MAMA | F25SRF2 | TIMETAG | 2680 | 2002-06-12 01:10:06 |
| o6be03ygq | FUV-MAMA | F25SRF2 | TIMETAG | 2900 | 2002-06-12 02:40:57 |
| o6be04010 | CCD | F28X50LP | ACCUM | 518 | 2002-06-12 04:20:04 |
| o6be04z4q | FUV-MAMA | F25SRF2 | TIMETAG | 2000 | 2002-06-12 04:33:45 |
| o6be04znq | FUV-MAMA | F25SRF2 | TIMETAG | 2900 | 2002-06-12 05:53:18 |
| Field 3 – RA , Dec +12°23′4084, | |||||
| o6be06010 | CCD | F28X50LP | ACCUM | 518 | 2002-06-08 12:10:52 |
| o6be06omq | FUV-MAMA | F25SRF2 | TIMETAG | 2000 | 2002-06-08 12:24:33 |
| o6be06p3q | FUV-MAMA | F25SRF2 | TIMETAG | 2900 | 2002-06-08 13:43:21 |
| o6be15m9q | FUV-MAMA | F25SRF2 | TIMETAG | 2680 | 2002-02-14 16:47:22 |
| o6be15mbq | FUV-MAMA | F25SRF2 | TIMETAG | 2900 | 2002-02-14 18:19:24 |
| Field 4 – RA , Dec +12°23′3059, | |||||
| o5dc01bpq | FUV-MAMA | F25SRF2 | ACCUM | 856 | 1999-05-17 10:33:00 |
| o5dc01bqq | FUV-MAMA | F25SRF2 | ACCUM | 850 | 1999-05-17 10:48:00 |
| o5dc01btq | FUV-MAMA | F25SRF2 | ACCUM | 910 | 1999-05-17 12:05:00 |
| o5dc01buq | FUV-MAMA | F25SRF2 | ACCUM | 910 | 1999-05-17 12:21:00 |
| o5dc01bxq | NUV-MAMA | F25QTZ | ACCUM | 614 | 1999-05-17 13:31:00 |
| o5dc01byq | NUV-MAMA | F25QTZ | ACCUM | 600 | 1999-05-17 13:42:00 |
| o5dc01c0q | NUV-MAMA | F25QTZ | ACCUM | 600 | 1999-05-17 13:53:00 |
| o5dc01c2q | NUV-MAMA | F25QTZ | ACCUM | 600 | 1999-05-17 14:03:00 |
| o6a351evq | NUV-MAMA | F25QTZ | ACCUM | 600 | 2001-07-30 23:18:00 |
| o6a351ewq | NUV-MAMA | F25QTZ | ACCUM | 600 | 2001-07-30 23:29:00 |
| o6a351eyq | NUV-MAMA | F25QTZ | ACCUM | 558 | 2001-07-30 23:40:00 |
| o6a351f0q | NUV-MAMA | F25QTZ | ACCUM | 600 | 2001-07-30 23:50:00 |
| o53c61keq | NUV-MAMA | F25QTZ | ACCUM | 600 | 2002-02-27 04:54:00 |
| o53c61kfq | NUV-MAMA | F25QTZ | ACCUM | 600 | 2002-02-27 05:53:00 |
| o53c61khq | NUV-MAMA | F25QTZ | ACCUM | 558 | 2002-02-27 06:04:00 |
| o53c61kjq | NUV-MAMA | F25QTZ | ACCUM | 600 | 2002-02-27 06:14:00 |
| o6m201w4q | NUV-MAMA | F25QTZ | ACCUM | 600 | 2002-07-17 08:54:00 |
| o6m201w5q | NUV-MAMA | F25QTZ | ACCUM | 600 | 2002-07-17 09:05:00 |
| o6m201w7q | NUV-MAMA | F25QTZ | ACCUM | 600 | 2002-07-17 09:15:00 |
| o6m201w9q | NUV-MAMA | F25QTZ | ACCUM | 600 | 2002-07-17 09:25:00 |
| Integration Time | PHOTFLAM | |
|---|---|---|
| Field | (seconds) | (ergs s-1 cm-2 Å-1/[counts s-1]) |
| 1 | 8150. | |
| 2 | 7650. | |
| 3 | 6600. | |
| 4 FUV | 3526. | |
| 4 NUV | 2414. | |
| 4a NUV | 2358. | |
| 4b NUV | 2358. | |
| 4c NUV | 2358. |
| RAbbRA, Dec: RA and Dec offset in arcseconds from the center of M87 at RA = and Dec = +12°23′280 (ICRS; Ma et al. 1998). Note that K99 used different coordinates for the center of M87. | DecbbRA, Dec: RA and Dec offset in arcseconds from the center of M87 at RA = and Dec = +12°23′280 (ICRS; Ma et al. 1998). Note that K99 used different coordinates for the center of M87. | cc: Angular radial distance in arcseconds from the center of M87. | |||||||
|---|---|---|---|---|---|---|---|---|---|
| IDaaID: The identification number. Each object has a 4 digit ID number. For fields 1, 2, and 3, the first digit is the field number, the second is a flag concerning whether an object meets the detection criteria both in optical and far-UV (0), only in optical (1), or only in far-UV (2); and the last two digits are serial numbers for each detection flag type sorted in order of ascending RA. For Field 4, we use a prefix of “NUV-” followed by two digits numbers for the clusters detected in the near-UV but not in the optical. | (arcsec) | (arcsec) | (arcsec) | dd, : Far-UV magnitudes in the STMAG system and photometric errors. Errors include random photon noises, scatter in sky pixel values, and uncertainties in mean sky measurements. For optical-only sources in Fields 1, 2, and 3, we determine upper limits to the far-UV magnitudes using the fluxes plus when the measured fluxes are positive and when the measured fluxes are negative. | ee, : Dereddened colors and errors. We used the adopted extinction to correct for reddening. and magnitudes and errors are from a complete catalog of K99. For UV-only sources, we determine upper limits to the magnitudes using the fluxes plus when the measured fluxes are positive and when the measured fluxes are negative. | ee, : Dereddened colors and errors. We used the adopted extinction to correct for reddening. and magnitudes and errors are from a complete catalog of K99. For UV-only sources, we determine upper limits to the magnitudes using the fluxes plus when the measured fluxes are positive and when the measured fluxes are negative. | |||
| 1001 | 38.71 | 22.830 | 0.063 | 1.101 | 0.064 | 0.954 | 0.015 | ||
| 1002 | 38.72 | 25.040 | 0.267 | 1.656 | 0.269 | 0.947 | 0.055 | ||
| 1003 | 35.14 | 24.744 | 0.218 | 1.136 | 0.224 | 0.953 | 0.082 | ||
| 1004 | 43.92 | 22.493 | 0.052 | 1.310 | 0.052 | 1.279 | 0.008 | ||
| 1005 | 36.85 | 23.121 | 0.074 | 1.628 | 0.075 | 1.010 | 0.014 | ||
| 1006 | 0.39 | 32.06 | 22.477 | 0.052 | 1.347 | 0.052 | 0.928 | 0.011 | |
| 1007 | 2.12 | 47.42 | 24.511 | 0.179 | 3.083 | 0.179 | 1.188 | 0.011 | |
| 1008 | 4.66 | 40.91 | 24.505 | 0.201 | 1.477 | 0.203 | 1.138 | 0.039 | |
| 1009 | 6.63 | 43.29 | 24.220 | 0.159 | 1.908 | 0.160 | 1.145 | 0.020 | |
| 1010 | 0.01 | 31.51 | 23.110 | 0.078 | 1.371 | 0.079 | 0.929 | 0.017 | |
| 1011 | 0.13 | 32.34 | 24.948 | 0.290 | 1.827 | 0.293 | 0.887 | 0.067 | |
| 1012 | 0.44 | 36.65 | 23.869 | 0.126 | 2.155 | 0.126 | 1.311 | 0.013 | |
| 1013 | 11.31 | 27.91 | 23.852 | 0.124 | 2.335 | 0.124 | 1.283 | 0.016 | |
| 1014 | 11.97 | 36.10 | 23.138 | 0.083 | 1.259 | 0.084 | 1.111 | 0.017 | |
| 1015 | 12.09 | 36.99 | 22.509 | 0.056 | 2.095 | 0.056 | 1.197 | 0.006 | |
| 1016 | 13.23 | 43.59 | 23.286 | 0.091 | 1.563 | 0.091 | 1.032 | 0.014 | |
| 1017 | 13.24 | 47.11 | 25.078 | 0.304 | 0.935 | 0.310 | 1.041 | 0.092 | |
| 1018 | 14.34 | 35.93 | 21.675 | 0.035 | 0.963 | 0.035 | 1.018 | 0.007 | |
| 1101 | 36.07 | 1.237 | 0.091 | ||||||
| 1102 | 40.47 | 1.116 | 0.049 | ||||||
| 1103 | 43.35 | 0.982 | 0.111 | ||||||
| 1104 | 49.85 | 1.186 | 0.031 | ||||||
| 1105 | 28.91 | 1.270 | 0.023 | ||||||
| 1106 | 50.19 | 1.254 | 0.088 | ||||||
| 1107 | 0.08 | 35.11 | 1.173 | 0.038 | |||||
| 1108 | 1.35 | 49.51 | 1.261 | 0.021 | |||||
| 1109 | 1.36 | 47.03 | 1.333 | 0.040 | |||||
| 1110 | 3.35 | 44.84 | 1.125 | 0.093 | |||||
| 1111 | 3.63 | 38.28 | 0.947 | 0.287 | |||||
| 1112 | 5.54 | 41.68 | 1.279 | 0.035 | |||||
| 1113 | 5.59 | 44.85 | 1.211 | 0.031 | |||||
| 1114 | 7.93 | 35.70 | 1.070 | 0.168 | |||||
| 1115 | 8.58 | 33.39 | 1.233 | 0.048 | |||||
| 1116 | 8.74 | 42.11 | 1.136 | 0.030 | |||||
| 1117 | 9.16 | 36.48 | 0.791 | 0.134 | |||||
| 1118 | 10.67 | 39.24 | 1.256 | 0.030 | |||||
| 1119 | 11.27 | 31.93 | 1.322 | 0.035 | |||||
| 1120 | 11.34 | 26.52 | 1.227 | 0.081 | |||||
| 1121 | 11.35 | 35.16 | 1.203 | 0.282 | |||||
| 1122 | 11.97 | 36.10 | 1.111 | 0.017 | |||||
| 1123 | 14.32 | 31.36 | 1.211 | 0.062 | |||||
| 1124 | 14.52 | 34.26 | 1.242 | 0.047 | |||||
| 1125 | 14.74 | 40.16 | 1.418 | 0.091 | |||||
| 1126 | 18.45 | 43.19 | 0.901 | 0.102 | |||||
| 1127 | 18.69 | 46.21 | 1.146 | 0.155 | |||||
| 1128 | 19.18 | 46.07 | 1.355 | 0.069 | |||||
| 1201 | 39.07 | 24.944 | 0.253 | ||||||
| 1202 | 36.93 | 25.395 | 0.336 | ||||||
| 1203 | 44.21 | 24.940 | 0.241 | ||||||
| 1204 | 41.07 | 24.773 | 0.214 | ||||||
| 1205 | 2.28 | 31.98 | 23.921 | 0.124 | |||||
| 1206 | 4.20 | 49.49 | 25.388 | 0.328 | |||||
| 1207 | 9.06 | 32.67 | 24.752 | 0.246 | |||||
| 1208 | 12.72 | 36.33 | 24.729 | 0.264 | |||||
| 1209 | 14.22 | 32.10 | 24.291 | 0.170 | |||||
| 2001 | 44.34 | 45.39 | 63.45 | 24.012 | 0.121 | 1.112 | 0.122 | 0.925 | 0.030 |
| 2002 | 50.64 | 55.81 | 75.36 | 22.011 | 0.042 | 1.906 | 0.042 | 1.133 | 0.004 |
| 2003 | 52.51 | 35.20 | 63.21 | 24.771 | 0.197 | 1.207 | 0.200 | 1.059 | 0.051 |
| 2004 | 53.77 | 48.32 | 72.29 | 23.168 | 0.081 | 1.340 | 0.081 | 0.974 | 0.013 |
| 2005 | 56.01 | 59.09 | 81.42 | 23.591 | 0.095 | 1.469 | 0.096 | 1.026 | 0.015 |
| 2006 | 57.50 | 56.72 | 80.76 | 25.405 | 0.337 | 2.067 | 0.338 | 1.098 | 0.034 |
| 2007 | 57.63 | 63.33 | 85.63 | 24.908 | 0.213 | 0.618 | 0.219 | 0.798 | 0.097 |
| 2008 | 58.52 | 38.44 | 70.01 | 24.303 | 0.178 | 2.453 | 0.178 | 1.107 | 0.012 |
| 2009 | 59.68 | 53.04 | 79.84 | 24.278 | 0.171 | 2.623 | 0.171 | 1.207 | 0.010 |
| 2010 | 60.29 | 42.14 | 73.56 | 23.521 | 0.108 | 1.378 | 0.108 | 1.044 | 0.015 |
| 2011 | 62.53 | 42.94 | 75.86 | 23.160 | 0.088 | 1.274 | 0.088 | 1.062 | 0.013 |
| 2012 | 63.68 | 46.28 | 78.72 | 23.044 | 0.080 | 1.208 | 0.080 | 1.045 | 0.011 |
| 2013 | 63.86 | 43.62 | 77.34 | 24.434 | 0.216 | 1.505 | 0.217 | 1.055 | 0.027 |
| 2014 | 65.49 | 49.50 | 82.09 | 23.117 | 0.082 | 0.928 | 0.083 | 0.986 | 0.017 |
| 2101 | 44.97 | 52.04 | 68.78 | 1.368 | 0.214 | ||||
| 2102 | 46.17 | 41.83 | 62.30 | 1.200 | 0.104 | ||||
| 2103 | 46.46 | 54.90 | 71.92 | 1.165 | 0.025 | ||||
| 2104 | 48.05 | 43.02 | 64.49 | 0.925 | 0.065 | ||||
| 2105 | 49.29 | 45.24 | 66.90 | 1.160 | 0.170 | ||||
| 2106 | 49.45 | 37.71 | 62.19 | 1.076 | 0.133 | ||||
| 2107 | 49.67 | 41.46 | 64.69 | 1.379 | 0.143 | ||||
| 2108 | 49.84 | 37.69 | 62.49 | 1.008 | 0.190 | ||||
| 2109 | 49.93 | 41.95 | 65.22 | 1.087 | 0.354 | ||||
| 2110 | 51.23 | 39.52 | 64.71 | 1.457 | 0.150 | ||||
| 2111 | 52.53 | 51.91 | 73.86 | 1.172 | 0.040 | ||||
| 2112 | 53.40 | 36.46 | 64.66 | 1.355 | 0.065 | ||||
| 2113 | 54.04 | 56.46 | 78.15 | 1.329 | 0.027 | ||||
| 2114 | 54.39 | 52.36 | 75.50 | 1.348 | 0.034 | ||||
| 2115 | 55.39 | 58.38 | 80.48 | 1.205 | 0.093 | ||||
| 2116 | 55.55 | 36.30 | 66.36 | 0.765 | 0.296 | ||||
| 2117 | 56.66 | 54.46 | 78.59 | 0.817 | 0.031 | ||||
| 2118 | 56.93 | 43.15 | 71.43 | 1.420 | 0.102 | ||||
| 2119 | 56.96 | 62.77 | 84.77 | 1.067 | 0.031 | ||||
| 2120 | 57.96 | 41.65 | 71.37 | 1.338 | 0.062 | ||||
| 2121 | 58.08 | 62.43 | 85.27 | 0.937 | 0.407 | ||||
| 2122 | 60.14 | 58.64 | 84.00 | 1.655 | 0.437 | ||||
| 2123 | 60.35 | 37.09 | 70.84 | 1.221 | 0.138 | ||||
| 2124 | 64.90 | 49.68 | 81.73 | 1.366 | 0.019 | ||||
| 2125 | 66.74 | 41.56 | 78.63 | 0.879 | 0.193 | ||||
| 2201 | 45.12 | 52.96 | 69.58 | 25.578 | 0.347 | ||||
| 2202 | 53.09 | 44.46 | 69.25 | 24.558 | 0.201 | ||||
| 2203 | 55.06 | 44.59 | 70.85 | 24.968 | 0.275 | ||||
| 2204 | 67.12 | 46.96 | 81.92 | 23.125 | 0.082 | ||||
| 3001 | 6.85 | 16.78 | 18.13 | 22.765 | 0.077 | 1.407 | 0.080 | 1.054 | 0.033 |
| 3002 | 11.66 | 17.01 | 20.62 | 24.756 | 0.309 | 1.376 | 0.324 | 1.064 | 0.161 |
| 3003 | 12.06 | 21.49 | 24.65 | 23.099 | 0.087 | 1.192 | 0.089 | 1.000 | 0.035 |
| 3004 | 13.36 | 14.08 | 19.41 | 24.297 | 0.214 | 1.525 | 0.223 | 1.248 | 0.094 |
| 3005 | 13.81 | 16.00 | 21.13 | 23.125 | 0.093 | 0.858 | 0.099 | 1.056 | 0.052 |
| 3006 | 15.16 | 10.83 | 18.63 | 23.519 | 0.132 | 2.569 | 0.133 | 1.257 | 0.019 |
| 3007 | 17.44 | 5.25 | 18.21 | 23.258 | 0.108 | 1.612 | 0.111 | 1.191 | 0.042 |
| 3008 | 19.22 | 8.68 | 21.09 | 24.210 | 0.211 | 1.316 | 0.219 | 0.986 | 0.093 |
| 3009 | 19.35 | 24.44 | 31.17 | 24.579 | 0.217 | 0.827 | 0.228 | 0.833 | 0.119 |
| 3010 | 19.58 | 13.69 | 23.89 | 23.912 | 0.155 | 0.629 | 0.174 | 0.941 | 0.127 |
| 3011 | 21.28 | 26.49 | 33.98 | 23.752 | 0.122 | 0.964 | 0.125 | 0.985 | 0.041 |
| 3012 | 21.93 | 15.66 | 26.95 | 23.743 | 0.129 | 0.591 | 0.138 | 0.947 | 0.083 |
| 3013 | 22.48 | 8.25 | 23.94 | 23.634 | 0.127 | 1.489 | 0.130 | 1.037 | 0.046 |
| 3014 | 22.63 | 22.07 | 31.61 | 23.169 | 0.086 | 1.763 | 0.086 | 1.072 | 0.013 |
| 3015 | 22.76 | 4.98 | 23.30 | 24.025 | 0.170 | 2.869 | 0.170 | 1.104 | 0.019 |
| 3016 | 26.85 | 13.34 | 29.98 | 22.612 | 0.065 | 1.119 | 0.066 | 1.044 | 0.017 |
| 3017 | 27.24 | 20.19 | 33.91 | 25.041 | 0.290 | 1.308 | 0.295 | 0.945 | 0.091 |
| 3018 | 28.12 | 16.76 | 32.73 | 24.268 | 0.175 | 2.635 | 0.175 | 1.140 | 0.016 |
| 3101 | 4.02 | 18.15 | 18.59 | 1.232 | 0.223 | ||||
| 3102 | 7.04 | 11.73 | 13.68 | 1.435 | 0.289 | ||||
| 3103 | 8.06 | 19.93 | 21.50 | 1.332 | 0.089 | ||||
| 3104 | 9.35 | 18.19 | 20.45 | 1.157 | 0.134 | ||||
| 3105 | 9.91 | 17.21 | 19.86 | 1.065 | 0.200 | ||||
| 3106 | 11.68 | 8.12 | 14.22 | 1.020 | 0.198 | ||||
| 3107 | 14.05 | 23.59 | 27.46 | 1.314 | 0.299 | ||||
| 3108 | 14.11 | 20.36 | 24.77 | 0.995 | 0.203 | ||||
| 3109 | 15.38 | 5.77 | 16.43 | 1.044 | 0.088 | ||||
| 3110 | 15.86 | 19.23 | 24.92 | 1.293 | 0.178 | ||||
| 3111 | 18.06 | 3.84 | 18.47 | 1.053 | 0.148 | ||||
| 3112 | 18.91 | 6.18 | 19.90 | 1.291 | 0.137 | ||||
| 3113 | 19.08 | 20.78 | 28.21 | 1.240 | 0.210 | ||||
| 3114 | 19.17 | 13.22 | 23.29 | 1.099 | 0.088 | ||||
| 3115 | 20.34 | 11.55 | 23.39 | 1.321 | 0.059 | ||||
| 3116 | 20.72 | 15.91 | 26.13 | 1.574 | 0.230 | ||||
| 3117 | 21.77 | 17.85 | 28.15 | 1.329 | 0.038 | ||||
| 3118 | 22.10 | 5.69 | 22.82 | 0.999 | 0.229 | ||||
| 3119 | 22.53 | 7.63 | 23.79 | 1.478 | 0.208 | ||||
| 3120 | 24.37 | 20.00 | 31.53 | 1.305 | 0.124 | ||||
| 3121 | 25.02 | 21.20 | 32.79 | 1.242 | 0.065 | ||||
| 3122 | 25.96 | 14.92 | 29.94 | 1.249 | 0.088 | ||||
| 3123 | 26.12 | 15.91 | 30.58 | 1.268 | 0.097 | ||||
| 3124 | 26.41 | 23.34 | 35.25 | 1.230 | 0.137 | ||||
| 3201 | 8.69 | 20.86 | 22.60 | 23.560 | 0.124 | ||||
| 3202 | 18.15 | 23.79 | 29.93 | 24.307 | 0.182 | ||||
| 3203 | 21.28 | 19.63 | 28.95 | 24.754 | 0.261 | ||||
| 3204 | 22.76 | 11.15 | 25.34 | 24.872 | 0.306 | ||||
| 3205 | 23.89 | 8.30 | 25.29 | 24.645 | 0.262 | ||||
| 3206 | 25.09 | 16.86 | 30.22 | 24.984 | 0.299 |
| RA | Dec | |||||||||||||
|---|---|---|---|---|---|---|---|---|---|---|---|---|---|---|
| ID | (arcsec) | (arcsec) | (arcsec) | bb, : Near-UV magnitudes in the STMAG system and photometric errors. Errors include random photon noises, scatter in sky pixel values, and uncertainties in mean sky measurements. | ddID number in Table 2 of Kundu et al. (1999). | cc: Dereddened colors and errors. | K99 IDddID number in Table 2 of Kundu et al. (1999). | |||||||
| 4001 | 14.95 | 24.531 | 0.099 | 1.238 | 0.106 | 1.028 | 0.065 | 62 | ||||||
| 4002 | 13.96 | 24.356 | 0.076 | 1.145 | 0.086 | 0.947 | 0.066 | 56 | ||||||
| 4003 | 9.20 | 15.50 | 23.849 | 0.224 | 24.265 | 0.084 | 1.634 | 0.225 | 2.055 | 0.086 | 1.140 | 0.026 | 60 | |
| 4004 | 11.30 | 24.965 | 0.122 | 1.493 | 0.136 | 1.064 | 0.095 | 44 | ||||||
| 4005 | 8.23 | 13.42 | 23.671 | 0.201 | 24.295 | 0.078 | 0.442 | 0.206 | 1.071 | 0.091 | 0.921 | 0.081 | 50 | |
| 4006 | 10.33 | 24.938 | 0.121 | 0.832 | 0.169 | 1.345 | 0.154 | 39 | ||||||
| 4007 | 7.56 | 10.23 | 23.321 | 0.147 | 23.866 | 0.047 | 1.681 | 0.148 | 2.231 | 0.049 | 1.064 | 0.023 | 26 | |
| 4008 | 2.31 | 6.28 | 24.605 | 0.096 | 1.975 | 0.107 | 1.082 | 0.069 | 19 | |||||
| 4009 | 7.84 | 22.915 | 0.114 | 23.242 | 0.035 | 1.372 | 0.115 | 1.704 | 0.038 | 1.052 | 0.023 | 24 | ||
| 4010 | 13.34 | 13.85 | 24.992 | 0.137 | 0.981 | 0.171 | 0.645 | 0.201 | 47 | |||||
| 4011 | 7.82 | 8.04 | 23.792 | 0.275 | 24.049 | 0.069 | 1.273 | 0.277 | 1.535 | 0.078 | 1.087 | 0.061 | 20 | |
| 4012 | 11.86 | 11.99 | 23.540 | 0.201 | 23.426 | 0.037 | 1.351 | 0.202 | 1.242 | 0.043 | 0.960 | 0.036 | 30 | |
| 4013 | 4.00 | 4.02 | 24.094 | 0.084 | 2.286 | 0.090 | 1.160 | 0.048 | 3 | |||||
| 4014 | 12.75 | 12.76 | 24.193 | 0.133 | 0.917 | 0.143 | 0.919 | 0.095 | 35 | |||||
| 4015 | 0.96 | 3.14 | 23.190 | 0.160 | 23.899 | 0.060 | 1.561 | 0.162 | 2.275 | 0.064 | 1.194 | 0.033 | 8 | |
| 4016 | 3.41 | 4.66 | 24.011 | 0.068 | 1.267 | 0.084 | 0.842 | 0.086 | 11 |
| RA | Dec | MJD 51315.56 | MJD 52120.97 | MJD 52332.20 | MJD 52472.37 | Mean Mag | ||||||||||
|---|---|---|---|---|---|---|---|---|---|---|---|---|---|---|---|---|
| ID | (arcsec) | (arcsec) | ||||||||||||||
| NUV-01 | 25.063 | 0.351 | 24.581 | 0.227 | 24.590 | 0.186 | 24.527 | 0.215 | 24.568 | 0.120 | ||||||
| NUV-02 | 23.763 | 0.117 | 23.763 | 0.117 | ||||||||||||
| NUV-03 | 24.757 | 0.240 | 24.875 | 0.293 | 24.804 | 0.186 | ||||||||||
| NUV-04 | 23.799 | 0.122 | 23.958 | 0.146 | 24.153 | 0.139 | 23.926 | 0.130 | 23.947 | 0.067 | ||||||
| NUV-05 | 25.288 | 0.356 | 25.053 | 0.265 | 24.874 | 0.220 | 25.010 | 0.153 | ||||||||
| NUV-06 | 25.008 | 0.226 | 24.775 | 0.226 | 25.475 | 0.293 | 25.129 | 0.229 | 25.054 | 0.120 | ||||||
| NUV-07 | 24.399 | 0.114 | 25.346 | 0.266 | 24.546 | 0.105 | ||||||||||
| NUV-08 | 24.175 | 0.132 | 24.205 | 0.132 | ||||||||||||
| NUV-09 | 25.059 | 0.230 | 25.059 | 0.230 | ||||||||||||
| NUV-10 | 25.022 | 0.293 | 24.963 | 0.279 | 25.182 | 0.307 | 25.049 | 0.169 | ||||||||
| NUV-11 | 24.491 | 0.168 | 24.491 | 0.168 | ||||||||||||
| NUV-12 | 24.165 | 0.136 | 24.165 | 0.136 | ||||||||||||
| NUV-13 | 24.543 | 0.240 | 24.543 | 0.240 | ||||||||||||
| NUV-14 | 24.861 | 0.198 | 24.861 | 0.198 | ||||||||||||
| NUV-15 | 24.871 | 0.234 | 24.871 | 0.234 | ||||||||||||
| NUV-16 | 25.338 | 0.350 | 23.885 | 0.125 | 23.885 | 0.125 | ||||||||||
| NUV-17 | 24.736 | 0.207 | 24.736 | 0.207 | ||||||||||||
| NUV-18 | 24.772 | 0.190 | 24.772 | 0.190 | ||||||||||||
| NUV-19 | 24.700 | 0.174 | 24.700 | 0.174 | ||||||||||||
| NUV-20 | 25.022 | 0.250 | 25.022 | 0.250 | ||||||||||||
| NUV-21 | 25.026 | 0.307 | 24.894 | 0.268 | 24.951 | 0.202 | ||||||||||
| NUV-22 | 24.452 | 0.164 | 24.452 | 0.164 | ||||||||||||
| Reference | ||
|---|---|---|
| This study | 4.26 | |
| Couture, Harris, & Allwright (1990) | 5.05 | |
| Kundu & Whitmore (1998) | 4.72 | |
| Kissler-Patig et al. (1998) | 3.27 | |
| Harris et al. (2000) | 5.88 |
| NGC | Name | [Fe/H] | Mg2 | ||||||||||
|---|---|---|---|---|---|---|---|---|---|---|---|---|---|
| 104…… | 47 Tuc | 4.64 | 1.50 | 3.80 | 0.02 | 1.10 | 0.137 | 0.014 | 0.04 | ||||
| 362…… | 1.89 | 0.08 | 0.95 | 0.088 | 0.014 | 0.05a | |||||||
| 1261…… | 1.89 | 0.08 | 0.91 | 0.069 | 0.014 | 0.01a | |||||||
| 1851…… | 2.29 | 0.17 | 2.11 | 0.08 | 0.99 | 0.082 | 0.014 | 0.02a | |||||
| 1904…… | M79 | 1.70 | 0.28 | 1.42 | 0.89 | 0.051 | 0.014 | 0.01a | |||||
| 2298…… | 2.36 | 0.07 | 0.51 | 0.06 | 1.86 | 0.09 | 0.94 | 0.034 | 0.014 | 0.14a | |||
| 5024…… | M53 | 3.12 | 0.07 | 0.93 | 0.06 | 2.19 | 0.09 | 0.84 | 0.039 | 0.010 | 0.02a | ||
| 5139…… | Cen | 1.44 | 0.06 | 0.10 | 1.74 | 0.08 | 0.91 | 0.048 | 0.014 | 0.12a | |||
| 5272…… | M3 | 3.41 | 0.04 | 1.39 | 0.02 | 2.01 | 0.05 | 0.91 | 0.040 | 0.008 | 0.01 | ||
| 5897…… | 1.77 | 0.08 | 0.93 | 0.037 | 0.014 | 0.09a | |||||||
| 5904…… | M5 | 1.96 | 2.01 | 0.08 | 0.91 | 0.067 | 0.010 | 0.03 | |||||
| 6093…… | M80 | 2.18 | 0.22 | 0.18 | 2.28 | 0.29 | 0.89 | 0.040 | 0.014 | 0.18a | |||
| 6121…… | M4 | 2.89 | 0.08 | 0.98 | 0.084 | 0.014 | 0.36a | ||||||
| 6205…… | M13 | 1.63 | 0.00 | 0.03 | 0.00 | 1.59 | 0.00 | 0.84 | 0.039 | 0.005 | 0.02 | ||
| 6266…… | M62 | 2.30 | 0.07 | 0.07 | 2.59 | 0.10 | 1.01 | 0.075 | 0.014 | 0.47a | |||
| 6341…… | M92 | 2.07 | 0.04 | 0.63 | 0.02 | 1.44 | 0.05 | 0.86 | 0.021 | 0.006 | 0.02 | ||
| 6356…… | 4.00 | 0.12 | 1.11 | 0.169 | 0.008 | 0.28a | |||||||
| 6388…… | 3.27 | 0.22 | 0.29 | 0.16 | 2.98 | 0.27 | 1.02 | 0.146 | 0.006 | 0.37a | |||
| 6402…… | M14 | 3.06 | 0.08 | 0.91 | 0.066 | 0.014 | 0.60a | ||||||
| 6441…… | 2.20 | 0.26 | 0.05 | 0.18 | 2.14 | 0.32 | 1.05 | 0.176 | 0.006 | 0.47a | |||
| 6541…… | 2.06 | 0.07 | 0.56 | 0.05 | 1.51 | 0.09 | 0.84 | 0.035 | 0.014 | 0.14a | |||
| 6624…… | 3.78 | 0.05 | 1.08 | 0.156 | 0.008 | 0.28a | |||||||
| 6626…… | M28 | 1.92 | 0.41 | 0.12 | 0.29 | 1.81 | 0.50 | 0.92 | 0.092 | 0.014 | 0.40a | ||
| 6637…… | 3.59 | 0.05 | 1.08 | 0.151 | 0.005 | 0.16a | |||||||
| 6681…… | M70 | 1.74 | 0.04 | 0.04 | 0.04 | 1.70 | 0.05 | 0.91 | 0.056 | 0.014 | 0.07 | ||
| 6715…… | M54 | 2.37 | 0.04 | 0.27 | 0.04 | 2.10 | 0.05 | 0.92 | 0.051 | 0.014 | 0.15a | ||
| 6752…… | 1.34 | 0.04 | 0.02 | 1.52 | 0.05 | 0.89 | 0.052 | 0.014 | 0.04 | ||||
| 6779…… | M56 | 2.08 | 0.05 | 0.92 | 0.030 | 0.014 | 0.20a | ||||||
| 6864…… | M75 | 2.64 | 0.22 | 0.42 | 0.16 | 1.60 | 0.08 | 0.96 | 0.088 | 0.014 | 0.16a | ||
| 7078…… | M15 | 2.36 | 0.07 | 0.67 | 0.05 | 1.69 | 0.09 | 0.73 | 0.023 | 0.007 | 0.10 | ||
| 7099…… | M30 | 2.71 | 0.04 | 0.83 | 0.04 | 1.88 | 0.05 | 0.82 | 0.024 | 0.014 | 0.03a |