The H.E.S.S. survey of the Inner Galaxy in very-high-energy gamma-rays
Abstract
We report on a survey of the inner part of the Galactic Plane in very high energy -rays with the H.E.S.S. Cherenkov telescope system. The Galactic Plane between ∘ in longitude and ∘ in latitude relative to the Galactic Centre was observed in 500 pointings for a total of 230 hours, reaching an average flux sensitivity of 2% of the Crab Nebula at energies above 200 GeV. Fourteen previously unknown sources were detected at a significance level greater than 4 after accounting for all trials involved in the search. Initial results on the eight most significant of these sources were already reported elsewhere (Aharonian et al., 2005a). Here we present detailed spectral and morphological information for all the new sources, along with a discussion on possible counterparts in other wavelength bands. The distribution in Galactic latitude of the detected sources appears to be consistent with a scale height in the Galactic disk for the parent population smaller than 100 pc, consistent with expectations for supernova remnants and/or pulsar wind nebulae.
1 Introduction
Very high energy (VHE, defined here as eV) -rays provide the most direct view currently available into extreme environments in the local universe. As -rays are produced by interactions of relativistic particles they represent a good probe of non-thermal astrophysical processes. Relativistic electrons can produce -rays by non-thermal bremsstrahlung or by inverse Compton scattering on background radiation fields, whereas protons (and atomic nuclei) can generate -rays via the decay of s produced in hadronic interactions with ambient material. VHE -radiation is therefore expected from the acceleration sites of particles with energies above 1 TeV ( eV). In particular, -rays can be seen as a probe of sources of nucleonic cosmic rays in our Galaxy and may thus provide part of the solution to the century old puzzle of the origin of this radiation.
Observations of synchrotron emission in the X-ray band provide strong indirect evidence for the existence of TeV electrons in shell-type supernova remnants (SNR), see for example Koyama et al. (1995), and in pulsar wind nebulae (PWN), see e.g. Weisskopf et al. (2000). At TeV energies, shell-type SNRs and pulsars are established to be sources of VHE -rays as shown by highly significant detections of the Crab Nebula by the Whipple collaboration (Weekes et al., 1989) or the detection of the Supernova remnant RX J1713.7–3946 by the CANGAROO (Enomoto et al., 2002) and the H.E.S.S. collaborations (Aharonian et al., 2004a). However, despite the fact that SNRs are the best candidates for the acceleration of hadronic cosmic rays up to the so-called knee in the cosmic ray particle spectrum at eV, there is as yet no generally accepted evidence for the existence of energetic nuclei (as opposed to electrons) in these objects. SNRs are favoured as the site of cosmic-ray acceleration for two principal reasons; first, that a theoretically well established acceleration mechanism exists in the form of diffusive shock acceleration at SNR shock fronts, for reviews see e.g. Blandford & Eichler (1987); Malkov & Drury (2001), and secondly, that the Galactic supernovae and the resulting SNRs are the only known potential sources which can provide the necessary amount of energy (Ginzburg & Syrovatskii, 1964).
To explain the observed energy density of cosmic rays, supernova explosions must convert kinetic energy to energy of relativistic particles with a conversion efficiency of roughly . Theoretical expectations for the -ray -emission of SNRs arising from hadronic interactions are given by Drury, Aharonian & Völk (1994) as
| (1) |
with
| (2) |
where denotes the distance to the object, the density of the circumstellar medium assumed to be uniform, and the total kinetic energy released by the Supernova. This formula assumes a power-law distribution of cosmic-ray energies with a typical differential photon index of 2.1. Calculations of the photon index give a range of values around the index value 2.0 for a uniform circumstellar medium (Berezhko & Völk, 1997) and a rather more extended range of photon index values for Supernova explosions into the wind bubble of a very massive progenitor star (Berezhko & Völk, 2002).
A typical value for the fraction of kinetic energy converted into cosmic rays is erg (Malkov & Drury, 2001; Völk, Berezhko & Ksenofontov, 2003). For an SNR at a distance of kpc expanding into an environment with a typical density of the interstellar medium of hydrogen atom per cm3, a VHE -ray flux of 20% of that from the Crab Nebula is expected. The luminosity of such a source is erg s-1 in the energy range between 0.2 TeV and 10 TeV. One would therefore expect that with the sensitivity level of the H.E.S.S. Galactic Plane survey (down to % of the Crab flux) SNRs should be detectable out to a distance of 3 kpc (to be compared to 8.5 kpc to the centre of the Galaxy). For larger values of , SNRs should be visible within most of the volume of the Galactic Disc.
Another potential source of VHE -rays are pulsars and PWN. Pulsars, rapidly rotating neutron stars left over after a supernova explosion, are highly magnetised and act like unipolar inductors accelerating particles. The pulsar wind interacts with the ambient medium, generating a shock region where particles are accelerated. Such objects may therefore exhibit a pulsed component of radiation, from the immediate vicinity of the pulsar, together with an unpulsed component from the shock region and beyond. The Crab Nebula is the best-studied object of this class of particle accelerators.
Most of these potential Galactic -ray sources such as SNRs and pulsars are associated with the formation of massive stars and therefore cluster along the Galactic Plane, especially concentrated in the direction towards the centre of our Galaxy. 91 SNRs and 389 pulsars are catalogued within the inner 60∘ in Galactic longitude and 6∘ in Galactic latitude (Green, 2004; Manchester et al., 2005). Despite the large number of known SNRs and pulsars in our Galaxy, the actual number of detected VHE -ray sources was until now limited to only a handful of objects (for a review, see e.g. Weekes (2000)).
Particle acceleration to multi-TeV energies may also be powered by OB stellar associations, via the superbubble mechanism (see Parizot et al. (2004) for a summary), and also, possibly more directly via the stellar winds of member stars and subsequent interaction (see e.g. Montmerle (1979); Völk, & Forman (1982); White (1985); Benaglia et al. (2001)). There are presently two TeV sources that may be linked to such OB associations. TeV J2032+4130, discovered by the HEGRA collaboration (Aharonian et al., 2002a), and HESS J1303–631, a recent discovery by H.E.S.S. (Aharonian et al., 2005b) are in the vicinity of the OB associations Cygnus OB2 and Centaurus OB1, respectively. Both TeV sources remain unidentified (UID) in the sense that there are as yet no clear counterparts of similar size and morphology in other wavebands. These sources might represent a new class of objects distributed along the Galactic Plane.
At lower energies, observations by the space based instrument EGRET in the GeV energy range (Hartman et al., 1999) also revealed a population of sources clustering along the Galactic Plane. The limited angular resolution of the EGRET instrument renders an identification of these sources in other wavebands very difficult and most of these objects remain as yet unidentified.
For all these reasons, a survey of the inner part of the Galaxy provides an efficient way to search for -ray emission in order to investigate properties of source classes and search for yet unknown types of Galactic VHE -ray emitters.
At TeV energies the Milagro water-Cherenkov detector (Atkins et al., 2004) and the Tibet air-shower array (Amenomori et al., 2002) have been used to perform large-scale surveys. While these instruments have the advantage of a very wide field of view ( sterad), the sensitivity obtained by these surveys is rather limited, reaching a flux limit comparable to the flux of the Crab Nebula, cm-2 s-1 (for GeV), in one year of observations. Both surveys covered sterad of the northern sky and revealed no previously unknown significant -ray sources. However, some evidence for -ray emission was found by the Milagro Collaboration from a region in the Cygnus constellation and another region close to the Crab Nebula (Smith et al., 2005). Recently the detection of diffuse emission from the Galactic Plane with Milagro has been reported (Fleysher et al., 2004).
The HEGRA instrument was the first array of imaging air Cherenkov telescopes to be used to survey a part of the Galactic Plane (Aharonian et al., 2002b). The range of Galactic longitudes () was observed; due to the location of HEGRA in the northern hemisphere and the resulting large zenith angles for observations of the centre of the Galactic Plane, the sensitivity was reduced for the central part of the Galaxy and the energy threshold of the observations ranged from 500 GeV to 7 TeV. No sources of VHE -rays were found in this survey, and upper limits between 15% of the Crab flux for Galactic longitudes and more than 30% of the Crab flux in the inner part of the Milky Way were derived.
Until the completion of the High Energy Stereoscopic System (H.E.S.S. ) (Hinton, 2004) in early 2004, no VHE -ray survey of comparable sensitivity of the southern sky, or of the central region of the Galaxy has been performed. In this paper we describe a survey of this region with H.E.S.S. between May and July 2004 at a flux sensitivity down to 2% of the Crab flux. The initial results from the survey including the description of the discovery of eight new sources have been summarised in Aharonian et al. (2005a). This work presents detailed results on these eight sources. In addition we report the detection of six additional weaker sources of VHE -rays extending to lower flux levels than our previous analysis. Spectral information and a more detailed study on the morphologies for all sources is provided. The paper is structured as follows: after a description of the H.E.S.S. instrument (section 2) and the Galactic survey dataset used in this paper (section 3), the data analysis technique is presented in section 4. Section 5 gives a detailed description of the individual sources along with possible counterparts in other wavebands, followed by a discussion of the results in section 6 and some conclusions in section 7.
2 The H.E.S.S. Instrument
H.E.S.S. is a system of four imaging atmospheric Cherenkov telescopes, located in the Khomas Highlands of Namibia at a height of 1800 m above sea level. H.E.S.S. has unprecedented sensitivity in the energy range from 100 GeV to several tens of TeV. The imaging Cherenkov technique exploits the cascade of secondary particles produced in interactions of primary -rays with molecules in the Earth’s upper atmosphere. These secondary particles emit Cherenkov light, which can be imaged by the Cherenkov telescopes. The energy and direction of the primary -rays can be reconstructed based on the intensity and shape of the detected Cherenkov light distribution.
Multiple views of the same particle shower with several telescopes improve background rejection capability and the angular and energy resolution of the instrument, in comparison to a single telescope. Therefore, H.E.S.S. observations are performed in a stereoscopic mode, whereby at least two of the four telescopes must be triggered by a shower for an event to be recorded (Funk et al., 2004). The telescopes each have a mirror area of 107 m2 (Bernlöhr et al., 2003; Cornils et al., 2003). The Cherenkov light is focussed onto fast 960 pixel photo-multiplier cameras, which record the Cherenkov light images (Vincent et al., 2003). The 5∘ diameter field of view of the H.E.S.S. cameras is the largest of all imaging Cherenkov detectors and is especially suited for the study of extended sources and the search for unknown sources in surveys. This was part of the original design concept for the H.E.S.S. telescope system (Aharonian et al., 1997a, b).
The H.E.S.S. instrument has an energy threshold of GeV at zenith before selection cuts, an angular resolution of for individual -rays and a point source sensitivity of cm-2 s-1 above 1 TeV (1% of the flux from the Crab Nebula) for a 5 detection in a 25 hour observation. The sensitivity of H.E.S.S. and the capability to map large extended sources has been demonstrated by the resolved images of the SNRs RX J1713.7–3946 (Aharonian et al., 2004a) and RX J0852.0–4622 (Aharonian et al., 2005c). The serendipitous detections of the unidentified source HESS J1303–631 in the field of view of the binary pulsar PSR B1259–63 and of the composite supernova remnant G 0.9+0.1 (Aharonian et al., 2005d) in the field of view of the Galactic Centre source HESS J1745–290 (Aharonian et al., 2004b) demonstrate the advantage of a large field of view. This large field of view implies that some sources are observed up to 2 degrees off the optical axis of the telescope system.
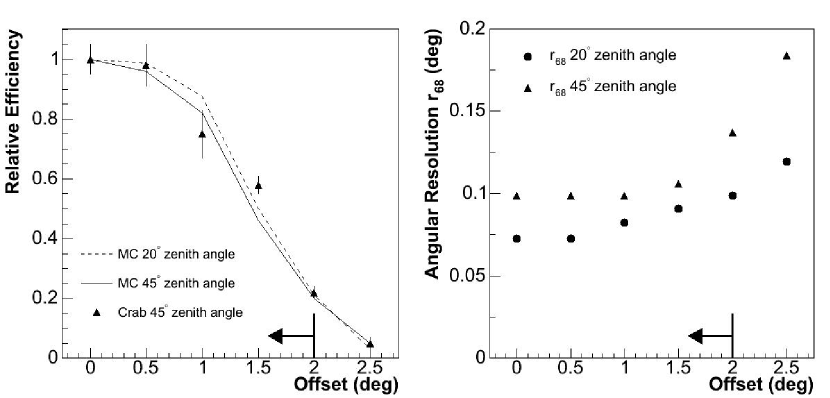
To illustrate the off-axis performance within the field of view of H.E.S.S., Figure 1 summarises some basic parameters as a function of the offset. The left panel shows the -ray efficiency relative to on-axis pointing, derived from Monte-Carlo simulations for two different zenith angles along with measurements of the Crab Nebula. The plot shows a weak dependence of the -ray efficiency on zenith angle and reasonable agreement between Monte-Carlo simulations and data. The right panel of Figure 1 shows the angular resolution of H.E.S.S. (specified by the 68% containment radius of the point spread function (PSF)) versus offset in the camera for observations at two different zenith angles. It is evident that the angular resolution is better than 0.1∘ and is reasonably constant in the inner 1.5∘ of the field of view.
3 The H.E.S.S. Galactic Plane survey
The survey was conducted in the Galactic longitude band around . Runs of 28 minutes duration were taken at pointing positions with a spacing of 0.7∘ in longitude in three strips in Galactic latitude: and . For the data analysis runs were selected based on weather and hardware conditions. 95 hours of quality-selected data were taken in the scan mode between May and July 2004. The observation schedule was optimised so that individual pointings were conducted near culmination, resulting in the smallest zenith angles accessible. Promising source candidates were re-observed between July and October 2004, yielding a further 30 good-quality hours of data. For the analysis described in the following, additional pointed observations of SNR RX J1713.7–3946 and of the Galactic Centre region are included. The total data set presented here amounts to 230 hours after quality selection, the mean zenith angle of all observations is 26∘. Figure 2 shows a map of exposure for this data set, expressed in terms of an equivalent number of hours observing a source at the centre of the field of view.
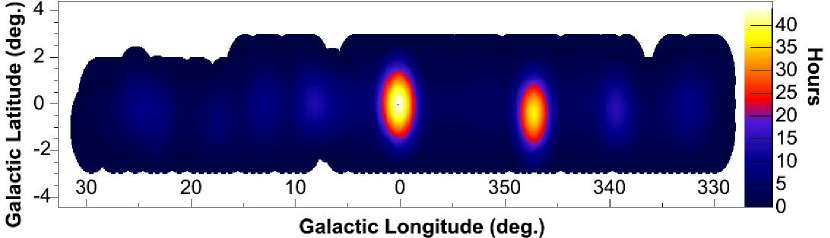
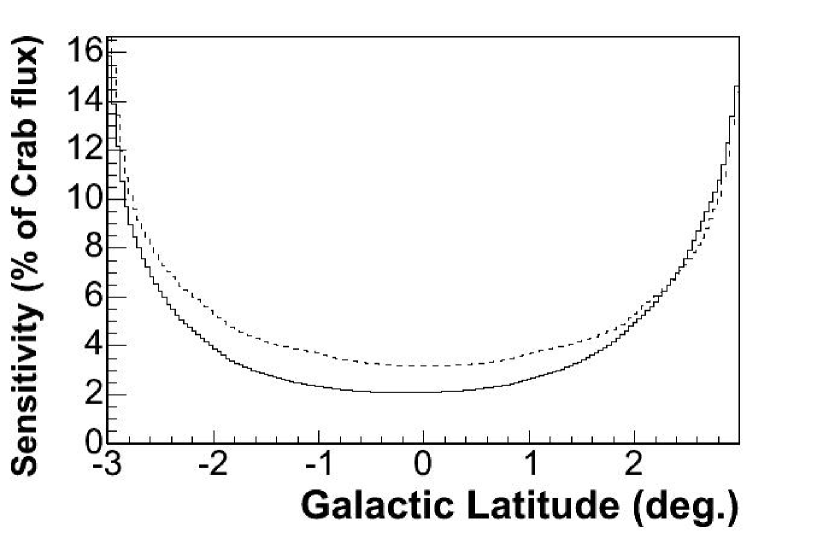
As can be seen from Figure 2, the exposure is not uniform with peak exposures in the regions around RX J1713.7–3946 and the Galactic Centre. This irregular exposure results in an uneven sensitivity for the detection of new sources. The sensitivity of the survey in Galactic latitude (averaged over the whole longitude range) is shown in Figure 3. For the sensitivity is rather flat at a level of 2% of the flux from the Crab Nebula, and deteriorates rapidly at ∘ from the Galactic Plane. The flux sensitivity above 200 GeV is % worse for a source with photon index compared to one with .
4 Data Analysis
Following calibration of the data (Aharonian et al., 2004c), the standard H.E.S.S. event reconstruction scheme was applied to the dataset. After tail-cut image cleaning and a Hillas parametrisation algorithm, the direction of the shower axis was reconstructed by intersection of the major axes of the Hillas ellipses. H.E.S.S. standard cuts (Aharonian et al., 2005e) on the width and length of these ellipses (scaled to the width and length expected from Monte-Carlo simulations) were used to suppress the hadronic background. An additional cut on the image size photo-electrons (p.e.) yields optimum sensitivity for weak sources provided that source spectra are not significantly steeper than that of the Crab Nebula. They result in an angular resolution of 0.08∘ (68% containment radius) and an energy threshold of 250 GeV. To reduce systematic effects which affect images close to the edge of the camera, only events reconstructed within a maximum distance of 2∘ from the pointing direction of the system were used for this analysis. The survey region was divided (a priori) into a grid of trial source positions with grid points spaced by 0.04∘, a value well below the angular resolution of the instrument. For each grid point in the scan region, the on-source signal was calculated by summing up all events within a circle of radius , (or deg2), where denotes the angular distance between the reconstructed event direction and the grid point. This cut is appropriate for slightly extended sources with respect to the angular resolution of the instrument and was chosen a-priori, since it is optimal for the detection of -ray sources with the average observed size of Galactic SNRs (Green, 2004). A search for very extended sources (relative to the angular resolution) using a larger cut yields similar results. A similar search for point-like sources with a deg2 cut revealed a subset of the sources presented here and, additionally, the point-like source HESS J1826–148, which is associated with the microquasar LS5039. The discovery of this source is reported elsewhere (Aharonian et al., 2005f).
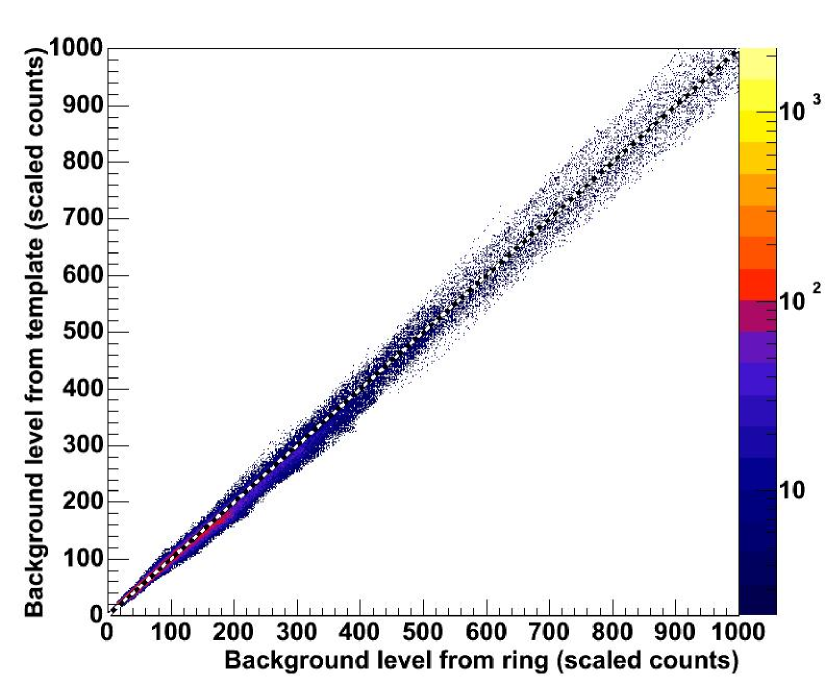
The background for each grid point was estimated using two different techniques. The standard H.E.S.S. background estimation method counts background events in a ring around each grid point with a mean radius of 0.5∘ and an area 7 times that of the on-region to estimate the background level. The standard ring radius of 0.5∘ was increased to 0.6∘ (again a priori) to improve sensitivity to extended sources. Using appropriate weight factors, this background determination takes into account the difference in system acceptance and exposure for the on- and the off-regions (Aharonian et al., 2005e). An alternative technique uses the template approach, where the background level is estimated using events that are normally rejected by the cosmic-ray background rejection criterion based on the scaled image width and length, but with reconstructed directions falling within the on-source region (Rowell, 2003). The normalisation in this case is determined by the overall ratio of events in both cut regimes, taking into account the ratio of relative acceptances in the two regimes. Figure 4 shows the correlation of the background level estimated for each grid point from the ring background and from the template background method. The slope of the major axis of the distribution is 1.007. This shows that the background estimates are consistent within 1%. The template background seems to slightly underestimate the background in comparison to the ring background. The ring background technique should therefore give a more conservative estimation of the significances of the new sources. In the following the ring background estimation method will be used as the standard method, since it is a robust method in which linear gradients in the system acceptance cancel out.
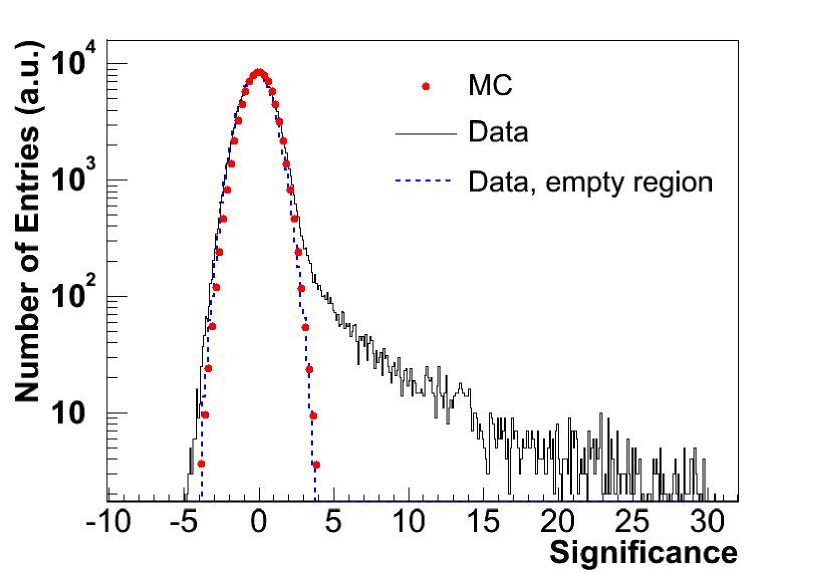
From the on-counts, the background level, and the relative background acceptance in the system, a statistical significance can be determined for each grid point in the map, testing the existence of a -ray source at the position of that grid point (using the approach of Li & Ma (1983)). A number of significant sources are detected and Table 1 gives the on-counts, the background level as derived from the ring background determination method (after accounting for the difference in acceptance and in the area between the on-source and the off-source region) and the resulting number of -ray excess events. Since the map contains a large number of test positions, this significance has to be corrected according to a “trial factor”. This trial factor accounts for the increased probability of finding a fake signal with an increased number of test positions for which a significance is calculated. Using a Monte-Carlo simulation of the technique applied to the survey data (including a realistic exposure map and randomly generating the events for each run from the acceptance function of that run), it has been found that this trial factor is somewhat lower than the number of points for which a significance is calculated, i.e. the number of grid points in the map (), since the excess counts for adjacent grid points are correlated, given that the integration radius is larger than the grid spacing. For uncorrelated grid points one would have exactly the factor . For the calculation of post-trials significances we conservatively assume that the number of trials is equal to the number of bins . Figure 5 shows the distribution of significances for all grid points in the map (solid black). The large positive tail to the distribution can be attributed to the existence of -ray-sources. The much smaller tail of negative significances is due to the existence of -ray sources in the regions used for background estimation. This effect has been minimised in a second iteration in which regions of significant -ray excess are excluded as background regions. Also shown in dashed blue is the distribution of significances for a region in the map without significant sources (, ). This distribution has been scaled to have the same peak height as the distribution of significances for all grid points (black). A Gaussian fit to this distribution yields a mean of with an RMS of , in tolerable agreement with the expected normal Gaussian distribution given the possibility of undetected -ray-emission in the on-source or off-source regions. The distribution of significances for a Monte-Carlo simulation of the survey without -ray sources, using the same analysis procedure as for data, is shown with red points. This distribution has also been scaled to have the same peak height as the distribution of significances for all grid points (black) and is consistent with a normal Gaussian, demonstrating that the analysis technique behaves as expected.
| Name | On-counts | Scaled Background | Excess |
|---|---|---|---|
| HESS J1614–518 | 517 | 283 | 234 |
| HESS J1616–508 | 766 | 356 | 410 |
| HESS J1632–478 | 232 | 139 | 93 |
| HESS J1634–472 | 275 | 175 | 100 |
| HESS J1640–465 | 611 | 298 | 313 |
| HESS J1702–420 | 311 | 210 | 101 |
| HESS J1708–410 | 955 | 728 | 227 |
| HESS J1713–381 | 917 | 728 | 189 |
| HESS J1745–303 | 1138 | 927 | 211 |
| HESS J1804–216 | 887 | 508 | 379 |
| HESS J1813–178 | 717 | 374 | 343 |
| HESS J1825–137 | 406 | 232 | 174 |
| HESS J1834–087 | 478 | 287 | 191 |
| HESS J1837–069 | 622 | 328 | 294 |
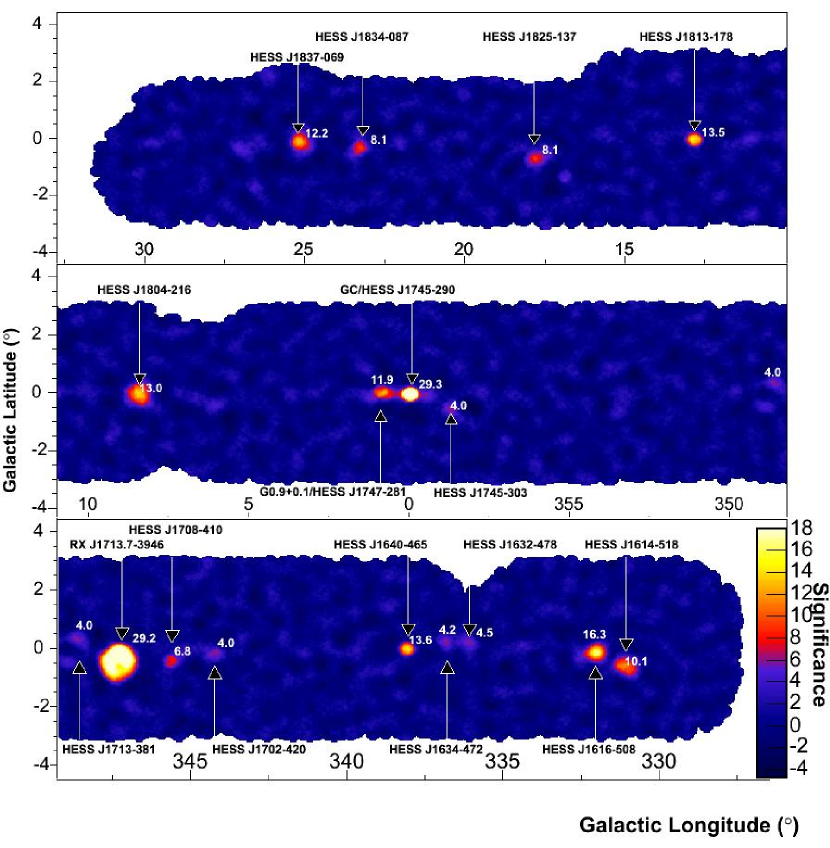
A post-trial significance (the effective detection significance) was calculated from the pre-trials significance by converting into a probability, recalculating the probability of the occurrence of one or more such events given the number of trials and converting this probability back into a significance. Grid points for which the post-trial significance is above 4.0 (corresponding to 6.3 before trials) are considered as likely sources of VHE -rays and are included in the following discussion. The probability of a single fake signal at this level is in the whole survey. Figure 6 shows the map of significances before accounting for the trial factor with the background estimated from the ring technique. The strong -ray sources RX J1713.7–3946 and HESS J1745–290 clearly stand out, partly because of the high exposure in this regions. Also visible at a much fainter level is the recently published new -ray source G 0.9+0.1 (Aharonian et al., 2005d), which was serendipitously detected in the H.E.S.S. observations of the Galactic Centre region. In addition to these three known objects, fourteen new sources of VHE -rays are detected at a significance level above 4 (post-trials), the eight most significant of which have been discussed in a previous publication (Aharonian et al., 2005a). Table 2 shows the pre-trials significance for the peak positions in the map for the new sources in column and the significance after accounting for the number of trials in column . Column shows the post-trial significance applying a cut appropriate for point sources () instead of the extended source cut . Only two of the new sources (HESS J1640–465 and HESS J1813-178) show a non-marginal increase in significance using the point-source cut . The extension of the new sources will be discussed in the next section. It should be noted, that the five sources with detection significances below 5 should be considered as source candidates, rather than firmly establish sources. Reobservation of these sources will be necessary to confirm these marginal detections.
| Name | Best Fit Position | Significance | Live time | |||||
|---|---|---|---|---|---|---|---|---|
| (∘) | (∘) | RA (∘) | Dec(∘) | |||||
| HESS J1614–518† | 331.52 | –0.58 | 243.58 | –51.82 | 11.2 | 10.1 | 7.5 | 9.8 |
| HESS J1616–508† | 332.39 | –0.14 | 244.10 | –50.90 | 17.1 | 16.3 | 9.7 | 10.2 |
| HESS J1632–478 | 336.38 | 0.19 | 248.04 | –47.82 | 6.6 | 4.5 | - | 4.5 |
| HESS J1634–472 | 337.11 | 0.22 | 248.74 | –47.27 | 6.4 | 4.2 | 1.8 | 6.6 |
| HESS J1640–465† | 338.32 | –0.02 | 250.18 | –46.53 | 14.5 | 13.6 | 14.5 | 14.3 |
| HESS J1702–420 | 344.26 | –0.22 | 255.69 | –42.07 | 6.3 | 4.0 | 4.1 | 5.7 |
| HESS J1708–410 | 345.67 | –0.44 | 257.06 | –41.08 | 8.4 | 6.8 | 6.9 | 37.4 |
| HESS J1713–381 | 348.65 | 0.38 | 258.49 | –38.20 | 6.3 | 4.0 | 1.4 | 37.3 |
| HESS J1745–303 | 358.71 | –0.64 | 266.26 | –30.37 | 6.3 | 4.0 | 1.8 | 35.3 |
| HESS J1804–216† | 8.40 | –0.03 | 271.13 | –21.70 | 13.9 | 13.0 | 7.7 | 15.7 |
| HESS J1813–178† | 12.81 | –0.03 | 273.40 | –17.84 | 14.4 | 13.5 | 15.3 | 9.7 |
| HESS J1825–137† | 17.82 | –0.74 | 276.51 | –13.76 | 9.5 | 8.1 | 3.7 | 8.4 |
| HESS J1834–087† | 23.24 | –0.32 | 278.69 | –8.76 | 9.5 | 8.1 | 5.7 | 7.3 |
| HESS J1837–069† | 25.18 | –0.11 | 279.41 | –6.95 | 13.2 | 12.2 | 9.9 | 7.6 |
5 Characteristics of the new sources
This section describes the main results and the analysis techniques that were applied to provide information about position, extension and spectra of the new VHE -ray sources.
5.1 Position and Morphology
A detailed spectral and positional analysis has been performed on the fourteen sources listed in Table 2. For this purpose, the distribution of -ray candidates was determined for fine angular bins of width 0.005∘, to allow for a more accurate determination of the source position. For the position and approximate size determination of each source, the spatial distribution of events in the (uncorrelated) bins was fit to a model of a 2-D Gaussian -ray brightness profile of the form , convolved with the PSF of the instrument, and an added background parametrisation. To properly handle the small number of events in the bins, a likelihood fit appropriate for Poisson statistics was applied in this procedure. To test for possible elongation of each emission region, an elongated Gaussian with independent and in each dimension and a free orientation angle (measured counter-clockwise from the positive Galactic latitude axis) was also fit. The source is flagged as elongated if the error range in best fit minor axis is outside that of the best fit major axis . This fitting procedure has been tested using Monte-Carlo simulations under realistic conditions. The re-analysis of the source positions presented here in comparison to (Aharonian et al., 2005a) yields a maximum shift of 2–3 arc minutes for the most extended of these sources, reflecting the more detailed study presented here. The new positions are consistent within errors with the previously published positions. Also the previously reported extensions are confirmed by the more detailed analysis presented here, with the exception of HESS J1834-087, where the extension was overestimated due to the non-Gaussian shape of the source and is now determined to be 0.09∘ rather than 0.20∘.
The system PSF (see Figure 1) has been derived from Monte Carlo simulations as a function of the zenith angle of observations and of the offset of a source in the field of view. This model PSF is consistent with the excesses observed for the point-like Crab Nebula and the active galaxy PKS 2155–304 (Aharonian et al., 2005e). Table 3 shows the best fit position, the best fit Gaussian equivalent sizes and , and the orientation (in case of elongation) of the fourteen sources. To quantify the quality of the fit, the last column of Table 3 shows the normalised between the model source shape and the measured radial profile fo each source.
| Name | Best Fit Position | |||||
|---|---|---|---|---|---|---|
| l (∘) | b (∘) | (∘) | (∘) | (∘) | ||
| J1614–518 | 331.520.03 | –0.580.02 | 0.230.02 | 0.150.02 | 4910 | 1.44 |
| J1616–508 | 332.3910.014 | –0.1380.013 | 0.1360.008 | - | - | 0.82 |
| J1632–478 | 336.380.04 | 0.190.03 | 0.210.05 | 0.060.04 | 2113 | 1.05 |
| J1634–472 | 337.110.05 | 0.220.04 | 0.110.03 | - | - | 0.72 |
| J1640–465 | 338.3160.007 | –0.0210.007 | 0.0450.009 | - | - | 0.91 |
| J1702–420 | 344.260.04 | –0.220.03 | 0.080.04 | - | - | 1.38 |
| J1708–410 | 345.6720.013 | –0.4380.010 | 0.0540.012 | - | - | 0.86 |
| J1713–381 | 348.650.03 | 0.380.03 | 0.060.04 | - | - | 1.04 |
| J1745–303 | 358.710.04 | –0.640.05 | 0.210.06 | 0.090.04 | 547 | 1.17 |
| J1804–216 | 8.401 0.016 | –0.0330.018 | 0.2000.010 | - | - | 1.34 |
| J1813–178 | 12.8130.005 | –0.03420.005 | 0.0360.006 | - | - | 0.94 |
| J1825–137 | 17.820.03 | –0.740.03 | 0.160.02 | - | - | 1.03 |
| J1834–087 | 23.240.02 | –0.320.02 | 0.090.02 | - | - | 1.16 |
| J1837–069 | 25.1850.012 | –0.1060.016 | 0.120.02 | 0.050.02 | 14910 | 1.52 |
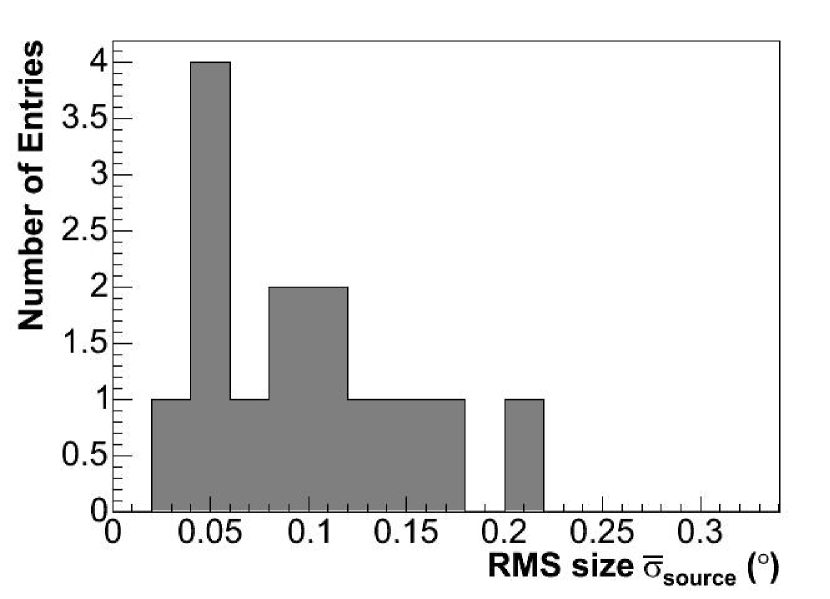
Figure 7 shows the distribution of sizes for the new sources. For the elongated sources, the arithmetic mean of and has been filled into the histogram. All but two of the sources appear significantly extended above a level of three standard deviations. Four out of fourteen appear significantly elongated, whereas the remaining ten new sources are compatible with a radially symmetric shape. The radial excess distributions of all sources are given individually in section 5.3.
5.2 Spectra
Using the best fit position, a spectral analysis was performed, again assuming a Gaussian emission region and using a cut of , approximating the H.E.S.S. PSF as a 2-D Gaussian with = 0.08∘ and being the optimal cut for point sources. Such a cut provides optimum significance for a weak Gaussian shaped source on a uniform background, and hence the best possible spectral determination. For the elongated sources, the larger of the two values and was used. The energy dependent efficiency of this cut is estimated by convolving the H.E.S.S. PSF with a Gaussian of size . This introduces an additional systematic error in the absolute flux determination since it implicitly assumes that the emission region of the source follows a Gaussian distribution and that the morphology of the source does not show any energy dependency. The typical overall systematic error in the determination of the integral flux level is estimated to be %. The standard H.E.S.S. spectral analysis technique is described in (Aharonian et al., 2005e). To avoid systematic errors in the spectral determination arising from different camera acceptances across the H.E.S.S. field of view, the spectral background determination employs regions of the same size and shape as the on region, but displaced on a ring in the field of view around the camera centre. The ring was chosen such that the off regions have the same angular distance to the centre as the on region. This approach ensures that background events are taken at the same zenith and offset angles.
To keep as many low-energy -rays as possible, a looser size cut of 80 photo-electrons is used in the spectral analysis. This cut allows to reach a lower energy threshold (150 GeV) at the expense of reduced sensitivity for hard-spectrum sources and a 30% poorer angular resolution. Flux points below a significance level of 2 standard deviations were discarded in the spectral analysis and the binning was doubled at high energies for weak sources. Table 4 lists the resulting photon index and flux above 200 GeV for a power-law fit . The typical systematic error on these photon indices is estimated to be . It should be noted, that the fluxes reported here are in general different from the fluxes reported in Aharonian et al. (2005a) (especially for the larger sources) since in the present work the flux is determined from a larger region, adapted to encompass a larger fraction of the emission region, whereas in Aharonian et al. (2005a), a fixed small deg2 cut was used for all sources.
| Name | Flux GeV | cut | /NDF | |
|---|---|---|---|---|
| ( cm-2 s-1) | (∘) | |||
| HESS J1614–518 | 2.460.20 | 57.87.7 | 0.40 | 0.6/3 |
| HESS J1616–508 | 2.350.06 | 43.32.0 | 0.26 | 5.5/5 |
| HESS J1632–478 | 2.120.20 | 28.75.3 | 0.36 | 7.9/2 |
| HESS J1634–472 | 2.380.27 | 13.42.6 | 0.23 | 5.8/5 |
| HESS J1640–465 | 2.420.15 | 20.92.2 | 0.16 | 3.7/4 |
| HESS J1702–420 | 2.310.15 | 15.91.8 | 0.20 | 7.8/6 |
| HESS J1708–410 | 2.340.11 | 8.80.7 | 0.17 | 6.3/3 |
| HESS J1713–381 | 2.270.48 | 4.21.5 | 0.17 | 1.8/2 |
| HESS J1745–303 | 1.820.29 | 11.24.0 | 0.36 | 4.4/3 |
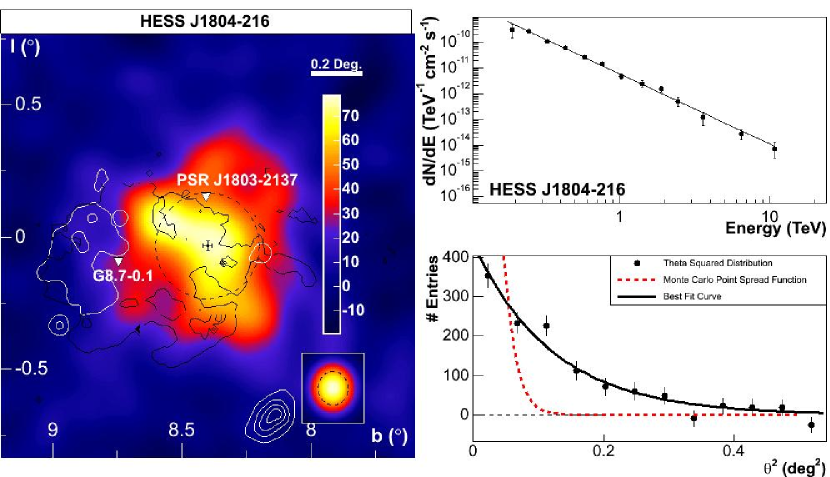
| HESS J1804–216 | 2.720.06 | 53.22.0 | 0.36 | 6.9/11 |
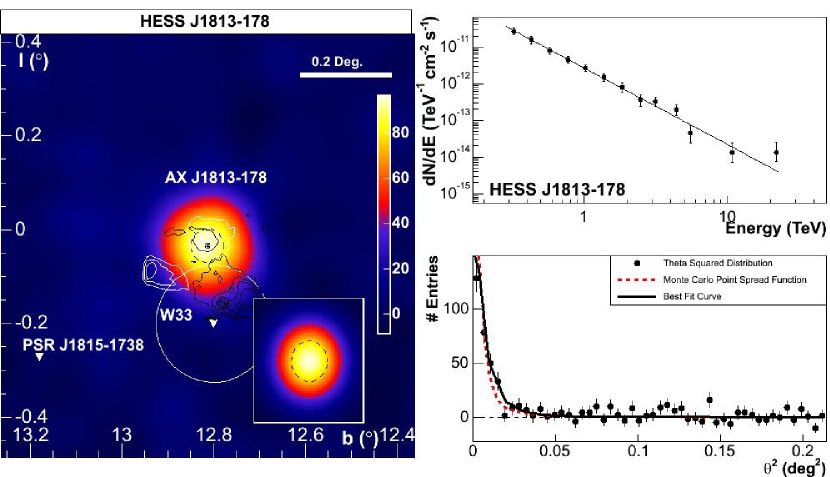
| HESS J1813–178 | 2.090.08 | 14.21.1 | 0.15 | 5.5/11 |
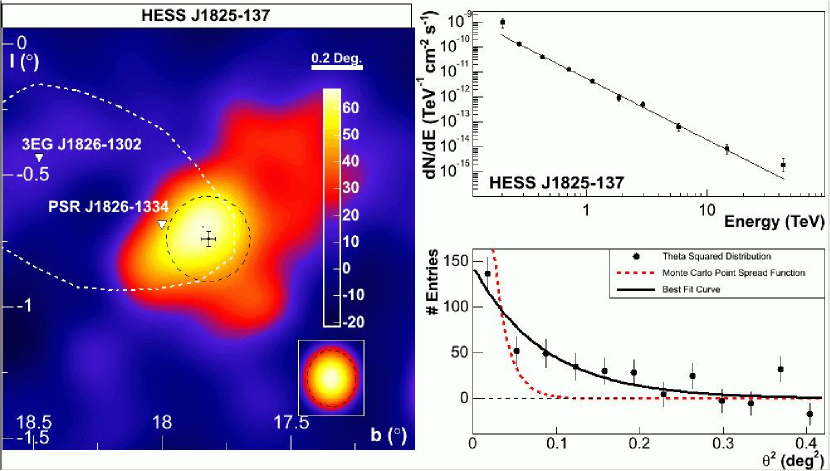
| HESS J1825–137 | 2.460.08 | 39.42.2 | 0.30 | 6.2/8 |
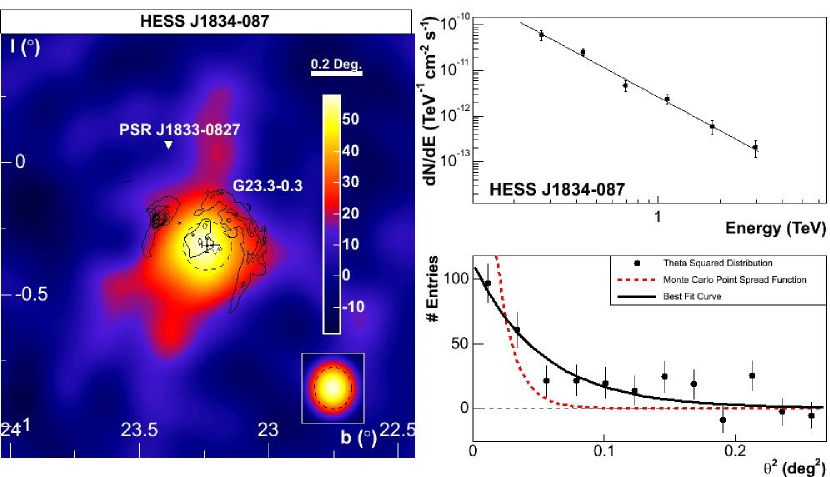
| HESS J1834–087 | 2.450.16 | 18.72.0 | 0.20 | 3.5/4 |
| HESS J1837–069 | 2.270.06 | 30.41.6 | 0.23 | 12.6/10 |
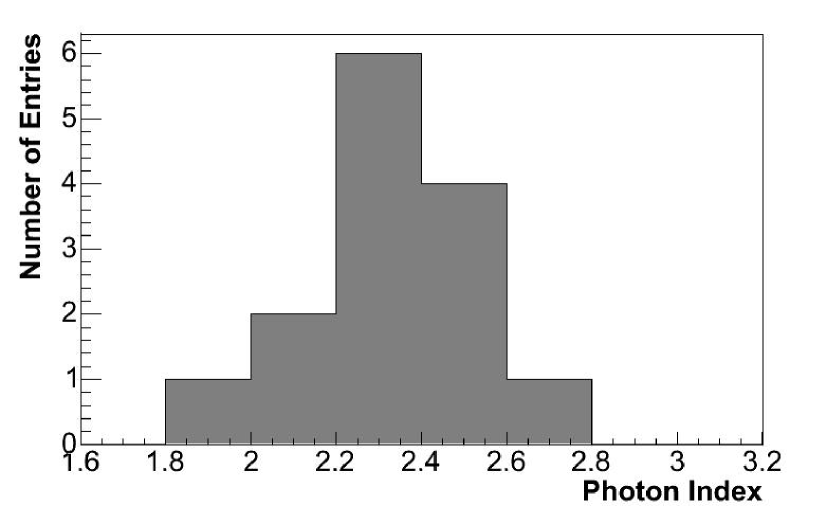
Figure 8 shows the distribution of photon indices for the fourteen new sources. The distribution exhibits a mean of 2.32, marginally consistent with predictions by models of shock wave acceleration in SNRs (see e.g. Berezhko & Völk (1997, 2002)) and as expected for the source spectrum of Galactic cosmic rays (see e.g Jones et al. (2001)). The distribution has an RMS of 0.2, comparable with the statistical errors on the measurements.
5.3 Individual -ray sources
This section describes the fourteen VHE -ray sources detected in the Galactic Plane survey individually along with a brief description of possible counterparts at other wavelengths. Excess maps are shown that have been smoothed with a two-dimensional Gaussian to reduce the effect of statistical fluctuations. The resulting count map is in units of integrated excess counts within the smoothing radius. The RMS radius of the Gaussian used for the smoothing is adapted for each source according to the available photon statistics. This radius is given in the figure captions, and is shown as a black dotted line in the inset in the lower right part of each excess map along with the PSF of the instrument, smoothed in the same way as the excess map. Note that the maps have different scales, therefore the white line in the upper right corner indicates an 0.2∘ scale. Further it should be noted that the colour scale covers different intervals for different maps.
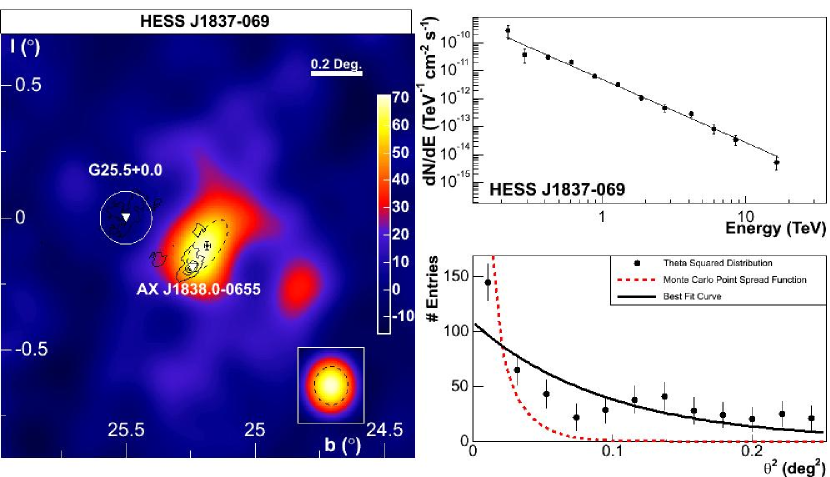
Also shown are possible counterparts to the VHE -ray emission: SNR from Green (2004) (with white circles illustrating their nominal radii), pulsars from the ATNF pulsar catalogue (Manchester et al., 2005) (as white triangles), hard X-ray sources detected by the International Gamma-Ray Laboratory (INTEGRAL) satellite (as white stars), and unidentified EGRET sources from the third EGRET catalogue (Hartman et al., 1999) (showing the 95% error contour for the position of the source in dashed white). In some maps contours of radio and/or X-ray emission are also shown and discussed individually. 20 cm Very large array (VLA) radio contours are taken from White, Becker & Helfand (2005). The x-ray ASCA data show smoothed count maps obtained with the GIS instrument in the 0.7–10 keV band. The best fit source position of the H.E.S.S. source is shown with error bars in black, the best fit (Gaussian) source size is shown as a black dashed circle or ellipse. The radial distribution of -ray excess with respect to the best-fit source position is shown for each source binned appropriately for the available photon statistics; in each plot the number of reconstructed events in bins of the squared angular distance () is shown along with the best-fit radially symmetric model (solid black line) and the PSF of the instrument (dashed red line), derived from Monte-Carlo simulations. For all sources the reconstructed differential energy spectra are shown together with the best-fit power-law (solid line).
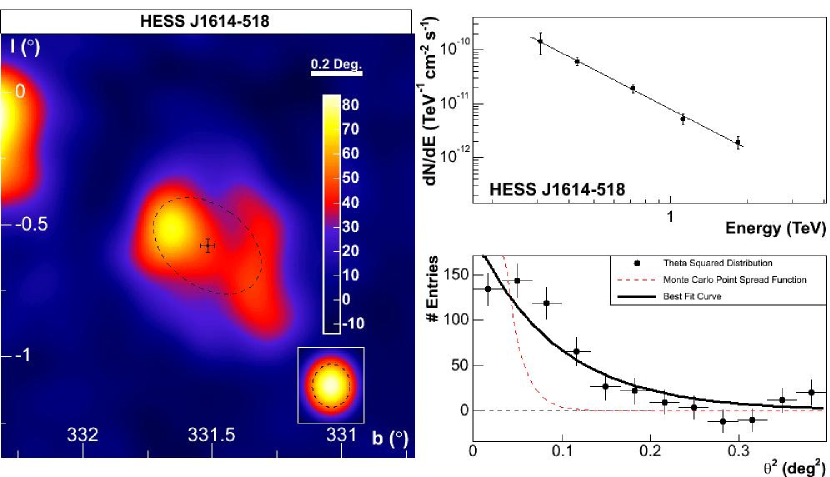
5.3.1 HESS J1614–518
This source (see Figure 9) is located in a region relatively devoid of counterpart candidates. The source exhibits elliptical emission with a semi major axis of 141 arc minutes and a semi minor axis of 91 arc minutes. HESS J1614–518 is the brightest of the new sources, detected with a flux corresponding to 25% of that from the Crab Nebula above 200 GeV. The spectrum is well fit by a power-law of photon index 2.460.20, see Figure 9 (top right). A nearby Chandra observation (Kastner et al., 2003) covered an area more than 10 arc minutes away from the best fit position of HESS J1614–518 and showed no evidence for X-ray emission from the direction of the H.E.S.S. source. The poor quality of the fit to the radial distribution of HESS J1614–518 as is shown in Figure 9 (bottom right) indicates that the source is not well described by a symmetrical Gaussian profile.
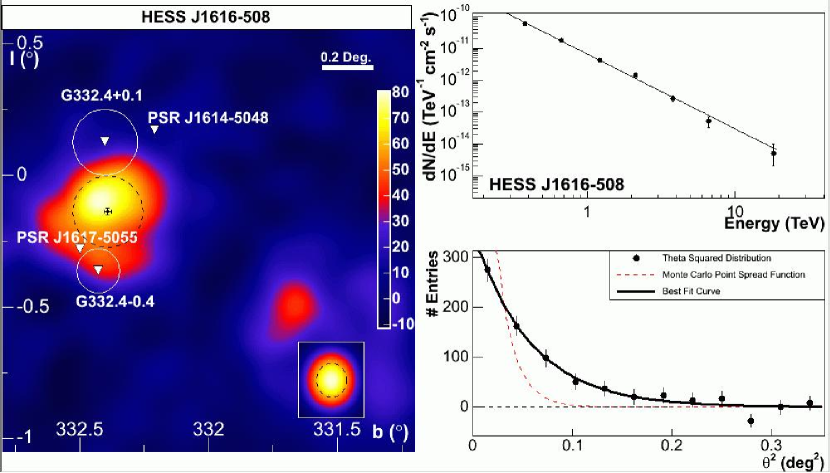
5.3.2 HESS J1616–508
HESS J1616–508 (see Figure 10) with a flux of 19% of the Crab Nebula above 200 GeV is also one of the brighter new sources of VHE -rays. Its spectrum can be fitted by a power-law of photon index 2.350.06 as shown in Figure 10 (top right). The emission region has an RMS size of 16 arc minutes and does not have a good positional match to any plausible counterpart at other wavelengths. It is located in a region close to the known SNRs G332.4–0.4 (RCW 103) and G332.4+0.1 (Kes 32). The region has been intensively studied with X-ray satellites like Chandra (Vink, 2004) and XMM, with the position of HESS J1616–508 mostly outside or at the edge of the field of view where the sensitivity is strongly decreased. No extended X-ray source that lines up with the VHE -ray emission has been found. Another interesting object in this region is the energetic pulsar PSR J1617–5055 (Torii et al., 1998), a young X-ray-emitting pulsar, that was proposed to emit TeV -rays (Hirotani, 2001). Approximately 1.2% of its spin-down luminosity would suffice to power the observed (0.2–10 TeV)VHE -ray flux, assuming the H.E.S.S. source is located at the pulsar distance. Since HESS J1616–508 does not line up with this object, an asymmetric (yet undetected) PWN nebula powered by the pulsar would be required to explain the TeV emission.
5.3.3 HESS J1632–478
The centroid position of this object (right hand source in Figure 11 (top)) and of the close-by HESS J1634–472 are spatially separated by less than 45 arc minutes. HESS J1632–478 has an elongated shape with a semi-major axis of 123 arc minutes and a semi-minor axis of 3.62.4 arc minutes. Its flux in VHE -rays above 200 GeV corresponds to 12% of the flux from the Crab Nebula and the spectrum can be fitted by a power-law of photon index 2.120.20 (see Figure 11 (bottom right)). A positional coincidence of HESS J1632–478 exists with the hard X-ray source IGR J16320–4751 discovered by the INTEGRAL satellite (Tomsick et al., 2003) in the energy range above 15 keV. In softer X-rays between 2 and 10 keV, this object was also strongly detected in an XMM-Newton observation (Rodriguez et al., 2003) and found to be coincident with the ASCA source AX J1631.9–4752, detected in the ASCA Galactic Plane survey (Sugizaki et al., 2001). This source is believed to belong to a new class of heavily absorbed high mass X-ray binary systems, with an equivalent absorption column density of cm-2 in this case. The extension of HESS J1632–478 does not plead in favor of an association with IGR J16320–4751. One should note that the probability of spurious associations is increased in this region of the Galactic plane (the 3 kpc arm tangent region) due to the high density of absorbed INTEGRAL sources. Another potential counterpart is the ASCA source AX J163252–4746.
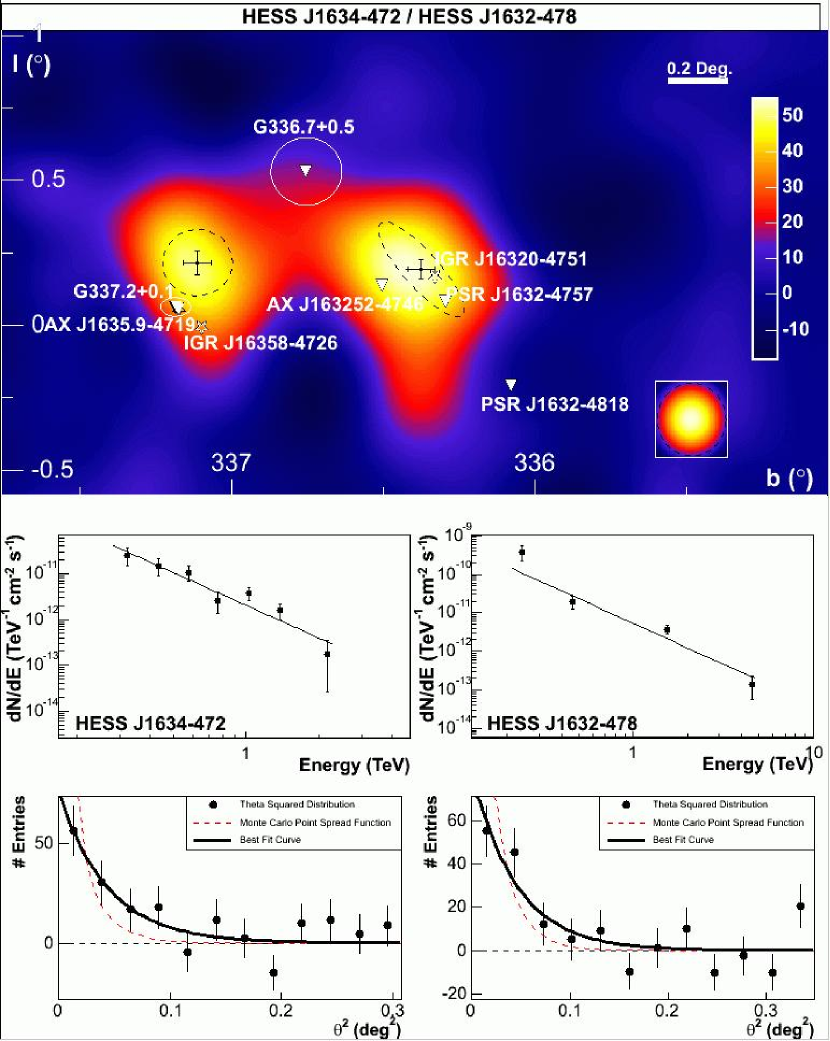
5.3.4 HESS J1634–472
The size of the HESS J1634–472 (left hand source in Figure 11 (top)) emission region is 6.61.8 arc minutes and its flux above 200 GeV is close to 6% of the Crab flux with a photon index for the energy spectrum of 2.380.26 (see Figure 11, centre left). HESS J1634–472 has no direct positional counterpart, although it is interesting to note that yet another INTEGRAL source IGR J16358–4726 is located close-by (Revnivtsev et al., 2003). This source presumably belongs to the class of highly absorbed X-ray binary systems, like IGR J16320–4751 (discussed in the previous paragraph). The source was detected in the 2–10 keV X-ray band with the Chandra satellite (Patel et al., 2004). The column density dermined for this object is cm-2 and the luminosity of this object in the 2–10 keV band is erg/s. Another potential counterpart of HESS J1634–472 is the recently discovered SNR candidate G337.2+0.1 (Combi et al., 2005), coincident with the ASCA source AX J1635.9–4719. However, the distances of the two objects to HESS J1634–472 renders a correlation unlikely.
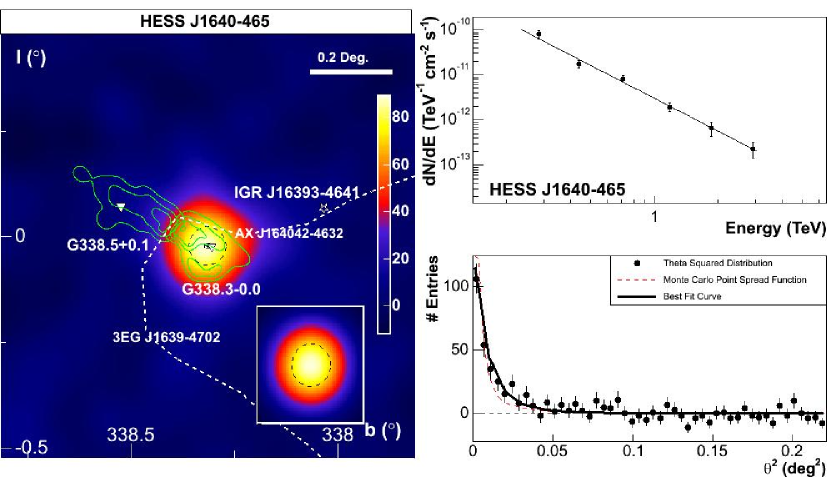
5.3.5 HESS J1640–465
As can be seen from the radial distribution of this source (see Figure 12 (bottom right)) HESS J1640–465 is marginally extended with respect to the PSF of the instrument. It is one of the few examples of a excellent spatial correlation between the VHE -ray emission and an SNR (G338.3–0.0), known from radio observations (Green, 2004). G338.3–0.0 was observed in the Molonglo Galactic Plane survey at 843 MHz (shown in green contours in Figure 12 (left)) and has been reported to be a broken shell SNR lying on the edge of a bright HII region (Whiteoak & Green, 1996). The region bridging this SNR and the close-by SNR G 338.5+0.1 is known to contain dense HII regions. The relation of surface-brightness to distance yields a distance of 8.6 kpc, which would place the SNR in the 3 kpc arm tangent region. The ASCA source AX J164042-4632 with a photon index of and a flux level of ergs cm-2 s-1, detected during the ASCA Galactic Plane survey (Sugizaki et al., 2001), has been identified with G338.3–0.0. It should be noted, that the position of HESS J1640–465 is compatible with the position of the unidentified EGRET source 3EG J1639–4702 (Hartman et al., 1999). The 95% positional confidence contour of 3EG J1639–4702 is shown in Figure 12 (left). The distance of HESS J1640–465 to this EGRET source is 34 arc minutes. The differential energy spectrum of HESS J1640–465 can be well fit by a power-law with photon index 2.420.14 at a flux close to 9% of that from the Crab Nebula above 200 GeV (see Figure 12 (top right)). A simple power-law extrapolation of the VHE gamma-ray spectrum to 1 GeV matches the EGRET flux above that energy.
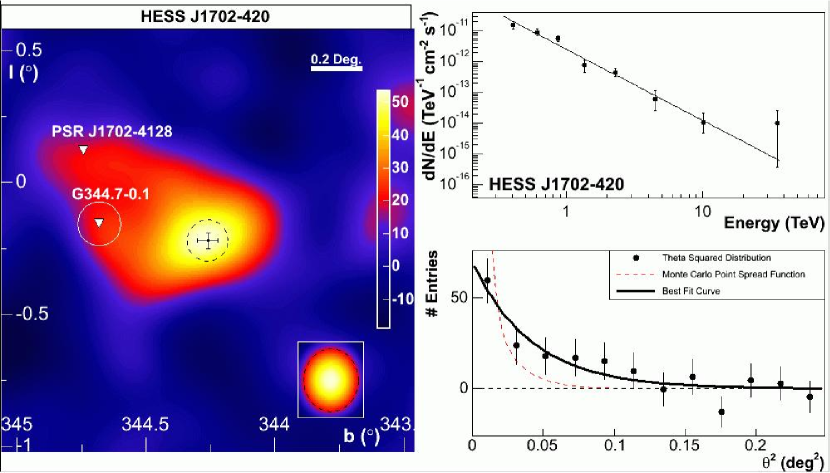
5.3.6 HESS J1702–420
For HESS J1702–420 (Figure 13) no significant evidence for extension of the emission region can be derived beyond a level of 2 standard deviations for the measured source size of 4.82.4 arc minutes. The flux above 200 GeV of this source corresponds to 7% of the Crab flux and the energy spectrum can be fitted by a power-law of photon index 2.310.15 (see Figure 13 (top right)). The close-by pulsar PSR J1702–4128 is energetic enough to account for the observed VHE -ray emission by converting roughly 14% of its spin-down luminosity but would need an asymmetric PWN to be responsible for the observed VHE -ray emission. No asymmetric PWN has been detected from this pulsar, however, which renders an association unlikely. The nearby SNR G 344.7–0.1 is too small and not positionally coincident with the VHE -ray-source. Therefore, we cannot identify a plausible counterpart for this object.
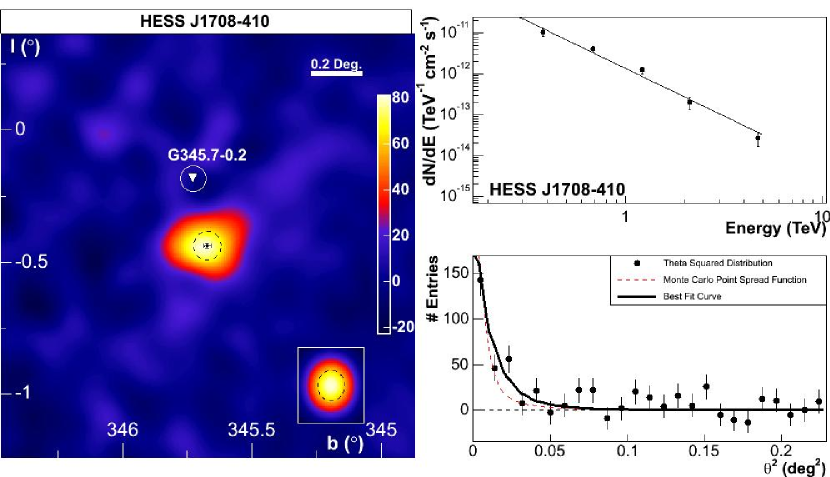
5.3.7 HESS J1708–410
This VHE -ray source (Figure 14) of size 3.20.7 arc minutes is located very close to SNR RX J1713.7–3946 and therefore its observation live time (within 2∘ of the pointing position of the instrument) amounts to 37.2 hours, well beyond typical exposures in the H.E.S.S. survey. The source exhibits an energy spectrum with a power-law index of 2.340.11, the flux above 200 GeV is less than 4% of the flux from the Crab Nebula (see Figure 14 (top right)). As can be seen from Figure 14 (left), there is no close-by plausible counterpart. A nearby XMM observation of the SNR G345.7–0.2 has revealed no X-ray counterpart to the VHE -ray source, but it should be noted that the offset of HESS J1708–410 from the centre of the XMM field of view was 15 arc minutes, positioning it close to the edge of the field of view. As can be seen from the radial distribution, shown in Figure 14 (bottom right), the source is only marginally extended with respect to the PSF of the instrument.
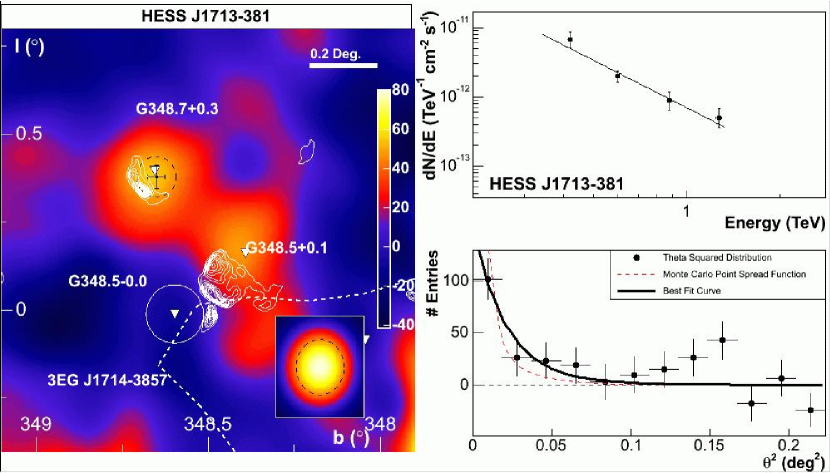
5.3.8 HESS J1713–381
This source (Figure 15) is the second of the fourteen VHE sources that shows no significant evidence beyond 2 standard deviations for an extension of the emission region. The energy spectrum of HESS J1713–381 is consistent with a power-law with photon index 2.20.5. Its flux of 1.8% of the flux from the Crab Nebula above 200 GeV makes this object the weakest of the new sources. Its location is very close to the strong VHE -ray source SNR RX J1713.7–3946 and it was therefore in the field of view of most pointed observations by H.E.S.S. on this object. The correspondingly deep exposure of 37 hours at offsets of less than 2∘ from the centre of the field of view made it possible to detect this object. As can be seen from Figure 15 (left), it coincides with part of the unusual SNR complex CTB 37. The radio contours of the CTB 37 complex as taken from the Molonglo Plane survey at 843 MHz are shown in white (Green et al., 1999). There is clear positional match between the source HESS J1713–381 and the SNR G 348.7+0.3 (CTB 37 B). Also visible in Figure 15 (right) is a weaker marginal source consistent with the position of G 348.5+0.1 (CTB 37 A). The marginal detection of emission from this source is however not significant after accounting for all trials for the analysis of extended sources in this survey as described above. Kassim, Baum & Weiler (1991) describe CTB 37 A as two SNRs overlapping in projection: with the partial shell of G 348.7+0.1 in the west and the SNR G 348.5–0.0 to the east. Both SNRs in CTB 37A appear to be interacting with a system of molecular clouds with densities of 100–1000 cm-3 (Reynoso & Mangum, 2000). The SNR CTB 37 B is less well studied but appears to share the dense environment of CTB 37 A. Evidence for X-ray emission from the CTB 37 complex can also be seen in archival ASCA data.
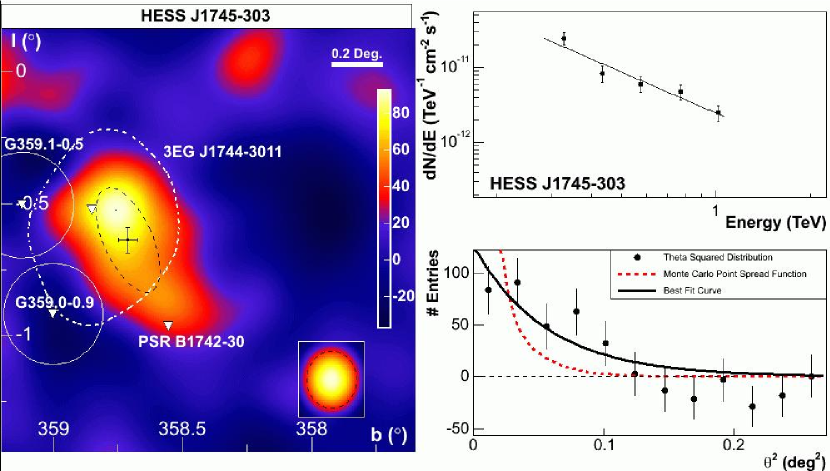
5.3.9 HESS J1745–303
This object (Figure 16) has a direct positional coincidence with an unidentified EGRET source (3EG J1744–3011) (Hartman et al., 1999). Since it is within the field of view of the Galactic Centre, HESS J1745–303 has a large observation live time of 35.3 hours. Its flux level corresponds to 5% of the flux from the Crab Nebula above 200 GeV and the emission exhibits a hard differential flux of index 1.80.3. Its emission region has an elliptical shape with a semi-major axis of 134 arc minutes and a semi-minor axis of 5.42.4 arc minutes as is shown in Figure 16 (left). The distance of HESS J1745–303 to the centroid of the EGRET source 3EG J1744–3011 is 10 arc minutes, which is well within the 95% uncertainty level of the EGRET position. A simple power-law extrapolation of the VHE -ray spectrum to energies above 1 GeV is an order of magnitude below the EGRET flux above that energy ( cm-2 s). Another potential counterpart is the pulsar PSR B1742–30 but essentially 100% of its spin-down power would be required to account for the entire VHE -ray emission.
5.3.10 HESS J1804–216
This source (Figure 17) with a size of approximately 22 arc minutes is the largest of the new emission regions of VHE -rays. With a flux of nearly 25% of the flux from the Crab Nebula above 200 GeV, it is also the brightest of the new H.E.S.S. sources. The photon index of 2.720.06 makes it one of the softest sources (see Figure 17 (top right)). As can be seen from Figure 17 (left), the emission region does not perfectly line up with any known object, although it could be associated with the south-western part of the shell of the SNR G8.7–0.1 of radius 26 arc minutes. From CO observations, the surrounding region is known to be associated with molecular gas where massive star formation takes place (Ojeda-May et al., 2002). The white contours in Figure 17 (left) show soft X-ray emission as detected by the ROSAT satellite (Finley & Ögelman, 1994), the black contours show the 20 cm radio emission as recorded with the VLA. Another plausible association of HESS J1804–216 is the young Vela-like pulsar PSR J1803–2137 with a spin-down age of 16000 years (Kassim & Weiler, 1990). The required efficiency of this pulsar’s spin-down luminosity to power the observed emission in -rays is only 3% and it could therefore easily account for the new source.
5.3.11 HESS J1813–178
With a moderate flux of approximately 6% of the Crab Nebula above 200 GeV, this source (see Figure 18) is among the more compact of the new sources with an extension of 2.2 arc minutes. When using a large cut of (, the normalisation of the power-law fit is 25% higher, suggesting a faint non-Gaussian tail in the radial brightness profile. The source exhibits a rather hard photon index of 2.090.08 (see Figure 18 (top right)). In the previous publication (Aharonian et al., 2005a) this source was still considered as unidentified. As it is clear from Figure 18 (left), there is a compelling positional coincidence between this source and the X-ray source AX J1813–178 (Brogan et al., 2005) (white contours in figure 18 for the 0.7–10 keV band). This ASCA source is one of the bright sources detected in the ASCA Galactic Plane survey with a very hard energy spectrum. This object was also recently detected in the INTEGRAL Galactic plane survey in the 20–100 keV energy band (Ubertini et al., 2005). The region surrounding HESS J1813–178 was also observed with the VLA and 20 cm radio contours are shown in black in Figure 18. There is a faint radio source (G 12.82–0.02) with a shell-like structure visible at the position of HESS J1813–178 as also recently reported (Brogan et al., 2005; Helfand, Becker & White, 2005). This indicates a probable association with a shell-type SNR. Additionally HESS J1813–178 lies 10 arc minutes from the centre of the radio source W 33. W 33 extends over 15 arc minutes and has a compact radio core (G 12.8–0.2) which is 1 arc minute across (Haschick & Ho, 1983), located arc minutes away from HESS J1813–178. The W 33 region shows signature of an ultra-compact HII region (Churchwell, 1990) and contains methanol, hydroxyl and water masers and other tracers of recent star formation, that could act as target material for the generation of VHE -rays but is not coincident with the H.E.S.S. source.
5.3.12 HESS J1825–137
This source has an energy spectrum with a photon index of 2.460.08 and a flux of VHE -rays of approximately 17% of the flux from the Crab Nebula above 200 GeV (see Figure 19 (top right)). It is approximately radially symmetric and the emission region can be best described by a Gaussian of width 10 arc minutes. The position of HESS J1825–137 is approximately 11 arc minutes to negative Galactic longitudes of the young pulsar PSR B1823–13 (PSR J1826–1334), which makes an association of the VHE -ray source with the pulsar possible. The pulsar PSR B1823–13 is a 101 ms evolved Vela-like pulsar at a distance of 3.90.4 kpc and at this distance the VHE luminosity of HESS J1825–137 would only be 2% of its spin-down power. The region surrounding the pulsar has been previously observed at large zenith angles by the Whipple collaboration (Hall et al., 2003), who observed a 3.1 excess also to negative Galactic longitudes with respect to the pulsar position. X-ray observations with the XMM-Newton satellite show a 5 arc minutes diameter diffuse emission region extending also asymmetrically to negative Galactic longitudes from the pulsar (Gaensler et al., 2003). If the VHE -ray source is indeed associated with this pulsar wind nebula, the VHE emission region would extend much further to the south than in X-rays. PSR B1823–13 was also proposed to power the close-by unidentified EGRET source 3EG J1826–1302 (Nolan et al., 2003). The distance of the centroid of this EGRET source to HESS J1825–137 is 43 arc minutes. As illustrated in Figure 19 (left), the new VHE -ray source is well compatible with the EGRET source within the 95% positional error of EGRET and a simple power-law extrapolation of the H.E.S.S. energy spectrum to energies above 1 GeV gives a similar flux as derived from the EGRET spectrum above this energy. An in-depth study of HESS J1825–137 and dicussion about the corresponding PWN model will be given in a separate paper (Aharonian et al., 2005h).
5.3.13 HESS J1834–087
HESS J1834–087 (Figure 20) has a size of 12 arc minutes and a -ray flux of 8% of the flux from the Crab Nebula above 200 GeV. Its energy spectrum exhibits a photon index of 2.450.16 (see Figure 20 (top right)). When using a large cut of ()2, the normalisation of the power-law fit increases by 30%, suggesting a deviation of the morphology from the assumed radial Gaussian brightness profile. The location of HESS J1834–087 makes it another source with a compelling positional agreement with an SNR (see Figure 20 (left)). The positionally coincident shell-type SNR G23.3–0.3 (W 41) with a diameter of 27 arc minutes was mapped in radio with the VLA at 330 MHz (Kassim, 1992) and at 20 cm (White, Becker & Helfand, 2005) as shown in black contours in Figure 20 (left). It is possibly connected to the old pulsar PSR J1833–0827 (Gaensler & Johnston, 1995). This pulsar is energetic enough to power HESS J1834–087, but its distance of 24 arc minutes renders an association unlikely; there is also no extended PWN detected so far.
5.3.14 HESS J1837–069
This source (Figure 21) has an elongated shape with a semi-major axis of 71 arc minutes and a semi-minor axis of 31 arc minutes. With a flux of 13.4% of the Crab flux above 200 GeV, the energy spectrum can be well fitted by a power-law of photon index 2.270.06 (see Figure 21 (top right)). When using a large cut of (, the normalisation of the power-law fit increases by 30%, suggesting that the assumption of a Gaussian brightness profile does not hold for this source. HESS J1837–069 coincides with the southern part of the diffuse hard X-ray complex G25.5+0.0. This source, which is 12 arc minutes across, was detected in the ASCA Galactic Plane survey (Bamba et al., 2003). The nature of this bright X-ray source is unclear but it may be an X-ray synchrotron emission dominated SNR such as SN 1006 or a PWN. The brightest feature in the ASCA map (AX J1838.0–0655), located south of G25.5+0.0, coincides with the VHE emission. This still unidentified source was also serendipitously detected by BeppoSAX and also in the hard X-ray (20–100 keV) band in the Galactic Plane survey of INTEGRAL (Malizia et al., 2004).
6 Discussion
Possible multi-wavelength associations of the fourteen new VHE -ray sources were discussed in the previous section and are summarised in Table 5. A further qualification from tentative associations to unambiguous counterpart identifications requires spatial or morphological coincidence, a viable -ray emission mechanism for the object, and consistent multi-wavelength behaviour according to the properties of the suggested identification. Most of the possible associations given above can be considered as plausible -ray emitters, but only in a minority of these cases does a satisfactory positional coincidence exist. Four of the new sources apparently line up with SNRs. These SNRs have been detected and studied mostly in the radio domain, but in the cases of HESS J1640-465 and HESS J1813-178 X-ray emission was detected by ASCA, and there is marginal evidence for X-ray emission in ASCA archival data in the case of HESS J1713-381. Only in the case of HESS J1834-087 is there currently no evidence for associated X-ray emission.
For three of the new sources, namely HESS J1616–509, HESS J1804–216 and HESS J1825–137, a sufficiently energetic nearby pulsar could account for the VHE -ray emission but the offset of the sources from the pulsar positions makes these associations less firm. Three of the new VHE -ray sources are consistent with the 95% positional error of unidentified EGRET sources: HESS J1640–465, HESS J1745–303 and HESS J1825–137. Two of the new sources are located very close to a new class of highly absorbed hard X-ray sources detected recently by INTEGRAL (HESS J1632–478 and HESS J1634–472). A third source (HESS J1837–067) may be related to X-ray emission of unknown origin detected by ASCA and INTEGRAL, which may belong to the same class of objects. The three remaining sources (HESS J1614–518, HESS J1702–420 and HESS J1708–410) have no plausible SNR, pulsar or EGRET counterpart and may belong to a new source class. Significant fluxes of VHE -rays without accompanying X-ray and radio emission would suggest the absence of relativistic electrons and the presence of energetic nucleons. That such a population exists is already being suggested by the detection of apparently “dark” accelerators by the HEGRA (Aharonian et al., 2002a) and H.E.S.S. (Aharonian et al., 2005b) collaborations. However, the possibility remains that these new sources are associated with SNRs or PWN as yet undiscovered at other wavelengths. Further multi-wavelength investigations are needed to clarify this picture.
The nearest energy band relative to the H.E.S.S. energy range was covered by observations with EGRET aboard the Compton Gamma-Ray Observatory. Its energy coverage was primarily between 30 MeV and 10 GeV and -ray source detections above 100 MeV resulted in the third EGRET (3EG) catalogue (Hartman et al., 1999). The only Galactic sources detected above 10 GeV are pulsars, for which the sparse photons at these energies correlate with the location and the pulse profile at lower EGRET energies (Thompson, Bertsch & O’Neal, 2005). The bulk of photons above 10 GeV have to be attributed to Galactic (and extra-galactic) diffuse emission.
When comparing the EGRET sources with the H.E.S.S. Galactic Plane survey result, it should be noted that even if an EGRET source spectrum is measured up to 10 GeV, more than a decade in energy is left uncovered below the H.E.S.S. energy threshold. Indeed, only a minor fraction of the H.E.S.S. sources coincide within the considerably larger location uncertainty contours of EGRET sources. These sources are HESS J1640–465, HESS J1745–303, and HESS J1825–137, which are consistent with the 95% location uncertainty of the unidentified EGRET sources 3EG J1639–4702, 3EG J1744–3011, and 3EG J1826–1302. In total 17 EGRET sources are catalogued within the H.E.S.S. survey region. Taking into account the 95% positional error contours, they cover an area of 9.76 deg2, resulting in a chance positional coincidence of a given H.E.S.S. source with an EGRET source of 32%. A correlated Galactic latitude distribution of the EGRET and H.E.S.S. sources, concentrated near the Galactic plane, could increase this probability.
Physical arguments suggest that the EGRET source population and the set of new H.E.S.S. sources might be of different kinds. While the brightest -ray pulsars can be directly traced up to GeV, EGRET data indicate the existence of GeV-cutoffs already in the 2–10 GeV range (Reimer & Bertsch, 2001). The brightest pulsars, and several unidentified EGRET sources with pulsar-like characteristics deviate from single power-law spectral representations (Bertsch et al., 2000), and are significantly better fitted when introducing high-energy spectral cutoffs. GeV-cutoffs are indeed predicted from multi-frequency modelling of the -ray emission of pulsars (Cheng, 2004; Baring, 2004). Therefore, the emission of these unidentified EGRET sources may not extend up to the H.E.S.S. energy range. From Crab measurements by CELESTE (de Naurois et al., 2002), consecutively continuing the EGRET GeV-data, a characteristic change in the emission properties of the pulsar became apparent: pulsed emission is diminished or entirely absent, leaving only a steady emission component, in case of Crab attributed to the PWN. If the majority of EGRET sources in the Galactic Plane may be identifiable with -ray pulsars, this population will overlap with the H.E.S.S. energies only if a plerionic emission components exist.
For PWN there are theoretical grounds to expect in some cases a displacement of the -ray emission from the pulsar powering the nebula (Aharonian, Atoyan & Kifune, 1997; Blondin, Chevalier & Frierson, 2001). In such cases the association becomes more difficult to establish. Considering only pulsars with sufficient spin-down luminosity to explain the measured VHE -ray flux, four of the new sources have possible associations with pulsar wind nebulae. However, only in the case of HESS J1825–137, is there so far a convincing multi-wavelength argument for the offset from the pulsar position in the sense that an X-ray PWN offset in the source direction has been detected.
The sensitivity shown in Figure 3 is that for point-like (∘) sources. The sensitivity of H.E.S.S. decreases with increasing source size: , where ∘ for the analysis described here. As a consequence there is a bias in this survey against very extended sources. In particular, for sources larger than the size of the ring used for background estimation (0.6∘ radius) the flux threshold increases dramatically since the off-source region used for the background estimation then also contains flux from the source. This effect also introduces a bias against close-by sources, potentially resulting in a latitude distribution narrower than that of the parent population. An additional consequence of the ring background technique is that this survey is insensitive to weak diffuse emission. A search for diffuse emission in this dataset will be reported elsewhere. Another effect that has an impact on the width of the latitude distribution is source confusion. Assuming that all sources lie on the Galactic plane and using the mean RMS size of ∘ of the new sources, the chance probability of an overlap between any two of the 17 sources in the scan region is estimated to be 6%. Therefore, whilst source confusion could in principle widen the observed latitude distribution, we expect this effect to be small.
It is apparent from Table 5 that the most likely associations of the -ray sources lie at rather large distances (i.e. 4–10 kpc) within our Galaxy, and exhibit luminosities in the range 3–20 erg s-1. Three of the new sources are located in a region of the Galactic plane that lines up with the 3 kpc arm tangent region (HESS J1640–465, HESS J1632–478 and HESS J1634–472), which hints at a distance of 8 kpc. HESS J1614–518 and HESS J1616–508 are at a position in the plane that lines up with the Norma spiral arm. This arm appears to be one of the most important massive star forming regions of the Galaxy (Bronfman et al., 2000).
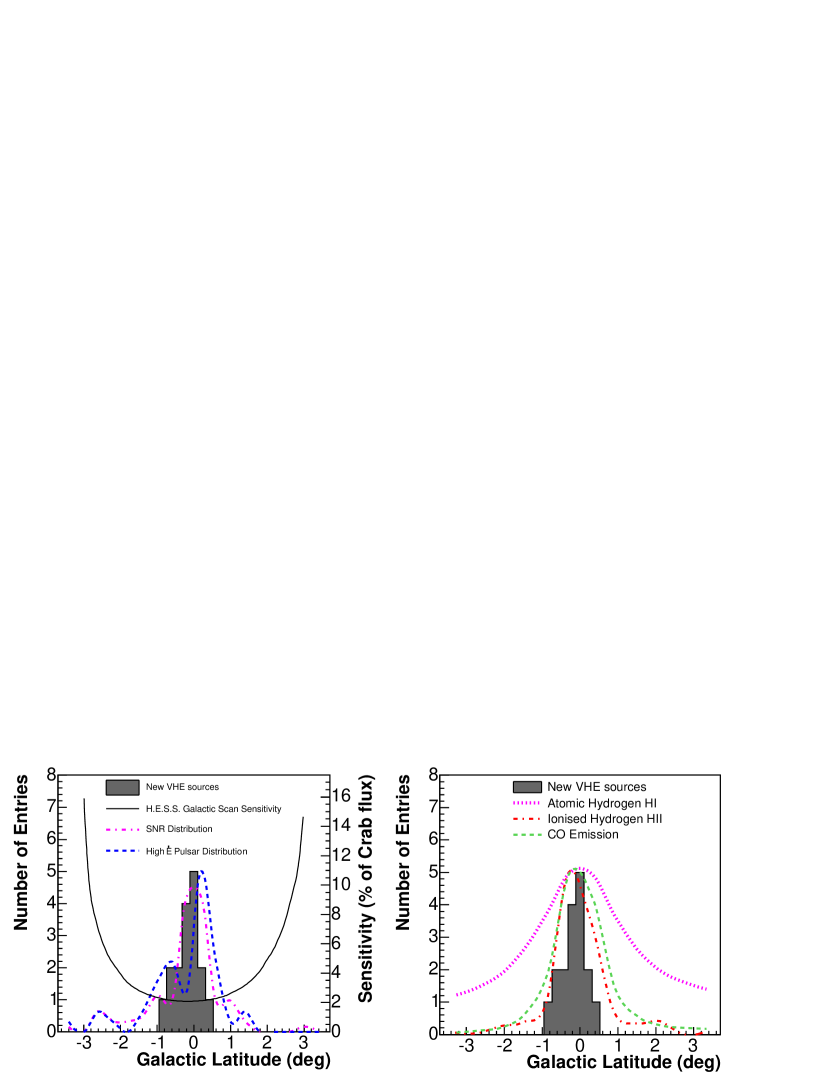
As it is clear from Table 5 it is difficult to explain the new VHE sources as belonging to a single source population. It is therefore not straight-forward to interpret the global properties of the sources. However, conventional Galactic particle accelerators such as young pulsars and SNRs have similar spatial distribution within the Galaxy. Molecular material and hence regions of star formation cluster rather close to the Galactic Plane, with an exponential scale height of 100 pc (Dame & Thaddeus, 1994). -ray sources associated with stellar death (and birth) (SNRs, young pulsars, OB associations) should therefore follow similar distributions (see Figure 22). To compare such candidate populations with the observed Galactic latitude distribution of the survey sources assumptions must be made about the luminosity distribution, the radial distribution in the Galaxy, and the intrinsic size of the sources. A simple Monte-Carlo simulation shows that the measured distribution of sources is rather insensitive to the assumed luminosity distribution.
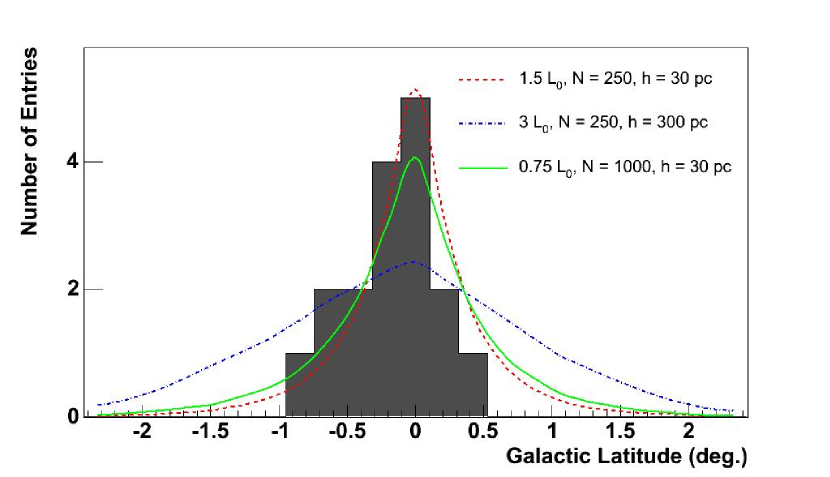
Taking the example case of SNRs as being a single class of counterparts to the new sources, it is possible to derive the expected properties of the detected -ray sources. For this exercise, the prescription of Drury, Aharonian & Völk (1994) as given in equation 1 is followed for the -ray emission of SNRs assuming supernova explosions with fixed energy erg s-1 occurring at a rate of 1/40 year-1 and with a -ray emitting lifetime of years. In this case, 250 -ray sources are expected within the Galactic disk. Assuming the radial distribution of SNRs suggested by Case & Bhattacharya (1996), the measured number of the VHE -ray sources is consistent with expectations for plausible values of conversion efficiency into accelerated particles and ISM density cm-3. As the sensitivity of the survey is reduced for extended sources, some assumption of the intrinsic size distribution of sources must be made. Here, the Sedov solution is assumed to determine the size of the -ray emission region for SNR, of randomly sampled age, expanding into an ISM of density . Reasonable agreement with the number and angular size of the detected sources are found for cm-3. Figure 23 shows the expected distributions from this simple model for a scale height in the Galactic disk of 30 pc (red curve) and 300 pc (blue curve). The green curve is as the red curve but with 4 times as many sources, each with half the luminosity, illustrating the relative insensitivity of the shape of the distribution on the assumed source luminosity distribution. The difference between the blue and the red curve illustrates that the H.E.S.S. survey has a broad enough sensitive coverage in to distinguish these two scenarios. For the 300 pc curve (blue), an intrinsic luminosity twice that of the 30 pc case has been assumed to give reasonable agreement with the number of detected sources. As can be seen from Figure 23 the experimental data favour a scale height for the parent population of pc in line with expectations for young SNRs and PWN or massive star forming regions.
| Name | Possible | Class | Offset | Distance | Luminosity |
| Counterpart | (arcmin) | (kpc) | ( erg s-1) | ||
| J1614–518 | - | - | - | - | - |
| J1616–508 | PSR J1617–5055 | PWN | 10.4 | 6.5 | 20.2 |
| J1632–478 | IGR J16320–4751 | XRB | 3 | - | - |
| J1634–472 | IGR J16358–4726 / G337.2+0.1 | XRB/SNR | 13/10 | -/14 | -/28.3 |
| J1640–465 | G 338.3–0.0/3EG J1639–4702 | SNR/UID | 0/34 | 8.6 | 16.2 |
| J1702–420 | - | - | - | - | - |
| J1708–410 | - | - | - | - | - |
| J1713–381 | G 348.7+0.3 | SNR | 0 | 10.2 | 5.2 |
| J1713–397 | RX J1713.7–3946 (G 347.3-0.5) | SNR | 0 | 1 | 1.2 |
| J1745–290 | Sgr A East/Sgr A⋆ | SNR/BH | 0 | 8.5 | 12.8 |
| J1745–303 | 3EG J1744–3011 | UID | 10 | - | - |
| J1747–281 | G0.9+0.1 | PWN | 0 | 8.5 | 4.4 |
| J1804–216 | G 8.7–0.1/PSR J1803–2137 | SNR/PWN | 21/10.8 | 6/3.9 | 16.5/7.0 |
| J1813–178 | G 12.82–0.02 | SNR | 0 | 4 | 3.1 |
| J1825–137 | PSR J1826–1334/3EG J1826–1302 | PWN/UID | 11/43 | 3.9/- | 6.1/- |
| J1834–087 | G 23.3–0.3 | SNR | 0 | 4.8 | 4.4 |
| J1837–069 | AX J1838.0–0655 | UID | 6 | - | - |
7 Conclusions
The inner part of our Galaxy now contains seventeen known sources of VHE -rays, compared to three before the H.E.S.S. survey. The increased number of sources allows us to consider the behaviour of populations of sources for the first time in this wave-band. A major task of multi-wavelength follow-up observations and archival searches now lies ahead to understand the processes at work in these astrophysical particle accelerators. The paradigm of cosmic-ray acceleration in SNRs is consistent with our new findings but it seems clear that the new sources are not drawn from a single population. Follow-up observations of the new sources with H.E.S.S. are planned as well as an extension of this survey into unexplored regions of the Galactic Plane.
References
- Aharonian et al. (1997a) Aharonian, F., Hofmann, W., Konopelko, A. K., & Völk, H. J. 1997a, APh, 6, 343
- Aharonian et al. (1997b) Aharonian, F., Hofmann, W., Konopelko, A. K., & Völk, H. J. 1997b, APh, 6, 369
- Aharonian, Atoyan & Kifune (1997) Aharonian, F., Atoyan, A. M., & Kifune, T. 1997, MNRAS, 291, 162
- Aharonian et al. (2002a) Aharonian, F., et al. 2002a, A&A, 393, L37
- Aharonian et al. (2002b) Aharonian, F., et al. 2002b, A&A, 395, 803
- Aharonian et al. (2004a) Aharonian, F., et al. (H.E.S.S. Collaboration) 2004a, Nature, 432, 75
- Aharonian et al. (2004b) Aharonian, F., et al. (H.E.S.S. Collaboration) 2004b, A&A, 425, L13
- Aharonian et al. (2004c) Aharonian, F., et al. (H.E.S.S. Collaboration) 2004c, APh, 22, 109
- Aharonian et al. (2005a) Aharonian, F., et al. (H.E.S.S. Collaboration) 2005a, Science, 307, 1938
- Aharonian et al. (2005b) Aharonian, F., et al. (H.E.S.S. Collaboration) 2005b, A&A, 439, 1013
- Aharonian et al. (2005c) Aharonian, F., et al. (H.E.S.S. Collaboration) 2005c, A&A, 437, L7
- Aharonian et al. (2005d) Aharonian, F., et al. (H.E.S.S. Collaboration) 2005d, A&A, 432, 25
- Aharonian et al. (2005e) Aharonian, F., et al. (H.E.S.S. Collaboration) 2005e, A&A, 430, 865
- Aharonian et al. (2005f) Aharonian, F., et al. (H.E.S.S. Collaboration) 2005f, Science, 309, 746
- Aharonian et al. (2005g) Aharonian, F., et al. (H.E.S.S. Collaboration) 2005g, A&A, 435, L17
- Aharonian et al. (2005h) Aharonian, F., et al. (H.E.S.S. Collaboration) 2005h, A&A, accepted
- Amenomori et al. (2002) Amenomori, M., et al. 2002, ApJ, 580, 887
- Atkins et al. (2004) Atkins, R., et al. 2004, ApJ, 608, 680
- Bamba et al. (2003) Bamba, A., Ueno, M., Koyama, K., Yamauchi, S. 2003, ApJ, 589, 253
- Baring (2004) Baring, M. G. 2004, AdSpR, 33, 552
- Benaglia et al. (2001) Benaglia, P., Romero, G. E., Stevens, I. R., & Torres, D. F. 2001, A&A, 366, 605
- Berezhko & Völk (1997) Berezhko, E. G., & Völk, H. J. 1997, APh, 7, 183
- Berezhko & Völk (2002) Berezhko, E. G., & Völk, H. J. 2000, A&A, 357, 283
- Bernlöhr et al. (2003) Bernlöhr, K., et al. 2003, APh, 20, 111
- Bertsch et al. (2000) Bertsch, D. L., et al. 1999, in Proc. 5th Compton Symposium, Portsmouth, ed. M. L. McConnell, & J. M. Ryan,(AIP 510), 504
- Blandford & Eichler (1987) Blandford, R., & Eichler, D. 1987, PhR, 154, 1
- Blondin, Chevalier & Frierson (2001) Blondin, J. M., Chevalier, R. A., & Frierson, D. M. 2001, ApJ, 563, 805
- Brogan et al. (2005) Brogan, C. L., Gaensler, B. M., Gelfand, J. D., Lazendic, J. S., Lazio, T. J., Kassim, N. E., & McClure-Griffiths, N. M. 2005, submitted to ApJL (available at http://xxx.lanl.gov/abs/astro-ph/0505145)
- Bronfman et al. (2000) Bronfman, L., Casassus, S., May, J., & Nyman, L.-A. 2000, A&A, 358, 521
- Case & Bhattacharya (1996) Case, G., & Bhattacharya, D. 1996, A&AS, 120, 437
- Cheng (2004) Cheng, K. S. 2004, AdSpR, 33, 561
- Churchwell (1990) Churchwell, E. 1990, A&ARv, 2, 79
- Combi et al. (2005) Combi, J. A., Benaglia, P., Romero, G. E., & Sugizaki, M. 2005, A&A, 431, L9
- Cornils et al. (2003) Cornils, R., et al. 2003, APh, 20, 129
- Dame & Thaddeus (1994) Dame, T. M., & Thaddeus, P. 1994, ApJ, 436, L173
- Dame, Hartman & Thaddeus (2001) Dame, T. M., Hartman, D., & Thaddeus, P. 2001, ApJ, 547, 792
- Dickey & Lockman (1990) Dickey, J. M., & Lockman, F. J. 1990, ARA&A, 28, 215
- Drury, Aharonian & Völk (1994) Drury, L. O’C, Aharonian, F., & Völk, H. J. 1994, A&A, 287, 959
- Enomoto et al. (2002) Enomoto, R., et al. 2002, Nature, 416, 823
- Finley & Ögelman (1994) Finley, J. P., & Ögelman, H. 1994, ApJ, 434, L25
- Fleysher et al. (2004) Fleysher, R. et al. 2004, International Symposium on High-Energy Gamma-Ray Astronomy, ed. F.A. Aharonian, H.J. Völk, D. Horns, AIP Conference Proceedings, 745, 265 (available at http://arxiv.org/abs/astro-ph/0502303).
- Funk et al. (2004) Funk, S., et al. 2004, APh, 22, 285
- Gaensler & Johnston (1995) Gaensler, B. M., & Johnston, S. 1995, MNRAS, 275, L73
- Gaensler et al. (2003) Gaensler, B. M., Schulz, N. S., Kaspi, V. M., Pivovaroff, M. J., & Becker, W. E. 2003, ApJ, 588, 441
- Ginzburg & Syrovatskii (1964) Ginzburg, V. L., & Syrovatskii, S. I. 1964, ”The Origin of Cosmic Rays”, Macmillan
- Green et al. (1999) Green, A. J., Cram, L. E., Large, M. I., Ye, T. 1999, ApJS, 122, 207
- Green (2004) Green, D. A. 2004, BASI, 32, 335
- Hall et al. (2003) Hall, T. A., et al. 2003, in Proc. 28th ICRC, Tsukuba, ed. T. Kajita et al., (Universal Academy Press, Tokyo, 2003), 2497
- Hartman et al. (1999) Hartman, R. C., et al., 1999, ApJS, 123, 79
- Haschick & Ho (1983) Haschick, A. D., Ho, P. T. P. 1983, ApJ, 267, 638
- Helfand, Becker & White (2005) Helfand, D. J., Becker, R. H, & White, R. L. 2005, submitted to ApJL, (available at http://xxx.lanl.gov/abs/astro-ph/0505392)
- Hinton (2004) Hinton, J. A. 2004, NewAR, 48, 331
- Hirotani (2001) Hirotani, K. 2001, ApJ, 549, 495
- Jones et al. (2001) Jones, F. C, Lukasiak, A., Ptuskin, V., & Webber, W. 2001, ApJ, 547, 264.
- Kassim & Weiler (1990) Kassim, N. E., & Weiler, K. W. 1990, Nature, 343, 146
- Kassim, Baum & Weiler (1991) Kassim, N. E., Weiler, K. W., & Baum, S. A. 1991, ApJ 374, 212
- Kassim (1992) Kassim, N. E. 1992, AJ, 103, 943
- Kastner et al. (2003) Kastner, J. H., Balick, B., Blackman, E. G., Frank, A., Soker, N., Vrtílek, S. D., & Li, J. 2003, ApJ, 591, L37
- Koyama et al. (1995) Koyama, K., Petre, R., Gotthelf, E. V., Hwang, U., Matsuura, M., Ozaki, M., & Holt, S. S. 1995, Nature, 378, 255
- Li & Ma (1983) Li, T.-P., & Ma, Y.-Q. 1983, ApJ, 272, 317
- Malizia et al. (2004) Malizia, A., et al. 2004, “From BeppoSAX to INTEGRAL: PDS observations of hard X-ray sources detected in the IBIS survey”, (available at http://xxx.lanl.gov/abs/astro-ph/0404596).
- Malkov & Drury (2001) Malkov, M. A., & Drury, L. O’C. 2001, Rep. Prog. Phys, 64, 429
- Manchester et al. (2005) Manchester, R. N., Hobbs, G. B., Teoh, A., & Hobbs, M. 2005, AJ, 129, 1993
- Montmerle (1979) Montmerle, T. 1979, ApJ, 231, 95
- de Naurois et al. (2002) de Naurois, M., et al. 2002, ApJ, 566, 343
- Nolan et al. (2003) Nolan, P. L., Tompkins, W. F., Grenier, I. A., & Michelson, P. F. 2003, ApJ, 597, 615
- Ojeda-May et al. (2002) Ojeda-May, P., Kurtz, S. E., Rodríguez, L. F., Arthur, S. J., Velázquez, P. 2002, RMxAA, 38, 111
- Paladini et al. (2003) Paladini, R., Burigana, C., Davies, R. D., Maino, D., Bersanelli, M., Cappellini, B., Platania, P., & Smoot, G. 2003, A&A, 397, 213
- Parizot et al. (2004) Parizot, E., Marcowith, A., van der Swaluw, E., Bykov, A. M., & Tatischeff, V. 2004, A&A, 424, 747
- Patel et al. (2004) Patel, S. K., Kouveliotou, C., Tennant, A, et al. 2004, ApJ, 602, L45
- Reimer (2000) O. Reimer, in Proc. of The Nature of Unidentified Galactic High-Energy Gamma-Ray Sources, Tonantzintla 2000, Astrophysics and Space Science Library 267, 17
- Reimer & Bertsch (2001) Reimer, O., & Bertsch, D. L., in Proc. of 27th Int. Cosmic Ray Conf., Hamburg, 2001, 2546
- Revnivtsev et al. (2003) Revnitsev, M., Tuerler, M., Del Santo, M., Westergaard, N. J., Gehrels, N., & Winkler, C. 2003, IAUC 8097
- Reynoso & Mangum (2000) Reynoso, E. M., & Mangum, J. G. 2000, ApJ, 545, 874
- Rodriguez et al. (2003) Rodriguez, J., Tomsick, J. A., Foschini, L., Walter, R., Goldwurm, A., Corbel, S., & Kaaret, P. 2003, A&A, 407, L41
- Rowell (2003) Rowell, G. P., 2003, A&A, 410, 389
- Sugizaki et al. (2001) Sugizaki, M., Mitsuda, K., Kaneda, H., Matsuzaki, K., Yamauchi, S., & Koyama, K. 2001, ApJS, 134, 77
- Smith et al. (2005) Smith, A. J., et al., 2005, International Symposium on High-Energy Gamma-Ray Astronomy, eds F.A. Aharonian, H.J. Völk, D. Horns, AIP Conference Proceedings, 745, 657
- Thompson, Bertsch & O’Neal (2005) Thompson, D. J., Bertsch, D. L., & O’Neal, R. H. Jr. 2005, ApJS, 157, 324
- Tomsick et al. (2003) Tomsick, J. A., Lingenfelter, R., Walter, R., et al. 2003, IAUC, 8076
- Torii et al. (1998) Torii, K. et al. 1998, ApJ, 494, L207
- Ubertini et al. (2005) Ubertini, P. et al. 2005, submitted to ApJL, (available at http://xxx.lanl.gov/abs/astro-ph/0505191)
- Vincent et al. (2003) Vincent, P., et al. 2003, in Proceedings of the 28th International Cosmic Ray Conference, T. Kajita et al., Eds. (Universal Academy Press, Tokyo, 2003), 2887
- Vink (2004) Vink, J. 2004, ApJ, 604, 693
- Völk, & Forman (1982) Völk, H. J., & Forman, M. 1982, ApJ, 253, 188
- Völk, Berezhko & Ksenofontov (2003) Völk, H. J., Berezhko, E. G., & Ksenofontov, L. T. 2003, A&A, 409, 563
- Weisskopf et al. (2000) Weisskopf, M. C., et al. 2000, ApJ, 536, L81
- Weekes et al. (1989) Weekes, T. C., et al. 1989, ApJ, 342, 379
- Weekes (2000) Weekes, T. C. 2000, International Symposium on High-Energy Gamma-Ray Astronomy, ed. F.A. Aharonian, H.J. Völk, AIP Conference Proceedings, 558, 15
- White (1985) White, R. L. 1985, ApJ, 289, 698
- White, Becker & Helfand (2005) White, R. L., Becker, R. H., & Helfand, D. J. 2005, AJ, accepted, (astro-ph/0501607)
- Whiteoak & Green (1996) Whiteoak, J. B. Z., Green, A. J. 1996, A&AS, 118, 329