Globular clusters, satellite galaxies and stellar haloes from early dark matter peaks
Abstract
The Milky Way contains several distinct old stellar components that provide a fossil record of its formation. We can understand their spatial distribution and kinematics in a hierarchical formation scenario by associating the proto-galactic fragments envisaged by Searle and Zinn (1978) with the rare peaks able to cool gas in the cold dark matter density field collapsing at redshift . We use hierarchical structure formation simulations to explore the kinematics and spatial distribution of these early star-forming structures in galaxy haloes today. Most of the proto-galaxies rapidly merge, their stellar contents and dark matter becoming smoothly distributed and forming the inner Galactic halo. The metal-poor globular clusters and old halo stars become tracers of this early evolutionary phase, centrally biased and naturally reproducing the observed steep fall off with radius. The most outlying peaks fall in late and survive to the present day as satellite galaxies. The observed radial velocity dispersion profile and the local radial velocity anisotropy of Milky Way halo stars are successfully reproduced in this model. If this epoch of structure formation coincides with a suppression of further cooling into lower sigma peaks then we can reproduce the rarity, kinematics and spatial distribution of satellite galaxies as suggested by Bullock et al. (2000). Reionisation at provides a natural solution to the missing satellites problem. Measuring the distribution of globular clusters and halo light on scales from galaxies to clusters could be used to constrain global versus local reionisation models. If reionisation occurs contemporary, our model predicts a constant frequency of blue globulars relative to the host halo mass, except for dwarf galaxies where the average relative frequencies become smaller.
keywords:
methods: N-body simulations – methods: numerical – dark matter — galaxies: haloes — galaxies: clusters: general, globular clusters1 Introduction
The Milky Way is a typical bright spiral galaxy. Its disk of stars and gas is surrounded by an extended halo of old stars, globular star clusters and a few dark matter dominated old satellite galaxies. For the past 30 years two competing scenarios for the origin of galaxies and their stellar components have driven much observational and theoretical research. Eggen, Lynden-Bell and Sandage (1962) proposed a monolithic collapse of the Galaxy whilst Searle and Zinn (1978) advocated accretion of numerous proto-galactic fragments.
Enormous progress has been made in understanding the structure and origin of the Milky Way, as well as defining a standard cosmological model for structure formation that provides us with a framework within which to understand our origins Peebles (1982); Freeman and Bland-Hawthorn (2002). Hierarchical growth of galaxies is a key expectation within a Universe whose mass is dominated by a dark and nearly cold particle (CDM), yet evidence for an evolving hierarchy of merging events can be hard to find, since much of this activity took place over 10 billion years ago. The origin of the luminous Galaxy depends on the complex assembly of its dark halo that extends beyond kpc, and on how stars form within the first dark matter structures massive enough to cool gas to high densities White and Rees (1978).
The Galactic halo contains about 100 old metal poor globular clusters (i.e. Forbes et al. 2000) each containing up to stars. Their spatial distribution falls off as at large radii and half the globulars lie within 5 kpc from the centre of the Galaxy Strader et al. (2004). There is no evidence for dark matter within the globular clusters today Peebles (1984); Moore (1996). The old stellar halo population has a similar spatial distribution and a total luminosity of Majewski et al. (2000); Ivezic et al. (2000). The stellar populations, ages and metallicities of these components are very similar Freeman and Bland-Hawthorn (2002).
Also orbiting the Galaxy are several tiny spheroidal satellite galaxies, each containing an old population of stars, some showing evidence for more recent star-formation indicating that they can hold on to gas for a Hubble time Gallagher and Wyse (1994); Grebel et al. (2003). Half of the dwarf satellites lie within 85 kpc, have luminosities in the range and are surrounded by dark haloes at least 50-200 times as massive as their baryonic components Mateo (1998). Cold dark matter models have had a notoriously hard time at reconciling the observed low number of satellites with the predicted steep mass function of dark haloes Kauffmann et al. (1993); Moore et al. (1999); Klypin et al. (1999).
We wish to explore the hypothesis that cold dark matter dominates structure formation, the haloes of galaxies and clusters are assembled via the hierarchical merging and accretion of smaller progenitors (e.g. Lacey and Cole 1993). This process violently causes structures to come to a new equilibrium by redistributing energy among the collision-less mass components. Early stars formed in these progenitors behave as a collisionless system just like the dark matter particles in their host haloes, and they undergo the same dynamical processes during subsequent mergers and the buildup of larger systems like massive galaxies or clusters.
In a recent study, Diemand et al. (2005) used cosmological N-body simulations to explore the distribution and kinematics in present-day CDM haloes of dark matter particles that originally belonged to rare peaks in the matter density field. These properties are particularly relevant for the baryonic tracers of early CDM structures, for example the old stellar halo which may have originated from the early disruption of numerous dwarf proto-galaxies Bullock et al. (2000), the old halo globular clusters and also giant ellipticals Gao et al. (2004).
Since rare, early haloes are strongly biased towards overdense regions (e.g. Sheth and Tormen 1999), i.e. towards the centers of larger scale fluctuations that have not collapsed yet, we might expect that the contribution at from the earliest branches of the merger tree is much more centrally concentrated than the overall halo. Indeed, a “non-linear” peaks biasing has been discussed by previous authors Moore et al. (1998); White and Springel (2000); Moore (2001). Diemand et al. (2005) showed that the present-day distribution and kinematics of material depends primarily on the rareness of the peaks of the primordial density fluctuation field that the selected matter originally belonged to, i.e. when selecting rare density peaks above [where is the linear theory rms density fluctuations smoothed with a top-hat filter of mass at redshift ], their properties today depend on and not on the specific values of selection redshift z and minimal mass M.
In the following section of this paper we discuss a model for the combined evolution of the dark and old stellar components of the Galaxy within the framework of the CDM hierarchical model Peebles (1982). Many previous studies have motivated and touched upon aspects of this work but a single formation scenario for the above components has not been explored in detail and compared with data Kauffmann et al. (1993); Bullock et al. (2000); Côté et al. (2000); Moore (2001); Freeman and Bland-Hawthorn (2002); Benson et al. (2002); Côté et al. (2002); Somerville et al. (2003); Kravtsov et al. (2004); Kravtsov and Gnedin (2005). We assume proto-galaxies and globular clusters form within the first rare peaks above a critical mass threshold that can allow gas to cool and form stars in significant numbers (typically at ). We assume that shortly after the formation of these first systems, the universe reionises, perhaps by these first proto-galaxies, suppressing further formation of cosmic structure until later epochs. We use the N-body simulations to trace the rare peaks to . Most of these proto-galaxies and their globular clusters merge together to create the central galactic region. In Section 3 we will compare the spatial distribution and orbital kinematics of these tracer particles with the Galactic halo light and old metal poor globular clusters. We will see that a small number of these first stellar systems survive as dark matter dominated galaxies. We will compare their properties with the old satellites of the Galaxy in Section 4.
2 The first stellar systems
We propose that ‘ordinary’ Population II stars and globular clusters first appeared in significant numbers at redshift , as the gas within protogalactic haloes with virial temperatures above K (corresponding to masses comparable to those of present-day dwarf spheroidals) cooled rapidly due to atomic processes and fragmented. It is this ‘second generation’ of subgalactic stellar systems, aided perhaps by an earlier generation of metal-free (Population III) stars and by their remnant black holes, which generated enough ultraviolet radiation to reheat and reionize most of the hydrogen in the Universe by a redshift , thus preventing further accretion of gas into the shallow potential wells that collapsed later. The impact of a high redshift UV background on structure formation has been invoked by several authors Haardt and Madau (1996); Bullock et al. (2000); Moore (2001); Barkana and Loeb (2001); Tully et al. (2002); Benson et al. (2002) to explain the flattening of the faint end of the luminosity function and the missing satellites problem within our Local Group. Here we use high resolution numerical simulations that follow the full non-linear hierarchical growth of galaxy mass haloes to explore the consequences and predictions of this scenario.
Dark matter structures will collapse at different times, depending on their mass, but also on the underlying larger scale fluctuations. At any epoch, the distribution of masses of collapsed haloes is a steep power law towards low masses with . To make quantitative predictions we calculate the non-linear evolution of the matter distribution within a large region of a CDM Universe. The entire well resolved region is about 10 comoving megaparsecs across and contains 61 million dark matter particles of mass and force resolution of 0.27 kpc. This region is embedded within a larger 90 Mpc cube that is simulated at lower resolution such that the large scale tidal field is represented. Figure 1 shows the high-redshift and present-day mass distribution of a single galaxy mass halo taken from this large volume. The rare peaks collapsing at high redshift that have had sufficient time to cool gas and form stars, can be identified, followed and traced to the present day. Because small fluctuations are embedded within a globally larger perturbation, the small rarer peaks that collapse first are closer to the centre of the final potential and they preserve their locality in the present day galaxy. The strong correlation between initial and final position results in a system where the oldest and rarest peaks are spatially more concentrated than less rare peaks. The present day spatial clustering of the material that was in collapsed structures at a higher redshift only depends on the rarity of these peaks Diemand et al. (2005).
Our simulation contains several well resolved galactic mass haloes which we use to trace the evolution of progenitor haloes that collapse at different epochs. The first metal free Population III stars form within minihaloes already collapsed by , where gas can cool via roto-vibrational levels of H2 and contract. Their evolution is rapid and local metal enrichment occurs from stellar evolution. Metal-poor Population II stars form in large numbers in haloes above (virial temperature K), where gas can cool efficiently and fragment via excitation of hydrogen Ly. At , these correspond to peaks of the initial Gaussian overdensity field: most of this material ends up within the inner few kpc of the Galaxy. Within the Mpc turn-around region, a few hundred such protogalaxies are assembling their stellar systems Kravtsov and Gnedin (2005). Typically 95% of these first structures merge together within a timescale of a few Gyrs, creating the inner Galactic dark halo and its associated old stellar population.
With an efficiency of turning baryons into stars and globular clusters of the order we successfully reproduce the total luminosity of the old halo population and the old dwarf spheroidal satellites. The fraction of baryons in dark matter haloes above the atomic cooling mass at redshift 12 exceeds . A normal stellar population with a Salpeter-type initial mass function emits about 4,000 hydrogen-ionizing photons per stellar baryon. A star formation efficiency of 10% therefore implies the emission of a few Lyman-continuum photons per baryon in the Universe. This may be enough to photoionize and drive to a higher adiabat vast portions of the intergalactic medium, thereby quenching gas accretion and star formation in nearby low-mass haloes.
3 Connection to globular clusters and halo stars
The globular clusters that were once within the merging proto-galaxies are so dense that they survive intact and will orbit freely within the Galaxy. The surviving proto-galaxies may be the precursors of the old satellite galaxies, some of which host old globular clusters such as Fornax, whose morphology and stellar populations are determined by ongoing gravitational and hydrodynamical interactions with the Milky Way (e.g. Mayer et al. 2005).
Recent papers have attempted to address the origin of the spatial distribution of globular clusters (e.g. Parmentier and Grebel 2005, Parmentier et al. 2005). Most compelling for this model and one of the key results in this paper, is that we naturally reproduce the spatial clustering of each of these old components of the galaxy. The radial distribution of material that formed from peaks at now falls off as within the Galactic halo - just as the observed old halo stars and metal poor globular clusters (cf. Figure 2). Cosmological hydrodynamical simulations are also begining to attain the resolution to resolve the formation of the old stellar haloes of galaxies (Abadi et al. 2005). Because of the steep fall off with radius, we note that we do not expect to find any isolated globular clusters beyond the virial radius of a galaxy 111The probability to have one isolated old globular cluster outside of the virial radius of a Milky Way like galaxy is only 3% in our model..
These first collapsing structures infall radially along filaments and end up significantly more flattened than the mean mass distribution. They also have colder velocity distributions and their orbits are isotropic in the inner halo and increasingly radially anisotropic in the outer part. Material from these rare peaks has at our position in the Milky Way, in remarkable agreement with the recently measured anisotropy and velocity dispersion of halo stars Chiba and Beers (2000); Battaglia et al. (2005); Thom et al. (2005). Diemand et al. (2005) show that the radial distribution of rarer peaks is even more highly biased - thus the oldest population III stars and their remnant black holes are found mainly within the inner kpc of the Galaxy, falling off with radius steeper than .
The observational evidence for tidal stellar streams from globular clusters suggests that they are not embedded within extended dark matter structures today Moore (1996). This does not preclude the possibility that the globular clusters formed deep within the central region of dark haloes which have since merged together. (Massive substructure within the inner of galactic mass haloes is tidally disrupted i.e. Gihgna et al. 1998.) This is what we expect within our model which would leave the observed globulars freely orbiting without any trace of the original dark matter component. However, it is possible that the most distance halo globulars may still reside within their original dark matter halo. If the globular cluster is located at the center of the CDM cusp, then observations of their stellar kinematics may reveal rising dispersion profiles. If the globular cluster is orbiting within a CDM mini-halo then we would expect to see symmetric tidal streams orbiting within the potential of the CDM substructure halo rather than being stripped by the Galaxy.
4 Connection to satellite galaxies and the missing satellites problem
The remaining % of the proto-galaxies form sufficiently far away from the mayhem that they fall into the assembling galaxy late (, about one Gyr after the formation of the inner Galaxy at ). This leaves time to enhance their element ratios from Type II supernovae Wyse and Gilmore (1988, 1995); Pritzl et al. (2005). Recent studies including chemical modeling of this process support this scenario (e.g. Robertson et al. 2005, Font et al. 2005).
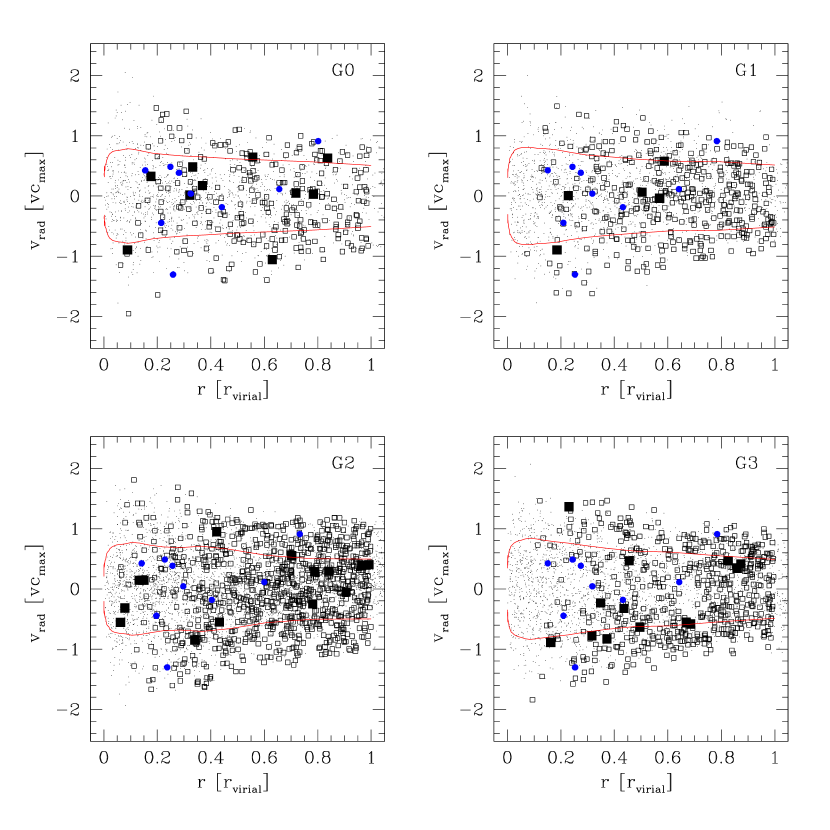
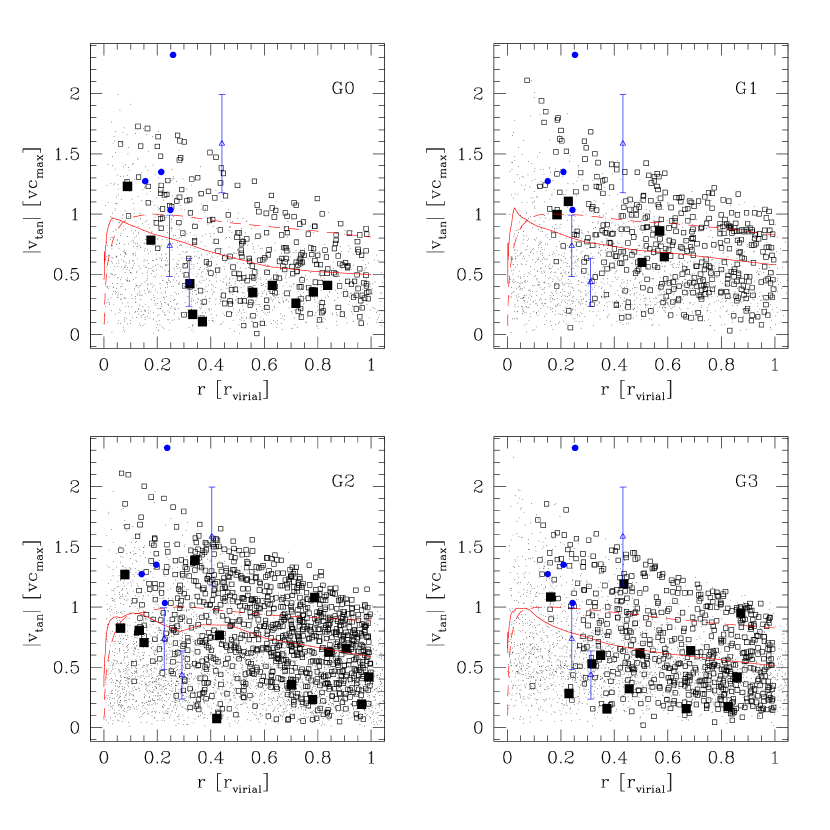
The proto-galaxies highlighted with boxes in Figure 1 are those few systems that survive until the present epoch - they all form on the outskirts of the collapsing region, ending up tracing the total mass distribution as is also observed within the Milky Way’s and M31’s satellite systems. Each of our four high resolution galaxies contains about ten of these surviving proto-galaxies which have a radial distribution that is slightly shallower than that of the total mass distribution but more concentrated than the distribution of all surviving (or mass selected) subhalos (Figures 2 and 4). This is consistent with the spatial distribution of surviving satellites in the Milky Way and in other nearby galaxies in the 2dF van den Bosch et al. (2005); Sales & Lambas (2005) and DEEP2 samples (Coil et al., 2005) and with galaxy groups like NGC5044 (Faltenbacher & Mathews, 2005).
Figure 3 shows the distribution of circular velocities of the Local Group satellites compared with these rare proto-galaxies that survive until the present day. The Local Group circular velocity data are the new data from Maccio’ et al. (2005b) where velocity dispersions have been converted to peak circular velocities using the results of Kazantzidis et al. (2004). The total number of dark matter substructures is over an order of magnitude larger than the observations. Reionisation and photo-evaporation must play a crucial role in suppressing star formation in less rare peaks, thus keeping most of the low mass haloes that collapse later devoid of baryons. The surviving population of rare peaks had slightly higher circular velocities just before accretion (at , dashed line in Figure 3 - see Kravtsov et al. 2004), tidal stripping inside the Galaxy halo then reduced their masses and circular velocities and they match the observations at . Dissipation and tidally induced bar formation could enable satellites to survive even closer to the Galactic centre (Maccio’ et al. 2005a).
Likewise to the radial distribution, the kinematics of the surviving visible satellite galaxies resembles closely the one of the dark matter while the same properties for all the surviving subhalos differ (Figures 5 and 6). Within the four high resolution CDM galaxy haloes our 42 satellite galaxies have average tangential and radial velocity dispersions of 0.70 and 0.56 respectively, i.e. (the errors are one sigma Poission uncertainties). These values are consistent with those of the dark matter particles: , and ; the hint of slightly larger dispersions of the satellites are consistent with their somewhat larger radial extent. In the inner part our model satellite galaxies are hotter than the dark matter background, especially in the tangential component: Within 0.3 we find and . This is consistent with the observed radial velocities of Milky Way satellites. For the inner satellites also the tangential motions are know (with large uncertainties however) (e.g. Mateo 1998; Wilkinson & Evans 1999) and just as in our simple model they are larger than the typical tangential velocities of dark matter particles in the inner halo.
The total (mostly dark) surviving subhalo population is more extended and hotter than the dark matter while the distribution of orbits (i.e. ) is similar (Diemand et al., 2004). For the 2237 subhalos within the four galaxy haloes find , and , i.e. there is a similar velocity bias relative to the dark matter in both the radial and tangential components and therefore a similar anisotropy. In the inner halo the differences between dark matter particles and subhaloes are most obvious: Within 0.3 we find and . Subhalos tend to avoid the inner halo and those who lie near the center at move faster (both in the tangential and radial directions) than the dark matter particles, i.e. these inner subhalos have large orbital energies and spend most of their time further away from the center (Figures 4, 5 and 6, see also Diemand et al. 2004).
| kpc | km/s | kpc | kpc | |||
|---|---|---|---|---|---|---|
| 260 | 160 | 52.2 | 1.83 | 317 | ||
| 268 | 162 | 51.3 | 1.95 | 323 | ||
| 337 | 190 | 94.5 | 2.39 | 346 | ||
| 299 | 180 | 45.1 | 1.96 | 324 |
5 Summary
We have a implemented a simple prescription for proto-galaxy and globular cluster formation on to a dissipationless CDM N-body simulation. This allows us to trace the kinematics and spatial distribution of these first stellar systems to the final virialised dark matter halo. We can reproduce the basic properties of the Galactic metal poor globular cluster system, old satellite galaxies and Galactic halo light.
The spatial distribution of material within a virialised dark matter structure depends on the rarity of the peak within which the material collapses. This implies a degeneracy between collapse redshift and peak height. For example, 3 sigma peaks collapsing at redshift 18 and 10 will have the same final spatial distribution within the Galaxy. However this degeneracy can be broken since the mass and number of peaks are very different at each redshift. In this example at redshift 18 a galaxy mass perturbation has 700 collapsed 3 sigma halos of mass , compared to 8 peaks of mass
The best match to the spatial distribution of globular clusters and stars comes from material that formed within peaks above 2.5 . We can then constrain the minimum mass/redshift pair by requiring to match the observed number of satellite galaxies in the Local Group (Figure 7). If protogalaxies form in early, low mass 2.5 peaks the resulting number of luminous satellites is larger as when they form later in heavier 2.5 peaks. We find that efficient star formation in halos above about 10 up to a redshift matches these constraints. The scatter in redshift is due to the different best fit redshifts found in our individual galaxy haloes. After this epoch star formation should be suppressed in small halos otherwise a too large number of satellites and a too massive and too extended spheroid of population II stars is produced. The minimum halo mass to form a protogalaxy inferred from these two constraints corresponds to a minimal halo virial temperature of (Figure 7), i.e. just the temperature needed for efficient atomic cooling.
This model is general for galaxy formation, but individual formation histories may reveal more complexity. Soon after reionisation, infalling gas into the already massive galactic mass halo leads to the formation of the disk and the metal enriched population of globular clusters. The first and second generation of stars forming in proto-clusters of galaxies will have a similar formation path, but occurring on a more rapid timescale.
We find that the mass fraction in peaks of a given is independent of the final halo mass, except that it rapidly goes to zero as the host halos become too small to have sufficiently high progenitors (see Figure 8 and Table 4 in Diemand et al. (2005)). Therefore, if reionisation is globally coeval throughout the Universe the abundance of globulars normalised to the halo mass will be roughly constant in galaxies, groups and clusters. Furthermore, the radial distribution of globular clusters relative to the host halo scale radius will the same (see Diemand et al. 2005). If rarer peaks reionise galaxy clusters earlier Tully et al. (2002) then their final distribution of blue globulars will fall off more steeply (relative to the scale radius of the host halo) and they will be less abundant per virial mass Diemand et al. (2005). Observations suggest that the numbers of old globular clusters are correlated with the luminosity of the host galaxy McLaughlin (1999); Harris (1991, 2005); Rhode et al. (2005). Wide field surveys of the spatial distribution of globulars in groups and clusters may reveal the details of how and when reionisation occurred Forbes et al. (1997); Puzia et al. (2004).
Acknowledgments
We thank Jean Brodie, Andi Burkert, Duncan Forbes and George Lake for useful discussions and Andrea Maccio’ for providing the corrected Local Group data for Figure 3 prior to publication. All computations were performed on the zBox supercomputer at the University of Zürich. Support for this work was provided by NASA grants NAG5-11513 and NNG04GK85G, by NSF grant AST-0205738 (P.M.), and by the Swiss National Science Foundation.
References
- Abadi et al. (2005) Abadi, M.G., Navarro, J.F. & Steinmetz, M. 2005, MNRAS submitted, arXiv:astro-ph/0506659
- Barkana and Loeb (2001) Barkana, R., & Loeb, A., 2001, Physics Reports, 349, 125
- Battaglia et al. (2005) Battaglia, G., et al. 2005, ArXiv Astrophysics e-prints, arXiv:astro-ph/0506102
- Benson et al. (2002) Benson, A. J., Frenk, C. S., Lacey, C. G., Baugh, C. M., & Cole, S., 2002, MNRAS, 333, 177
- Benson et al. (2002) Benson, A. J., Lacey, C. G., Baugh, C. M., Cole, S., & Frenk, C. S., 2002, MNRAS, 333, 156
- Bland-Hawthorn and Freeman (2000) Bland-Hawthorn, J., & Freeman, K. 2000, Science 287, 79
- Bullock et al. (2000) Bullock, J. S., Kravtsov, A. V., & Weinberg, D. H., 2000, ApJ, 539, 517
- Chiba and Beers (2000) Chiba, M., Beers, T. C., 2000, AJ, 119, 2843
- Coil et al. (2005) Coil, A. L., et al. 2005, ArXiv Astrophysics e-prints, arXiv:astro-ph/0507647
- Cole & Lacey (1996) Cole S., Lacey C., 1996, MNRAS, 281, 716
- Côté et al. (2000) Côté, P., Marzke, R. O., West, M. J., & Minniti, D., 2000, ApJ, 533, 869
- Côté et al. (2002) Côté, P., West, M. J., & Marzke, R. O., 2002, ApJ, 567, 853
- Diemand et al. (2005) Diemand, J., Madau, P. & Moore, B., 2005, MNRAS, in press
- Diemand et al. (2004) Diemand, J., Moore, B., & Stadel, J. 2004, MNRAS, 352, 535
- Dubinski & Carlberg (1991) Dubinski J., Carlberg R. G., 1991, ApJ, 378, 496
- Eggen et al. (1962) Eggen, O. J., Lynden-Bell, D., & Sandage, A. R., 1962, ApJ, 136, 748
- Faltenbacher & Mathews (2005) Faltenbacher A., Mathews W. G., 2005, MNRAS, 362, 498
- Font et al. (2005) Font A.S., Johnston K.V., Bullock J.S. & Robertson B., 2005, ApJ, submitted, astroph/0507114
- Forbes et al. (1997) Forbes, D. A., Brodie, J. P., & Grillmair, C. J., 1997, AJ, 113, 1652
- Forbes et al. (2000) Forbes, D.A., Masters, K.L, Minniti, D. & Barmby, P., 2000, A&A, 358 471
- Freeman and Bland-Hawthorn (2002) Freeman, K., & Bland-Hawthorn, J., 2002, ARAA 40, 487
- Gallagher and Wyse (1994) Gallagher, J. S., & Wyse, R. F. G., PASP, 1994, 106, 1225
- Gao et al. (2004) Gao L., Loeb A., Peebles P. J. E, White S. D. M., Jenkins A., 2004, ApJ, 614, 17
- Ghigna et al. (1998) Ghigna S., Moore B., Governato F., Lake G., Quinn T., Stadel J., 1998, MNRAS, 300, 146
- Grebel et al. (2003) Grebel, E. K., Gallagher, J. S., & Harbeck, D., 2003, AJ, 125, 1926
- Haardt and Madau (1996) Haardt, F., & Madau, P., 1996, ApJ, 461, 20
- Harris (1991) Harris, W.E., 1991, ARAA, 29, 543
- Harris (2005) Harris W.E., Whitmore B.C., Karakla D., Okon W., Baum W.A., Hanes D.A. & Kavelaars J.J 2005, ApJ, in press, astroph/0508195
- Ivezic et al. (2000) Ivezić, Ž., and 41 colleagues, 2000, AJ, 120, 963
- Kauffmann et al. (1993) Kauffmann, G., White, S.D.M., & Guiderdoni, B., 1993, MNRAS, 264, 201
- Kazantzidis etal (2005) Kazantzidis S., Mayer L., Mastropietro C., Stadel J. & Moore B. 2004, ApJ, 608, 663
- Klypin et al. (1999) Klypin, A., Kravtsov, A. V., Valenzuela, O., & Prada, F., 1999, ApJ, 522, 82
- Kravtsov et al. (2004) Kravtsov, A. V., Gnedin, O. Y., & Klypin, A. A., 2004, ApJ, 609, 482
- Kravtsov and Gnedin (2005) Kravtsov, A. V., & Gnedin, O. Y., 2005, ApJ, in press
- Lacey and Cole (1993) Lacey C., Cole S., 1993, MNRAS, 262, 627
- Maccio’ et al. (2005) Maccio’ A.V., Moore B., Stadel J. & Diemand J., 2005, MNRAS, in press
- Maccio’ et al. (2005) Maccio’ A.V., et al. in preparation
- Mackey and van den Bergh (2005) Mackey A.D. & van den Bergh S., 2005, MNRAS, 360, 631
- Majewski et al. (2000) Majewski, S. R., Ostheimer, J. C., Patterson, R. J., Kunkel, W. E., Johnston, K. V., & Geisler, D., 2000, AJ, 119, 760
- Mateo (1998) Mateo, M. L., 1998, ARAA, 36, 435
- Mayer et al. (2005) Mayer L., Mastropietro C., Wadsley J., Stadel J. & Moore B., 2005, MNRAS submitted, astroph/0504277
- McLaughlin (1999) McLaughlin, D.E. 1999, AJ, 117, 2398
- Moore (1996) Moore, B., 1996, ApJ, 461, L13
- Moore et al. (1998) Moore B., Governato F., Quinn T., Stadel J., Lake G., 1998, ApJ, 499, L5
- Moore et al. (1999) Moore, B., Ghigna, S., Governato, F., Lake, G., Quinn, T., Stadel, J., & Tozzi, P., 1999, ApJ, 524, L19
- Moore (2001) Moore, B. The Dark Matter Crisis (Plenary Talk)., 2000, AIP Conf. Proc. 586, 586, 73
- Parmentier and Grebel (2005) Parmentier, G. & Grebel E.K., 2005, MNRAS, 359, 615
- Parmentier et al. (2005) Parmentier, G. & Gilmore G., 2005, MNRAS, in press
- Peebles (1984) Peebles, P. J. E., 1984, ApJ, 277, 470
- Peebles (1982) Peebles, P.J.E., 1982, ApJ, 263, L1
- Piatek et al. (2002) Piatek, S., et al. 2002, AJ, 124, 3198
- Piatek et al. (2003) Piatek, S., Pryor, C., Olszewski, E. W., Harris, H. C., Mateo, M., Minniti, D., & Tinney, C. G. 2003, AJ, 126, 2346
- Piatek et al. (2005) Piatek, S., Pryor, C., Bristow, P., Olszewski, E. W., Harris, H. C., Mateo, M., Minniti, D., & Tinney, C. G. 2005, AJ, 130, 95
- Pritzl et al. (2005) Pritzl B.J., Venn K.A. & Irwin M.J. 2005, AJ, in press
- Puzia et al. (2004) Puzia T.H., Kissler-Patig M., Thomas D., Maraston C., Saglia R.P., Bender R., Richtler T., Goufrooij P. & Hempel M., 2004, AA, 415, 123
- Rhode et al. (2005) Rhode, K.L., Zepf S.E. & Santos M.R., 2005, ApJLett, in press - astroph/0507551
- Robertson et al. (2005) Robertson, B., Bullock, J.S., Font, A.S., Johnston, K.V., & Hernquist, L. 2005, ApJ, submitted, astroph/0501398
- Sales & Lambas (2005) Sales, L., & Lambas, D. G. 2005, MNRAS, 356, 1045
- Searle and Zinn (1978) Searle, L., & Zinn, R. 1978, ApJ, 225, 357
- Sheth and Tormen (1999) Sheth, R. K., Tormen, G. 1999, MNRAS, 308, 119
- Somerville et al. (2003) Somerville, R.S., Bullock, J.S. and Livio, M. 2003, ApJ, 593, 616
- Strader et al. (2004) Strader, J., Brodie, J. P., & Forbes, D. A., 2004, AJ, 127, 3431
- Strader el al. (2005) Strader J., Brodie, J.P., Cenarro A.J., Beasley M.A. & Forbes D.A., 2005, AJ, in press.
- Thom et al. (2005) Thom, C., Flynn, C., Bessel, M.S., Hanninen, J., Beers, T.C., Christlieb, N., James, D., Holmberg, J. & Gibson, B.K., 2005, MNRAS in press, astro-ph/0504058
- Tully et al. (2002) Tully, R. B., Somerville, R. S., Trentham, N., & Verheijen, M. A. W., 2002, ApJ 569, 573
- van den Bosch et al. (2005) van den Bosch, F. C., Yang, X., Mo, H. J., & Norberg, P. 2005, MNRAS, 356, 1233
- Wilkinson & Evans (1999) Wilkinson, M. I., & Evans, N. W. 1999, MNRAS, 310, 645
- White and Rees (1978) White S. D. M. & Rees, M.J. 1978, MNRAS, 183, 341
- White and Springel (2000) White S. D. M., Springel V., 2000, The First Stars. Proceedings of the MPA/ESO Workshop held at Garching, Germany, 4-6 August 1999. Achim Weiss, Tom G. Abel, Vanessa Hill (eds.). Springer, p.327, 327
- Wyse and Gilmore (1995) Wyse, R. F. G., & Gilmore, G., 1995, AJ, 110, 2771
- Wyse and Gilmore (1988) Wyse, R. F. G., & Gilmore, G., 1988, AJ, 95, 1404