Delayed Photoionization Feedback in a Super Star Cluster in SBS0335-052E
Abstract
SBS0335-052 is a well studied Blue Compact Dwarf galaxy with one of the lowest metallicities of any known galaxy. It also contains 6 previously identified Super Star Clusters. We combine archival HST NICMOS images in the Pa line and the continuum of the eastern component, SBS0335-052E, with other space and ground based data to perform a multi-wavelength analysis of the super star clusters. We concentrate on the southern most clusters, designated S1 and S2, which appear to be the youngest clusters and are the strongest emitters of Pa, radio, and x-ray flux. Our analysis leads to a possible model for S1 and perhaps S2 as a cluster of very young, massive stars with strong stellar winds. The wind density can be high enough to absorb the majority of ionizing photons within less than 1000 AU of the stars, creating very compact HII regions that emit optically thick radiation at radio wavelengths. These winds would then effectively quench the photoionizing flux very close to the stars. This can delay the onset of negative feedback by photoionization and photodissociation on star formation in the clusters. This is significant since SBS0335-052E resembles the conditions that were probably common for high redshift star formation in galaxies near the epoch of reionization.
1 Introduction
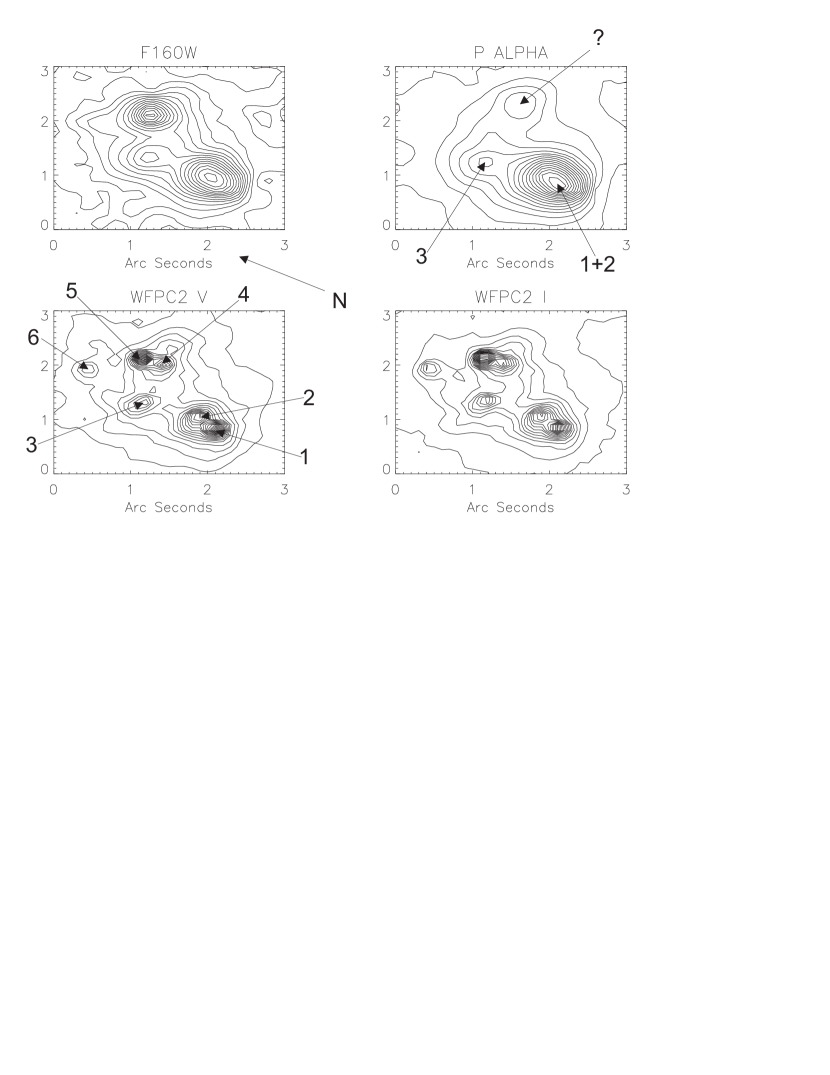
Many present day simulations of galaxy formation predict a much larger fraction of baryons that eventually become stars than the observed fraction of 5 to 10% (Cole et al., 2001). At the baryon densities favored by CMB measurements the luminosity function is over predicted at both high and low luminosities (Benson et al., 2003). Introduction of negative feedback by supernovae has not eliminated the problem. Negative feedback from the processes of star formation may offer the solution. SBS0335-052E, found in the Second Byurakan Survey (Markarian, Lipovetsky & Stepanian, 1983), offers a unique opportunity to observe star formation and feedback in conditions similar to primordial star formation but in a relatively nearby (53 Mpc) galaxy. SBS0335-052E resembles our current expectations for very early galaxy formation in that it has a very low metallicity, Z☉/40 (Izotov et al. (1990), Izotov et al. (1992)) and a very high gas to stellar mass ratio, to 1, based on the stellar content visible in optical light (Pustilnik et al., 2001; Papaderos et al., 1998). Observations with WFPC2 on HST by Thuan, Izotov & Lipovetsky (1997) revealed 6 point like sources, (see fig. 1a for the source numbers and contour plots) superimposed on diffuse emission. They deemed the 6 sources, which are within 500 pc of each other, to be Super Star Clusters (SSCs) with current star formation.
ISO observations by Thuan, Sauvage & Madden (1999) found strong dust emission from the region of the sources. These observations were supplemented by Dale et al. (2001) at 12.5 and other wavelengths and by Hunt, Vanzi & Thuan (2001) at 4 . Recent Spitzer observations (Houck et al., 2004) measured the spectrum of the infrared emission and found it quite different than other starburst galaxies and devoid of any PAH emission features as was noted by Thuan, Sauvage & Madden (1999). Additional Spitzer IRAC and MIPS data have also been recently acquired by Engelbracht et al. (2005). Non-thermal radio emission with a possible optically thick thermal component (Hunt et al., 2004) has been found to come from the region of the sources S1 and S2. The resolution of the radio observations is not high enough to spatially separate the two sources, however, very recent radio observations by Johnson (2005) resolve the two sources. Sources S1 and S2 are the southern most sources of the 6 SSCs which are bounded in the north by a supernova bubble which has led to speculation of a sequence of star formation propagating from north to south (Thuan, Izotov & Lipovetsky, 1997).
Chandra x-ray observations (Thuan et al., 2004) detect a point source at a position consistent with source 2 and possibly source 1. Thuan et al. (2004) conclude that the source is consistent with a compact group of high mass x-ray binaries or an intermediate mass black hole. Pustilnik, Pramskij, & Kniazev (2004) have analyzed the optical colors and H emission in SBS0335-052E to determine the maximum age of the underlying Low Surface Brightness (LSB) component of the galaxy. They find ages of Myr for (instantaneous, constant) star formation models with the instantaneous model providing the best fit, however previous work by Östlin & Kunth (2001) has provided caveats to the age determination in SBS0335-052.
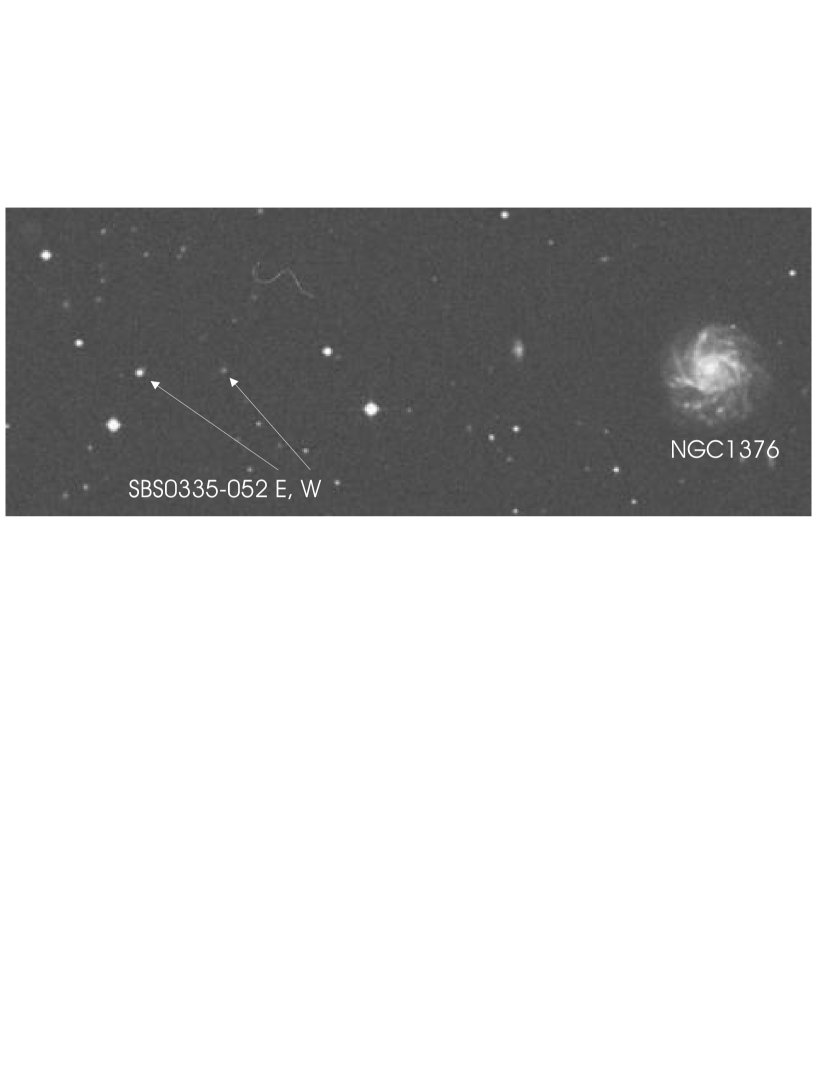
The SSCs of SBS0335-052E lie in the eastern component of the SBS0335-052E,W complex. Radio HI observations by Pustilnik et al. (2001) find that both components are part of a large neutral hydrogen cloud of about with a significantly larger spatial extent than most BCDs. Pustilnik et al. (2001) also determine a dynamical mass of for the system, most of which must be dark matter. They also note the presence of NGC 1376 at a projected distance of 150 kpc with a radial velocity about 100 km/sec greater than the SBS0335-052E system and a mass of 0.5 to . Figure 2 shows the spatial relationship of NGC 1376 and SBS0335-052 E and W. Interaction with NGC 1376 may be the trigger that initiated the current star formation episode in the SSCs (Pustilnik et al., 2001) and in SBS0335-052W which new work by Izotov, Thuan & Guseva (2005) has found to have the lowest metallicity yet found for any galaxy.
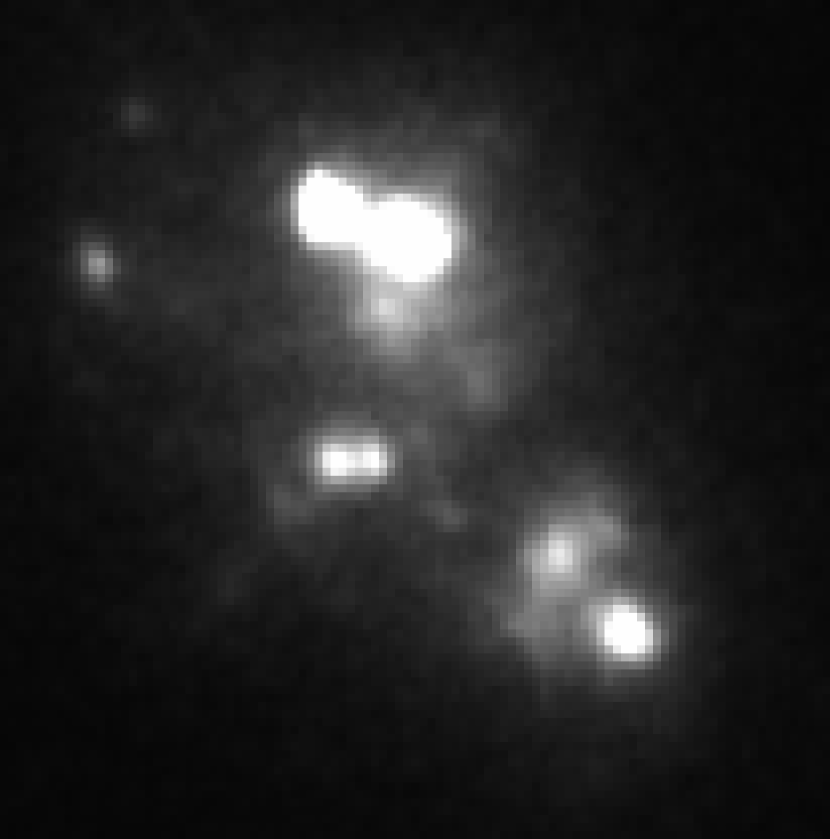
The first HST UV spectra were presented by Thuan & Izotov (1997) which showed Lyman alpha in absorption, consistent with the large neutral hydrogen cloud observed at radio wavelengths. They also found UV metal lines with P Cygni profiles which are most likely associated with the UV bright sources S4 and S5. HST ACS UV images of SBS0335-052E, fig. 1b ,using the solar blind channel by Kunth et al. (2003) found very little, if any, Ly emission escaping from the SSCs. They also revealed that S3 is double with a separation of only 26 pc projected on the sky. HST UV spectra with STIS (Kunth et al., 2004) also show strong absorption in Ly consistent with previous observations. Thuan & Izotov (1997) calculate a column density of neutral hydrogen of cm-2, again consistent with the large HI mass determined from the radio observations. UV spectroscopy with FUSE (Thuan, des Etangs & Izotov, 2005) confirms this result and measures a low metal abundance in the neutral gas which is similar to the ionized gas in contrast with earlier results (Thuan & Izotov, 1997). They note that their spectrum does not show any H2 absorption lines. The near infrared H2 emission spectrum observed by Vanzi et al. (2000) contains both thermal shock and florescent excitation components indicating a mixture of the two excitation mechanisms. Since the FUSE observations encompass the entire set of SSCs the primary line of sight probed by the observations is that toward S4 and S5 which are the brightest sources in the UV continuum. The neutral gas metal measurements are therefore dominated by the gas along those sight lines. If the H2 emission is primarily associated with the more obscured S1 and S2, the lack of UV H2 absorption lines quoted by Thuan, des Etangs & Izotov (2005) can easily be explained.
The general picture of SBS0335-052E is a low metallicity, gas rich system with ongoing star formation in SSCs. The bulk of the underlying stellar population appears to be less than at most 400 Myr indicating that most of the stars in SBS0335-052E are the result of recent star formation. The metals that do exist in SBS0335-052E may be a remnant of a much earlier episode of star formation or the result of an initial seeding of the IGM from the Pop. III stars that reionized the universe. We examine SBS0335-052 as a local example of star formation processes that must have been common in the early universe. If SBS0335-052 eventually becomes part of NGC 1376 it will be an example of a minor merger in the hierarchical process of galaxy assembly. In the following we will concentrate on the southern most sources, S1 and S2, which appear to be the youngest of the SSCs and the major source of the x-ray, Pa , and radio emission. The Pa and radio fluxes, plus the ground based determined near IR extinction are the keys to building a consistent picture of S1 and S2 and judging the feedback effect of star formation in the sources. In this paper the primary question is not the age of the underlying stellar population but rather what is the effect of the current star formation on the immediate environment.
2 Observations
The archival data analyzed here are from HST NICMOS images in F160W and Pa (GO-9360, R. Kennicut PI) which were taken as a component of the SIRTF (now Spitzer) Infrared Nearby Galaxies Survey (SINGS) (Kennicutt et al., 2003). All images are from the NICMOS camera 3 which has 0.2 arc second pixels for a wide non-diffraction limited field. The observations occurred on July 15, 2002. There are (4) 23.97 second integrations in the F160W filter, (4) 191.96 second integrations in the F187N filter and (4) 159.96 second integrations in the F190N filter. This is the standard integration suite for the SINGS snapshot survey. The redshift of SBS0335-052E puts the Pa line into the F190N filter rather than the rest frame F187N Pa filter. In this case the F187N filter serves as the continuum filter. The narrow band integrations were both STEP32 with 14 reads in the F187N filter and 13 reads in the F190N filter. The F160W integrations were STEP8 with 9 reads. The observations used a 4 point spiral dither pattern with spacing between the points. Integrations in each of the three filters were made at each dither position before moving to the next position. The integrations were carried out in a single orbit.
3 Data Reduction
The NICMOS images were reduced in a standard manner (see Thompson et al. (2005) for a detailed description). Although auxiliary observations were available for correction of SAA passage persistence, they were not utilized as none of the images appeared to have suffered from the effect. The NICMOS data were then rebinned to the WFPC2 pixel size of with the procedure IDP3 (Lytle et al., 1999). The images were aligned utilizing stars in the image and the F187N image was subtracted from the F190N image to produce the Pa image. The NICMOS image was then aligned to the original WFPC2 images of Thuan, Izotov & Lipovetsky (1997) again using stars in the image. Initially this was done using only the brightest star in the image, however, this appeared to produce poor alignments. It was then discovered by aligning using the fainter stars in the field that the brightest star has significant proper motion and had moved by between the NICMOS observations and the WFPC2 images taken in January of 1995. The alignment accuracy is better than . Contour plots of the NICMOS and WFPC images are shown in fig. 1a.
The measured flux in Pa for S1 and S2 is ergs s-1 cm-2. The point source limit for detection is about a factor of 100 below this number but varies across the image depending on the amount of diffuse emission in the region. The 1 single pixel noise is 0.002 ADUs per second which is equivalent to ergs s-1 cm-2. The continuum subtraction is accurate to better than based on the net residuals in the areas of the image that are devoid os sources. The F160W image has a 1 single pixel noise of 0.01 ADUs per second while the S1+S2 source has a total signal of 62 ADUs per second.
We also retrieved the archival ACS UV images from Proposal 9470 with Daniel Kunth as PI which are described in Kunth et al. (2003). These were aligned with IDP3 and utilized to better understand the morphology of SBS0335-052E at higher spatial resolution than the NICMOS images or the previous WFPC2 images. These images are in the continuum F140LP and Ly F122M filters. The pixel size of the retrieved images is 0.025″which were subsequently rebinned to 0.1″to match the other images used in this investigation. The single pixel 1 noise of the F140LP image is ergs s-1 cm-2. Since Ly is in absorption it is unclear how to interpret the F122M image, therefore the F140LP image is the only ACS image used in this study. Using a point spread function (PSF) determined from stars in the UV image away from the SSCs we find that the SSC S1 is resolved with a radius of 3 pc assuming the 53 Mpc distance given in § 1.
4 The Volume Emission Measure
The key elements to this study are the volume emission measure, , and the nature of the thermal radio emission. Together they determine the nature of the stellar population and the state of the ionized gas in S1 and S2. In what follows we will lump S1 and S2 together since they are unresolved in the NICMOS image. We assign half of the emission to each source, and hence half of the volume emission measure, although a radio image from Johnson (2005) indicates that S1 is the stronger radio source. The error is at most a factor of two and does not affect the major conclusions of the paper. The optical and near infrared contour plots and the UV F149LP image are shown in Figure 1 in the orientation of the original WFPC2 images. The dominant Pa emission is clearly centered on S1 and S2 with some emission also at S3. The lack of emission at the other sources may be due to lack of integration time. The gradient in Pa emission is consistent with the propagation of star formation from the north to the south as discussed in § 1.
We next use the Pa image to determine the volume emission measure for S1 and S2 which in turn is a direct measure of the ionizing flux. Hunt, Vanzi & Thuan (2001) measured the Br and Br flux in a 1.5 by 1 arc second region centered on S1 and S2 that does not include any of the emission from S3. The measured Pa flux in this region is ergs s-1 cm-2 after subtraction of flux from an aperture of equal area off the source to eliminate any contribution due to diffuse emission. The observed ratio (Hunt, Vanzi & Thuan, 2001) predicts an AV value of using the extinction law of Rieke & Lebofsky (1985) which is very similar to the value of 12.2 found by Hunt, Vanzi & Thuan (2001) using another extinction law. This in turn predicts an extinction of 1.64 magnitudes at Pa which gives an extinction corrected Pa flux of ergs s-1 cm-2 for the 1 by 1.5 arc second region that contains S1 and S2. Here we have assumed that since S1+S2 is the brightest Pa emitter, it is also probably the brightest Br emitter as well and the measured extinction from is appropriate for correcting the Pa emission of S1+S2. Izotov et al. (1997) find that the optical emission lines are best matched with an ionized gas temperature of 20,000 K which we will use in the rest of the analysis. An important question is whether the observed Pa flux in this work is consistent with the Br measurements in the context of normal Case B recombination theory. The extinction at Br from Rieke & Lebofsky (1985) is 0.57 magnitudes which gives an extinction corrected Br flux of ergs s-1 and a Pa to Br ratio of 5.26. The line ratios given in the appendix of Hunt et al. (2004) show that the calculated ratio for 20,000 K is 4.22. Given the expected errors in fluxes and extinctions this is considered in reasonable agreement. Note that if the Pa to Br ratio were affected by line optical depth effects we would expect that the observed ratio would be less than the calculated ratio since the population of the n=3 state of the hydrogen gas should be greater than the n=4 state. The numbers in this calculation are listed in Table 1.
A caveat to the calculated extinction should be mentioned. If the extinction derived from the infrared lines is extrapolated to the ultraviolet wavelength of the ACS image, 1400 Åit should be on the order of 24 magnitudes. Comparison of the predicted flux at 1400 Åfrom the Starburst99 calculation described below indicates an extinction of approximately 8 magnitudes. This however follows an already observed trend in SBS0335-052E that the derived extinction decreases at shorter wavelengths (Hunt, Vanzi & Thuan, 2001). The usual explanation is that only at longer wavelengths can you see into the regions of higher extinction. Since we are concerned with the true Pa flux we will use the extiction dervived directly from the infrared lines which is consistent in the ratios of Pa Br and Br . The radio images of Johnson (2005) (slide 10) confirm that there are no hidden ionization regions off the observed sources that could be the source of additional Br flux that might contaminate the measurement.
Using case B recombination theory
| (1) |
and the appendix from Hunt et al. (2004) the volume emission measure to total Pa power is given by
| (2) |
where is in ergs per second. For a 20,000 K ionized gas the observed Pa for S1 only, assigning half of the S1+S2 emission measure to S1, requires a volume emission measure (N) of cm-3 which is equivalent to 16,000 O7 stars using the O7 star N value of from Sternberg, Hoffmann & Pauldrach (2003). Use of the standard Kennicutt (1998) relation between the number of ionizing photons and the current star formation rate gives a rate of 2 M☉ per year for S1. Our concentration on S1 here, rather than S1+S2 is slightly arbitrary since the Pa image does not resolve the two sources. However, as will be seen later, S1 has a resolved radio spectrum, which is not available yet for S2, and S1 has a resolved size from the ACS UV image. S2 in this image is a diffuse object. We therefore concentrate on S1 as the source with the best determined physical parameters, and as mentioned earlier, changes by a factor of 2 in the S1 emission measure does not affect the conclusions of this paper.
Although the absolute star formation rate of 2 M☉ per year for S1 is not particularly high, the specific star formation rate, SSFR, the star formation rate divided by the stellar mass of M☉ found below, is year-1, consistent with the enhanced SSFR of higher z galaxies from the plots in Bauer et al. (2005). They find that the SSFR increases with redshift out to their maximum redshift of 1.5 indicating higher star formation rates per unit mass by two orders of magnitude at z = 1.5 than today. This provides some evidence that the star formation in SBS0335-052 is similar to star formation at much earlier times.
We used the online STARBURST99 code (Leitherer et al., 1999) to determine the volume emission measure produced by a M☉ stellar population with a Salpeter IMF in the mass range between 0.1 and 120 M☉. Comparing the volume emission measure from the STARBURST99 output at 3 My to the measured value we determine that S1 contains a stellar mass of M☉. Stars below 1 M☉ are probably not yet on the main sequence but we assume that they are gravitationally bound protostars that contribute to the gravitational mass of the cluster. Counting only stars above 1 M☉, the total formed mass is approximately M☉. The output of this same calculation determined that the actual number of O9 and earlier stars is approximately 7,500. This is lower than the number of equivalent O7 stars since the presence of stars earlier than O7 increases the number of ionizing photons per unit mass. The total luminosity of the stellar population is L☉ which is approximately 3 times the luminosity of the mid-infrared emission discussed in § 5.1.2.
4.1 Line Excess Phenomenon
Observations of the Br line in obscured Young Stellar Objects (YSOs) in the 1980s indicated that the observed line flux for objects with luminosities less than that of an O9 Zero Age Main Sequence (ZAMS) star were higher than predicted from the Ly continuum emission expected from the star, eg. ((Thompson, 1982), (Thompson, 1984)). At the same time the radio emission was far less than that from optically thin free-free emission with the same emission measure. The explanation of the line excess phenomenon was provided by Simon et al. (1983) who showed that a star with a significant wind will have a high density region which collisionally excites the n = 2 level of hydrogen. The excited atoms can then be ionized by Balmer continuum photons which gives an excess line emission over the ionization expected from only Lyman continuum photons. N as derived from the line emission is then no longer an accurate measure of the number of Lyman continuum photons. The lack of radio emission was due to the high optical depth at radio frequencies. If the majority of ionizing photons are produced by stars earlier than O9 then the line excess effect is irrelevant in our calculations involving N. Calculations of the ionizing flux for a stellar population with a Salpeter IMF and an upper mass cutoff of 120 M☉ indicates that 98% of the ionizing flux comes from stars earlier than O9, therefore the calculated value of N is suitable for determining the nature of the stellar population.
5 Radio Component
The optically thin free-free emission is directly proportional to the volume emission measure by the thermal bremsstrahlung equation
| (3) |
where is in W m-3 Hz-1 and all units are in the mks system (Woan, 2000). For radio frequencies the Gaunt factor is given by
| (4) |
As in Eqn. 3 the Z dependence has been dropped since the majority of the gas is hydrogen. At a distance of 53 Mpc the value of the volume emission measure found in § 4 from the Pa flux of S1, converted to m-3, predicts a thermal radio emission of 0.61 mJy at 10 GHz for an ionized gas temperature of 20,000 K which is a factor of 4 above the flux observed by Johnson (2005) (slide 8) of 0.15 mJy at 10 GHz for S1 only. The synchrotron flux observed by Hunt et al. (2004) for S1 + S2 is not present in the Johnson (2005) spectrum, indicating that it is probably associated with S2 or other regions outside S1.
Instead of the expected decrease in radio flux with frequency spectrum of optically thin free-free emission the observed radio spectrum has a roughly rising spectrum. This, coupled with the factor of 4 less emission than predicted from the emission measure, indicates that the radio emission has a significant optically thick component. The radio emission probably comes from a complex geometry of varying optical depths and perhaps temperatures but observations of galactic HII regions which surround the ionizing star (Simon et al., 1983) suggests a very simplified model of 7500 O stars with winds that produce HII regions of high enough density that the Stromgren spheres are confined to areas close to the star. We can use the simplified models of Olnon (1975) as a guide.
Olnon (1975) showed that for a density structure of around a star the frequency dependence of the optically thick radio emission is where . The unhindered free expansion wind with gives a roughly spectrum. The value of for is 1.72 which is appropriate for a wind that is not allowed to freely expand but is hindered by the surrounding medium. The flux at a frequency is given by
| (5) |
where D is the distance to the object and R is the R in the density equation. The optical depth is given by
| (6) |
and the emissivity f in is given by
| (7) |
for Olnon’s Model IV.
Distributing the observed flux equally among 7,500 stars and matching the observed flux at 10 GHz gives the following parameters for the HII regions around each star. The electron density at R is and R is pc or 433 AU for a temperature of 20,000 K. The optical depth at R is 9.7, justifying the assumption of optically thick emission. As is well known, Olnon’s Model IV is not valid for since an integration of the density law leads to an infinite mass. The density law must be truncated at some radius as is done for in Olnon’s model V. The solutions are not given for other q values but the general nature is that they are basically Model IV in the optically thick regions and the normal free-free spectrum in the optically thin regions, therefore use of Model IV in this frequency range is justified and real stars will have truncated flows when the pressure of the interstellar medium halts the wind. The parameters described above are typical of hyper compact HII regions. If 2R is taken as a characteristic size of the ionized regions then the total volume occupied by the ionized gas is only pc3 which is a filling factor of less than for a 3 pc cluster radius. This is justification for our assumption that the HII regions are confined to the stars themselves. The average distance between the 15,000 O stars in the cluster is about 0.1 pc, much greater than the size of the HII regions. Note that integration of the density equation out to 1.9 R accounts for the volume emission measure calculated from the Pa emission. In reality it is probable that although the majority of O stars may have confined HII regions, that some of the HII regions have broken out and that some ionizing UV emission is present throughout the cluster, producing a background optically thin component of emission. Obviously the stars in S1 will have differing density structures and the structure we have used here is a representative average. The variations in structure will produce bumps and wiggles in the radio spectrum as is observed in the spectrum of Johnson (2005). It also should be emphasized that the model developed here is not the only possible geometry of the ionized gas that will account for the line and radio emission. It is, however, motivated by observations in our own galaxy of young stars with winds that limit the ionized area to a small region centered on the star.
5.1 Other Emission Components
Although not critical to our discussion of feedback in SBS0335-052E, we address two other known emission components for completeness and to show that neither component has a significant effect on the galaxy at the present time. The x-ray emission component could conceivably have a significant role in the nature of the galaxy at a later time, however.
5.1.1 X-Ray Emission
The total x-ray luminosity for SBS0335-052E is approximately ergs per second (Thuan et al., 2004) depending on the spectral model used to fit the data. The emission is primarily from a point source although Thuan et al. (2004) state that there is also evidence for faint extended emission with a luminosity of ergs per second. The temperature of the x-ray emitting gas is keV which is much hotter than the 1 eV gas responsible for the nebular continuum. For this temperature gas the volume emission measure, , required is cm-3 which is more than 1000 times less than is required for the nebular emission (see § 4). This indicates that the hot x-ray emitting gas is a minor component of the ionized gas in SBS0335-052E. Thuan et al. (2004) indicate that the x-ray spectrum is relatively soft and consistent with either a cluster of high mass x-ray binaries or with an intermediate mass black hole. The thermal bremsstrahlung from the x-ray emitting gas is only Jy at radio frequencies, therefore it does not contribute to the observed radio flux.
5.1.2 Mid-Infrared Emission
One of the surprises of SBS0335-052E was the discovery of strong mid-infrared emission from dust in a galaxy that has very low metallicity (Thuan, Sauvage & Madden (1999), Plante & Sauvage (2002)). Neither the ISO image nor the SPITZER peak up image (Houck et al., 2004) have the spatial resolution to associate the infrared emission with a particular component or SSC, but it is consistent with being centered on S1-S2. The simplest explanation is that infrared source is associated with S1 and S2. This is also consistent with the ground based observations of Dale et al. (2001) which show that the Br emission and the 12.5 emission are coincident to an accuracy of 0.5″. The high emission measure of S1 and S2 indicate that they are young and still have dust nearby if not in the clusters themselves. Houck et al. (2004) comment that the mid-ir spectrum is consistent with very hot dust which is another reason for associating the mid-ir emission with the young S1 and S2 SSCs. The intrinsic luminosity of is sufficient to power the approximately (Engelbracht et al., 2005) mid infrared luminosity. In fact with an AV value of 12 there should be a three times higher mid-infrared luminosity than that observed if the dust causing the extinction is located close to S1. Given our model of sources with strong winds it is probable that the dust geometry is quite complex and that there may not be high dust obscuration over a full steradians, allowing a large fraction of luminosity to escape in directions other than along our line of sight to the sources. It is very probable that there is little, if any, dust in the strong wind, ultra-compact HII regions surrounding the stars.
6 Feedback on the Galaxy
One of the critical missing elements in our ability to model the formation, growth, and evolution of galaxies is a good understanding of how the initial star formation affects, or feedbacks on, subsequent star formation. SBS0335-052E affords an opportunity to observe the process at reasonably high resolution under conditions similar to star formation at very high redshift. There are several qualitative clues and a few quantitative ones that can be identified.
6.1 Qualitative Evidence
There is significant evidence as discussed by Thuan, Izotov & Lipovetsky (1997) and now with the increase of Pa emission toward the southern clusters that there is a progression of apparent ages, starting with the supernova cavity in the northeast, ending with the obviously young S1 and S2 in southwest. This suggests that each episode of star formation has positive feedback on subsequent star formation. The lack of a significant population of stars in the supernova cavity suggests that the very first star formation episode ended very quickly, blowing out the area but producing compression of the gas that lead to star formation at S6, S5 and S4. These then induced star formation at S3 and subsequently at S1 and S2. More qualitative evidence of positive, or at least nondestructive feed back is the double source, S3. The two clusters are separated on the sky by only 26 pc and are therefore almost certainly associated. That two clusters can form stars in such close proximity is strong evidence that adjacent star forming areas do not produce strong negative feedback. Although not as intense as S1+S2, S3 has detectable Pa emission indicating current star formation. It is not possible to determine which of the clusters, or perhaps both, is the source of the star formation. The exact nature of the clusters is not critical, but rather that two clusters can form in close proximity, regardless of the sequence, is evidence that the presence of large scale star formation does not necessarily terminate other star formation in the immediate environment. It is unfortunate that we can not observe this system at much higher resolution to see the dynamical interaction between two closely paired clusters.
The simple existence of SSCs, which have thousands of O stars within a radius of only a few parsecs, sets severe limits on the negative feedback from massive star formation. The formation of the first massive stars does not prevent the subsequent formation of thousands of more massive stars at average distances of far less than a pc from the first stars. In fact this is a motivating consideration in the construction of our model system to see if there is a plausible model that matches the observed parameters and that allows the formation of such a cluster. Since a large fraction of stars may have formed in clusters this has important implications on theories of galaxy evolution.
6.2 Quenched Photoionization Feedback
If our model of individual HII regions surrounding the O stars is even approximately correct it says that the volume of ionized gas in at least S1 is quite small compared to the volume of the cluster. This invokes a scenario that most of the luminous stars are losing mass through stellar winds and the ionizing photons of the stars are expended within a few 100 AU from the stars due to the high densities created by the winds. This quenches any negative feedback due to the photoionization of neutral gas. Other than through winds and gravity these stars have very little effect on their environments outside of their HII regions. As long as these winds continue, photoionization will not play a role in feedback on the galaxy as a whole. It is important to note here that the boundaries of the HII regions are simply where the ionizing photons are depleted and do not necessarily mark any boundary for the gas outflow.
Although the effects of photoionization can be accurately mapped through emission line images and radio emission maps, the effects of stellar winds are less easily measured. Work by Chevalier & Clegg (1985) indicated that massive and concentrated star clusters should produce a strong stationary superwind at all times in their evolution. This would remove gas from the cluster and affect the surrounding region through shocks and density enhancement. Recent work by Dopita et al. (2005), however, indicates that many outflows around HII regions created by young stellar clusters are ”stalled” by the ambient interstellar medium. In this case, however, the individual stellar HII regions appear to be stalled by the intercluster gas. This may be a phase that further delays the onset of feedback at the cluster level. Dopita et al. (2005) note that it is mainly the pressure that controls the expansion of the HII regions. The low star to gas mass ratio and the large gas mass of SBS0335-052 may contribute to stalling out the expansion of the stellar HII regions.
7 Future Evolution
The future evolution of the SSCs and of SBS0335-052 itself is of great interest. SBS0335-052W has an even lower metallicity than the eastern component but with a higher x-ray luminosity (Thuan, des Etangs & Izotov (2005), Izotov, Thuan & Guseva (2005). It appears that the western component has not yet had a major episode of star formation.
7.1 Evolution of SBS0335-052
As suggested by Pustilnik et al. (2001), the star formation in the eastern component was probably triggered by interactions, either between the eastern and western component or with NGC 1376. Since the two components share a common HI cloud it appears likely that it was the interaction with NGC 1376 that triggered the formation of the SSCs. The large amount of neutral gas, M☉, shows that there is adequate mass for further star formation in both components. Based on only the radial component of the velocity difference between SBS0335-052 and NGC 1376, they are gravitationally bound to each other. It would appear that the eventual fate of SBS0335-052 is to merge with the much larger NGC 1376 in what in hierarchical galaxy assembly would be called a minor merger. In most galaxy merging simulations significant star formation occurs after the first encounter which would mean that SBS0335-052 has already had its first encounter with NGC 1376 and may have been significantly closer to it in the past.
7.2 Evolution of the SSCs
The current SSCs in SBS0335-052E will evolve on a much shorter time scale than the SBS0335-052/NGC 1376 system. According the stellar populations calculated by Starburst99 there are more than 2500 stars in the S1 SSC with more than 30 M☉. These stars should end up as black holes at the end of their evolution. Although many of the black holes may be ejected from the cluster due to supernova kicks, there exists the possibility of having several thousand black holes within the 3 pc radius of the cluster. This proximity may lead to mergers which could form an intermediate mass black hole, consistent with the x-ray emission from the region. An alternative scenario is presented by Zwart et al. (2004) who modeled the cluster MGG 11 in M82. They calculated that the dynamical time for a 100 M☉ star to sink to the center of the cluster was 3 Myr which led to several collisions and the formation of a 800-3000 M☉ star which then led directly to the creation of an intermediate mass black hole without significant mass loss. Although the radius of S1 is about twice that of MGG 11 it has about 10 times more mass leading to a similar dynamical sink time from equation 1 of Zwart et al. (2004). In either scenario super star clusters may be the birthplace of intermediate mass black holes that can be the seeds of the massive black holes that power AGNs. The lack of x-ray emission from the other sources in SBS0335-052 indicate that this process did not occur in those sources, however, we do not currently have detailed information on their stellar density in the formation epoch equivalent to the current epoch of S1 and S2.
8 Conclusions
The Pa flux from the S1 SSC provides a determination of the volume emission measure which when compared to the observed radio emission indicates that much of the radio emission occurs at high to moderate optical depth and high density. A simple model which divides the volume emission measure equally among the 7500 O stars predicted from STARBURST99 and using radio emission models of Olnon (1975) indicates a very low filling factor for the ionized gas, consistent with the assumption of individual HII regions. The confinement of the ionizing flux to regions of only a few hundred AU around individual stars limits and delays the effect of photoionization of neutral gas and molecular clouds. This provides a consistent picture of how several thousand O stars can form within a radius of 3 pc and may be indicative of star formation at early times in the universe. Although indicating very little negative feedback at the current time, SBS0335-052 has a very low star to gas mass ratio. As that ratio increases and the gas mass decreases the confining pressure of the interstellar medium may decrease to a level where the HII regions are no longer stalled at small radii and begin to produce negative star formation feedback on the galaxy as a whole. Finally we address the evolution of both the complex and the SSCs indicating that SBS0335-052 may be part of a minor merger with NCC 1376 and speculating that S1 and SSCs in general may be the birthplace of intermediate mass black holes.
References
- Bauer et al. (2005) Bauer, A.E., Drory, N., Hill, G.J. & Feulner, G. 2005 ApJ, 621, L89
- Benson et al. (2003) Benson, A.J., et al. 2003, ApJ, 599, 38
- Chevalier & Clegg (1985) Chevalier, T.A., & Clegg, A.W. 1985, Nature, 317, 44
- Cole et al. (2001) Cole, S., et al. 2001. MNRAS, 326, 255
- Dale et al. (2001) Dale, D.A. et al. 2001, AJ, 122, 1736
- Dopita et al. (2005) Dopita, M.A. et al. 2005, ApJ, 619, 755
- Engelbracht et al. (2005) Engelbracht, C.W. et al. 2005 in ASP Conference Series TBD, The Spitzer Space Telescope: New Views of the Cosmos, L. Armus ed. in press
- Houck et al. (2004) Houck, J.R. et al. 2004, ApJS, 154, 211
- Hunt et al. (2004) Hunt, L.K., Dyer, K.K., Thuan, T.X. & Ulvestad, J.S. 2004, ApJ, 606, 853
- Hunt, Vanzi & Thuan (2001) Hunt, L.K., Vanzi, L., & Thuan, T.X. 2001, A&A, 377, 66
- Izotov et al. (1990) Izotov, Y.I. et al. 1990, Nature, 343, 238
- Izotov et al. (1992) Izotov, Y.I., Lipovetsky, V.A., Guseva, N.G., & Kniazev, A.Y. 1992, in The Feedback of Chemical Evolution on the Stellar Content of Galaxies, ed. D. Alloin & G. Stasinska (Paris: Obs. Paris), 138
- Izotov et al. (1997) Izotov, Y.I. et al. 1997, ApJ, 476, 698
- Izotov, Thuan & Guseva (2005) Izotov, Y.I., Thuan, T.X., & Guseva, N.G. 2005, ApJ, in press.
- Johnson (2005) Johnson, K. 2005, IAU Symposium 227, online record of presentations, http://www.arcetri.astro.it/iaus227/, slides 8 and 10 in talk, (click on talk not the presentation title).
- Kennicutt (1998) Kennicutt, R.C. 1998, ARA&A, 36, 189
- Kennicutt et al. (2003) Kennicutt, R.C. et al. 2003, PASP, 115, 928
- Kunth et al. (2003) Kunth, D. et al. 2003, ApJ, 597, 263.
- Kunth et al. (2004) Kunth, D. et al. 2004, astro-ph/0407584 v1
- Leitherer et al. (1999) Leitherer et al. 1999, ApJS, 123, 3
- Lytle et al. (1999) Lytle, D., Stobie, E., Ferro, A., & Barg, I. 1999, in ASP Conf. Ser. 172, Astronomical Data Analysis Software and Systems VIII, ed. D. Mheringer, R. Plante, & D. Roberts (San Francisco; ASP), 445
- Markarian, Lipovetsky & Stepanian (1983) Markarian, B.E., Lipovetsky, V.A & Stepanian, J.A. 1983, Astrofizika, 19, 29
- Olnon (1975) Olnon, F. M. 1975, A&A, 39, 217
- Östlin & Kunth (2001) Östlin, G. & Kunth, D. 2001, A&A, 371, 429
- Papaderos et al. (1998) Papaderos, P., Izotov, Y.I., Fricke, K.J., Thuan, T.X. & Guseva, N.G. 1998, A&A, 338, 43
- Plante & Sauvage (2002) Plante, S. & Sauvage, M. 2002, AJ, 124, 1995
- Pustilnik et al. (2001) Pustilnik, S.A., Brinks, E., Thuan, T.X., Lipovetsky, V.A. & Izotov, Y.I. 2001, AJ, 121, 1413
- Pustilnik, Pramskij, & Kniazev (2004) Pustilnik, S.A., Pramskij, A.G. & Kniazev, A.Y. 2004, A&A, 425, 51
- Rieke & Lebofsky (1985) Rieke, G.H. & Lebofsky, M.J. 1985, ApJ, 288, 618
- Schaerer (2002) Schaerer, D. 2002, A&A, 382, 28
- Simon et al. (1983) Simon, M., et al. 1983, ApJ, 266, 623
- Sternberg, Hoffmann & Pauldrach (2003) Sternberg, A., Hoffmann, T.L. & Pauldrach, A.W.A. 2003, ApJ, 599, 1333
- Thompson (1982) Thompson, R.I. 1982, ApJ, 257, 171
- Thompson (1984) Thompson, R.I. 1984, ApJ, 283, 618
- Thompson et al. (2005) Thompson, R.I. et al. 2005, AJ, 130, 1
- Thuan, Izotov & Lipovetsky (1997) Thuan, T.X., Izotov, Y.I., & Lipovetsky, V.A. 1997, ApJ, 477, 661
- Thuan & Izotov (1997) Thuan, T.X. & Izotov, Y.I. 1997, ApJ, 489, 623
- Thuan, Sauvage & Madden (1999) Thuan, T.X., Sauvage, M., & Madden, S. 1999, ApJ, 516, 783
- Thuan et al. (2004) Thuan, T.X., Bauer, F.E., Papaderos, P., & Izotov, Y.I. 2004, ApJ, 606, 213
- Thuan, des Etangs & Izotov (2005) Thuan, T.X., des Etangs, A.L, & Izotov, Y.I. 2005, ApJ, 621, 269
- Vanzi et al. (2000) Vanzi, L., Hunt, L.K., Thuan, T.X. & Izotov, Y.I. 2000, A&A, 363, 493
- Woan (2000) Woan, G. 2000, The Cambridge Handbook of Physics Formulas, (Cambridge, England, Cambridge University Press), p160.
- Zwart et al. (2004) Zwart, S.F.P., Baumgardt, H., Hut, P., Makino, J. & McMillan, L.W. 2004, Nature, 428, 724
| Line | Observedaa by aperture | Extinction Corrected | PredictedbbFor 20,000 K gas |
|---|---|---|---|
| erg s-1 cm-2 | erg s-1 cm-2 | erg s-1 cm-2 | |
| Pa | |||
| Br |