22institutetext: Facultad de Ciencias Astronómicas y Geofísicas, La Plata, Argentina.
22email: jperez@fcaglp.unlp.edu.ar 33institutetext: Instituto de Astronomía y Física del Espacio, Argentina.
33email: patricia@iafe.uba.ar 44institutetext: Observatorio Astronómico de la Universidad Nacional de Córdoba, Argentina.
Galaxy Pairs in cosmological simulations: Effects of interactions on star formation.
We carried out a statistical analysis of galaxy pairs in hydrodynamical CDM simulations. We focused on the triggering of star formation by interactions and analysed the enhancement of star formation activity in terms of orbital parameters. By comparing to a suitable sample of simulated galaxies without a nearby companion, we find that close encounters ( kpc ) may effectively induce star formation. However, our results suggest that the stability properties of systems and the spatial proximity are both relevant factors in the process of triggering star formation by tidal interactions. In order to assess the effects of projection and spurious pairs in observational samples, we also constructed and analysed samples of pairs of galaxies in the simulations obtained in projection. We found a good agreement with observational results with a threshold at kpc for interactions to statistically enhance star formation activity. For pairs within kpc , we estimated a contamination by spurious pairs, reduced to for close systems. We also found that spurious pairs affect more strongly high density regions with of spurious pairs detected for low density regions compared to found in high density ones. Also, we analysed the dependence of star formation on environment by defining the usual projected density parameter for both pairs and isolated galaxies in the simulations. We find the expected star formation-local density relation for both galaxies in pairs and without a close companion, with a stronger density dependence for close pairs which suggests a relevant role for interactions in driving this relation.
Key Words.:
methods: numerical- cosmology: theory - galaxy: formation - galaxies: interactions.1 Introduction
If the Universe evolves according to the current cosmological paradigm which postulates the hierarchical growth of the structure, mergers and interactions are common events in the life of galaxies. The effects of these violent processes are highly complex to study owing to their non-linearity and their possible dependence on redshift. Toomre et al. (1976) built up the first numerical simulations of galaxy interactions showing that many observed characteristics of galaxies, such as morphology, could be explained by these processes. These authors showed that galactic discs are unstable under tidal interactions which could modify the mass distribution, converting spiral and irregular galaxies into bulge ellipticals and SOs. More recent numerical simulations of pre-prepared mergers showed that interactions between axisymmetrical systems without bulges or with small ones might induce gas inflows to the central region of the systems, triggering starburst episodes (e.g. Barnes & Hernquist 1996; Mihos & Hernquist 1996). Using cosmological hydrodynamical simulations, Tissera et al. (2002) studied the effects of mergers in the star formation history of galactic objects in hierarchical clustering scenarios, finding similar results. These results indicated that, during some merger events, gaseous discs could experience two starbursts depending on the characteristics of the potential wells of the systems. The first starburst is triggered during the orbital decay phase by gas inflows driven as the satellites approach each other, while the second one is produced when the two baryonic clumps collide, in agreement with results from pre-prepared simulations. These authors also showed that the effects of interactions on the star formation activity were different at different stages of evolution of the systems, being more efficient in early phases when their potential wells were shallower.
In the local Universe, observations showed that mergers and interactions affect the star formation (SF) activity in galaxies (e.g. Larson & Tinsley 1978; Donzelli & Pastoriza 1997). Observations of high redshift systems found that the merger rate and the star formation activity of galaxies increase with redshift, suggesting a change in the impact of interactions on the SF process as galaxies evolve (Le Fèvre et al. 2000; Patton et al 2002). Barton et al. (2000) showed that interactions during close encounters could be correlated with enhancements of the star formation activity. These results were confirmed by Lambas et al. (2003) and Alonso et al. (2004) who explored the dependence of star formation activity in galaxies with close companions on relative proximity and environment by constructing galaxy pairs catalogs from the Two Degree Field Galaxy Redshift Survey (2dFGRS; Colles et al 2001). These authors found that independently of environment, galaxy pairs exhibit an enhancement of the star formation activity with respect to galaxies without a close companion from approximately the same projected distance and relative radial velocity thresholds: r 25 kpc and 100 km s-1. This independence of the projected orbital thresholds suggests that the nature of star formation activity driven by galaxy interactions may be independent of environment, although the general level of star formation activity tends to be lower in high density regions (see also Nikolic et al. 2004).
A main shortcoming of studying galaxy pairs in observed catalogs is the impossibility of estimating the 3D separation between galaxies. There are two main sources of problems: the geometrical effects of projecting and the formation of spurious pairs owing to the projection. Although Lambas et al. (2003) and Alonso et al. (2004) analysed one of the largest available galaxy pairs samples, these effects could introduce noise or distort the correlation signals. ¿From different numerical approaches, Mammon (1986) and Alonso et al. (2004) found that the effects of spurious pairs tend to be larger in high density environments and for larger relative projected separations. In this paper, we analyse hydrodynamical cosmological simulations and constructed 3D and 2D catalogs of galaxy pairs (hereafter GPs) with the aim at confronting the current cosmological paradigm with observations and assessing the impact of the two mentioned projection effects on the results. The 3D-GPs were selected by proximity criterium while for the 2D-GPs we applied both relative velocity and spatial separation cut-offs following the observational procedures described by Lambas et al. (2003).
This paper is structured as follows: Section 2 describes the main characteristics of the numerical simulations and discusses the galaxy pairs selection. Section 3 shows results for the tridimensional galaxy pair catalog. In Section 4, we analyse the projected galaxy sample and confront it with observations. Finally, we summarize the findings in Section 5.
2 Catalogs of Galaxy pairs in numerical simulations.
In this Section we describe the main characteristics of the analysed simulations and the procedure applied for the identification of galactic systems and the pair definition.
2.1 Numerical Experiments
We discuss results for cosmological simulations that include the gravitational and hydrodynamical evolution of the matter, star formation, chemical enrichment and metal-dependent cooling. We have performed a CDM simulation with the chemical GADGET-2 of Scannapieco et al. (2005). We have also analysed a experiment (hereafter SCDM) with the chemical hydrodynamical code of Mosconi et al. (2001) to examine at what extent galaxy-galaxy interactions are affected by the cosmological parameters. Table 1 summarizes the main simulation parameters. The simulated volume is representative of a typical field region of the Universe but it is smaller than that covered by current galaxy surveys. Hence, comparison with observations are only intended to constrain global trends.
In both simulations the star formation algorithms are based on the Schmidt law (Navarro & White 1994; Tissera 2000). However, the chemical GADGET-2 transforms gas into stars in a stochastic way, avoiding the use of hybrid particles (i.e. particles representing gas and stars at the same time). Both chemical codes describe the enrichment of the interstellar medium by SNII and SNIa (see for details Mosconi et al. (2001) and Scannapieco et al. (2005)), following the production of the same chemical elements. The simulation SDCM has been used by Tissera et al. (2001, 2002) and Cora et al. (2003) to study Damped Lyman Alpha Systems.
The initial particle masses of the SCDM and CDM simulations are different. The SCDM run has equal mass particles for the baryons and dark matter of , while the CDM run has initially and . Hence, a comparison of the results from these two different cosmological simulations will also help to probe the robustness of our conclusions against numerical resolution and codes.
| Cosmology | 111: Mass density parameter | 222: Vacuum energy density parameter | 333: Baryonic density parameter | 444: Hubble constant | 555: RMS density fluctuations at 8 Mpc | 666: Initial number of gas particles | 777: Total number of dark matter particles | 888: box size of the simulated volume Mpc | |
| CDM | 0.30 | 0.70 | 0.04 | 70 | 0.90 | 10 | |||
| SCDM | 1.00 | 0.00 | 0.10 | 50 | 0.62 | 26214 | 235930 | 5 |
2.2 Galaxy pair identification.
The identification of galaxy-like objects (GLOs) in the simulations was carried out according to the following steps. First, we identified the global structures using the percolation method friends-of-friends (fof; Davis et al. 1985) to select virialized haloes. This method allows us to identify the gravitational bounded concentrations but not the substructures. In particular, when two structures collide, their dark matter haloes will also do so. Depending on the particular dynamical characteristics of the encounter, the baryonic substructures that can be associated with galaxies may be already sharing a common dark matter halo at the time we are looking at them, or not. However, in this work, we are only interested in the baryonic substructures within the dark matter haloes. For this reason, we designed a detailed procedure to individualize baryonic satellites within a region of centered at each virialized system by fine-tuning the linking length parameter of the fof algorithm. This fine-tuning was not possible to carry out automatically requiring a close check of the substructure selection in each region in order to prevent the inclusion of loose agglomerations.
By considering that the radius which encloses of the luminous mass of an exponential disc corresponds to the isophote of 25 and by assuming that the mass-to-light ratio is independent of radius, we define the optical radius as the one that encloses of the baryonic mass of the system. The GLOs analysed at two optical radius will be, hereafter, referred as simulated galaxies. After the identification of the simulated galaxies, we analysed their astrophysical properties and their star formation activity within two optical radius. We only take into account those systems with stellar masses larger than within two optical radius to minimize numerical resolution problems. The final simulated galaxy sample is made of 364 systems. For each simulated galaxy, we estimated the stellar birthrate parameter, , defined as the present level of star formation activity of a galaxy normalized to its mean past SF rate, . Thus, systems undergoing strong SF activity have . This parameter has been found to correlate with morphology (Kennicutt 1998) in the sense that late-type spirals and starbursts have larger values. Note that we applied the physical concept behind the birth rate parameter to define our simulated parameter. Observations have to resort to galaxy formation models to estimate the (Carter et al. 2002). In the case of the simulations, we constructed the star formation history of each GLO by estimating the SFR in each time step of integration and then smoothing out the distributions with a yr filter. This filter erases numerical noise without deleting the main features. Then, the simulated parameter is defined as a ratio between the SFR at and the mean past star formation rate, .
¿From the distribution of simulated galaxies we built up the 3D catalog of galaxy pairs by applying a proximity criteria which was determined by estimating the mean birth rate parameter in distance bins. This distribution showed a sharp increase of the star formation activity for . We take this distance threshold, , to define galaxy pairs from the 3D distribution. Then, the so-called 3D-GP catalog is made up of 88 galaxies in pairs. Systems with have a mean star formation activity similar to the average of the simulated box. In order to unveil the effects of having a close companion on the star formation activity, we defined a control sample following the procedure applied by Lambas et al. (2003) to the analysis of galaxy pairs in the 2dfGRS. This control sample is then constructed by selecting those simulated galaxies which do not have a companion within the distance threshold .
For the purpose of comparing our results with observations, a 2D simulated-galaxy pair catalog (hereafter 2D-GP catalog) was also constructed by projecting the total 3D simulated-galaxy distribution onto random directions. We considered three different random observers which yield a total projected sample of 2184 simulated galaxies. Then, the 2D pairs were selected according to the observational criteria of Lambas et al. (2003). Thus, the adopted thresholds in relative projected separation and radial velocity are: 100 kpc and 350 km s-1 which produce a sample of 677 simulated galaxies in pairs. Similarly, we define a close pair sample by adopting the observational criteria determined by Lambas et al. (2003): 25 kpc and 100 km s-1, obtaining a subsample of 194 close pairs in projection. The corresponding control sample was constructed from the projected simulated distribution by requiring its members not to have a companion system within these thresholds.
3 Analysis of the 3D Galaxy Pair Catalog
In this Section we discuss the star formation activity as a function of orbital parameters in the 3D-GP catalog. For this purpose we define the parameter , where is the mean birthrate parameter of the control sample (. Hence, provides a direct indication of the excess of star formation in galaxy pairs with respect to the mean star formation in galaxies without a close companion.
In Fig. 1, we show the mean parameter as a function of the distance to the closest neighbour. As we can see from this figure, there is a clear trend for an increase of the star formation activity with proximity to a companion. The error bars have been estimated by applying the boostrap technique. On average, we have 20 galaxies per radius bin. Pairs closer than the critical distance kpc exhibit an excess of star formation activity with respect to the mean SF of the control sample. The error of has been determined considering the values at the intersection of the corresponding 1- error zone with the threshold. This kpc value will be taken as a 3D-distance threshold for tidally triggered enhancement of the star formation activity.
The analysis of the SF activity in simulated galaxy pairs as a function of the relative tridimensional velocity shows a flat trend (Fig. 2) with a very weak indication that encounters with relative velocities lower than km s-1 may be statistically related with an increase in the SF activity (Mihos 2004). The error for has been estimated in a similar fashion to that of .


We found that around of the simulated galaxy pairs, although having a companion within kpc , do not show star formation enhancement. Previous works (e.g. Barnes & Hernquist 1996; Tissera 2000; Tissera et al. 2002) have shown that, although star formation can be induced during close-by interactions, the triggering of gas inflows with subsequent strong star formation activity depends, at least, on the orbital parameters (Barnes & Hernquist 1996), the gas reservoir and the internal properties of the potential well (Tissera 2000). Hence, strong star formation activity is not a necessarily the result of an interaction. In this analysis we are taking into account systems with a variety of astrophysical and dynamical conditions and selecting them by using only a proximity criterium. Then, we expect that a fraction of them will not exhibit strong star formation activity. A similar situation might occur in observations.
If we separate galaxies in pairs (with kpc ), according to their star formation activity, in passive SF () and active SF () pairs, we get that a of galaxies in pairs do not have an excess of star formation with respect to the mean of the control sample. In order to understand the physical cause of active or passive star formation activity in galaxies with a close companion, we analyse the properties of these systems. This analysis is carried out on statistical basis since we do not have enough number of systems to segregate them according to all the parameters that might be relevant such as the different combination of orbital parameters.
In Fig. 3a we show the distribution of mean stellar ages () for active (dotted lines) and passive (solid lines) SF simulated galaxies in pairs. As it can be appreciated from this figure, passive SF galaxies in pairs show a peak distribution with a mean age at Gyr . Systems undergoing strong SF activity show a distribution shifted to shorter ages (with a mean at 7.65 Gyr ) with an important young tail. These results suggest that, on average, passive SF galaxies in pairs are dominated by an old stellar population. Estimations of the gas fractions show a trend for passive SF galaxies in pairs to have smaller gas fractions with respect to active SF ones as it can be seen from Table 2 (see first two columns).
Another important parameter related to the capability of triggering star formation by tidal torques is the characteristic of the potential well. Previous works showed that unless dark matter haloes or compact stellar bulges can provide stability to the systems, interactions may induce strong gas inflows in gaseous discs triggering star formation activity (Athanassoula & Sellwood 1986; Binney & Tremaine 1987; Martinet 1995; Mo, Mao & White 1998). Tissera et al. (2002) used the central circular velocity () of the galactic systems to quantify the strength of the potential well finding a correlation between the deepness of the potential well and the triggering of the star formation activity. Following their work, we estimated the central circular velocity in a similar fashion for galactic systems in pairs. As it can be seen from Fig. 3b, we also found a trend for active SF systems to have less concentrated potential wells, with a mean at 76 , than passive SF ones which showed a mean at 103 . Note that the velocity distribution of passive SF systems is quite broad and may include galactic objects with less concentrated potential well which have just experienced a starburst. We have calculated the fraction () of total stellar mass which formed in the last 0.5 Gyr as a function of central circular velocity for these passive SF systems. We can see in Fig. 4 a clear correlation of the recent past SF activity with the properties of the potential well (solid line). Systems with less concentrated potential wells have experienced a more important star formation activity in the recent past, although all of them are currently forming stars at lower rates than the mean of isolated galactic systems. This trend is much stronger in close systems () where the combination of proximity and shallow potential well correlates with a more important SF activity in the recent past (dashed line). We have also computed the corresponding fraction for active SF systems as depicted in Fig. 4 (insert box). As it can be seen from this figure, these systems also show a correlation of with , although they are experiencing a more important star formation activity with respect to their past SF history than passive SF systems.
In order to further investigate the effects of interactions on the SF activity, we assume that systems closer than are merging candidates, while systems at larger separation will be considered tidally interacting ones.
-
•
Merging Pairs: We found that of simulated galaxies in pairs are merging systems and only of them is actively forming stars. Passive SF merging pairs have a mean gas fraction of while active SF merging ones have a mean gas fraction of . Passive SF systems have older stellar populations and deeper potential wells than those with active star formation as it can be seen from Table 2.
-
•
Interacting Pairs: We estimated that of the total pair sample are interacting systems with enhanced star formation activity, implying that of pairs with suffer tidally induced starbursts. Active interacting systems have larger gas fractions and shallower potential wells with a mean at at 62 . We also note that passive interacting galaxies in pairs have stars older than the rest of the pairs with a mean age at 12.0 Gyr . Table 2 summarizes these properties.
¿From these results we conclude that systems with shallower potential wells can be affected by tidal interactions from larger distances than those with more concentrated ones. Our findings also suggest that spatial proximity is a key factor in the strength of the star formation activity since the enhancement of SF detected for close active pairs doubled that estimated for active interacting pairs (Table 2). We found that in passive SF systems the combination of proximity and shallower potential well can be related to an important star formation activity in the recent past so that part of the currently passive star forming systems have experienced significant SF in the last 0.5 Gyr.


Finally we can estimate the fraction of stars formed in galactic systems in pairs with respect to the total stellar mass currently formed in the simulated volume. Recall that we are working with a 10 box. In this simulated volume and considering systems with stellar masses larger than , we found that pairs closer than contribute with of currently new born stars, while the total pair sample is involved in the formation of of the new stars at .
| Total Pair Sample 999Galaxy pairs with spatial separations | Merging Pairs 101010Galaxy pairs with spatial separations | Interacting Pairs 111111Galaxy pairs with spatial separations | |||||||
| Passive | Active | Passive | Active | Passive | Active | ||||
| Age121212Mean stellar age given in Gyr | 10.54 | 7.65 | 9.25 | 7.5 | 11.90 | 7.80 | |||
| 131313Mean star formation enhancement | 0.36 | 3.50 | 0.36 | 3.98 | |||||
| Gas141414Percentage of the leftover gas in galactic systems | 16 | 27 | 20 | ||||||
| 151515Central circular velocity in | 103 | 76 | 120 | 90 | |||||
3.1 Dependence on the Cosmological Parameters
Here we discuss the results obtained from our low resolution SCDM run. A similar analysis to that performed for the CDM simulation was carried out in this run, building up a galaxy pair catalog from the 3D distribution of simulated galaxies. In Fig.5 we show the mean parameter as a function of distance and relative velocity to the closest neighbour. The comparison of these trends with those found in Fig.1 and Fig. 2 yields very similar results. In fact, the orbital parameter thresholds estimated for pairs in the SCDM simulation: kpc and km s-1, are in good agreement with those obtained for systems in the CDM run.
The general agreement at one -level found between the results from these two cosmological scenarios probes that the triggering of SF activity induced by galaxy-galaxy interaction is a local physical mechanism which works independently of the cosmology (see also Section 5).


4 Analysis of the 2D Galaxy Pair Catalog
The star formation activity in the 2D galaxy pair catalog in the CDM run was analysed by using the relative projected separations and radial relative velocities .
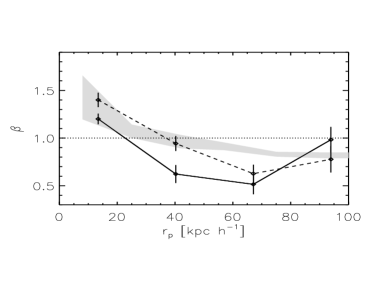
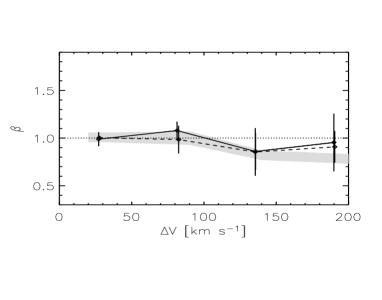
As it can be seen from Fig. 6a (solid lines), we found a clear trend for an enhancement of the star formation activity with proximity in relative separation. Comparing the trend in Fig. 6a with that in Fig. 1, we can see that the excess of star formation (i.e. ) in the 2D-GP catalog is detected for closer pairs than in the case of the 3D-GP sample. This shrinking of the projected distance threshold compared to the 3D one is produced by both geometrical projection effects and spurious pairs.
In the case of , we are looking at the component of the velocity along a random line-of-sight. This component is strongly affected by the geometrical orientation of the pair orbital plane with respect to the chosen random line-of-sight. Although this fact modifies the mean star formation activity signal, the dependence on is still present as it can be seen in Fig. 6b (solid line).
¿From this analysis we obtained that the star formation enhancement thresholds for the 2D-GP catalog are and . As we will discuss later on, these values are in very good agreement with recent observational results (Lambas et al. 2003).


4.1 Analysis of the effects of projecting galaxy pairs
When projected data is analysed, as in the 2D-GP simulated catalog or observations, some galaxies can appear as pairs when, in fact, their tridimensional relative separation could be larger than the threshold values adopted as a criteria to define pairs. Hence, a study of these effects in the simulation may help to understand their contribution to the observed trends. In this Section, we assess the spurious effects introduced by both pairs in projection which have a tridimensional relative distance larger than the adopted threshold of (spurious pairs) and the distortion produced by the projection of 3D pairs.
In the simulations, spurious pairs are removed by checking if their tridimensional relative distance is not within the adopted 3D threshold. From this analysis we obtained that their effects are more important at larger relative separations as expected. The estimated percentages of spurious pairs for the complete 2D-GP catalog (i.e. kpc and km s-1) is , while for close 2D-GP sample (i.e. kpc and km s-1) the contamination is smaller, .
These results are in agreement with previous ones (e.g. Mammon 1986; Nikolic et al. 2004). In particular, Alonso et al. (2004) estimated the percentage of spurious pairs by using the 2dFGRS mock catalog constructed by Mechán & Zandivarez (2002), finding that for the complete mock pair catalog, were spurious pairs while for the close pair one, the percentage was smaller ().
In Fig. 6, we show the dependence of the SF activity on and for the 2D-GPs catalog (solid line) and for the 2D-GPs with spurious pairs being removed (dotted line). The mixing of arbitrary values of SF by spurious pairs is expected to produce a lowering of both the star formation activity signal and the relative distance threshold . These effects can be appreciated in Fig. 6a from where we can see that, when spurious pairs are eliminated (dotted lines), an increase of and in the relative distance threshold and the star formation enhancement signals, respectively, are detected. On the other hand, by comparing the trends of the 3D-GP catalog (Fig. 1) and 2D-GP one (Fig. 6) with spurious pairs removed, we found that the effects of projection produced a decrease of the signal of star formation enhancement by and of the relative separation threshold by less than .
Our results suggest that the projection of 3D pairs seems to affect more strongly the star formation activity signal than the threshold, while spurious pairs seem to have a more important impact on the shrinking of the threshold.
4.2 Dependence of Star Formation on Environment
In this section, we focus on the effects of galaxy interactions on SF activity by taking into account their local environment in order to analyse if CDM cosmologies can reproduce the observational trends detected in different works (Gomez et al. 2003; Balogh et al. 2004; Alonso et al. 2004). For this purpose we use the simulated 2D-GP catalog discussed in previous sections and the corresponding 3D-GP sample.
In order to characterize the local environment of simulated galaxies in a similar way to that employed in observations (Dressler et al. 1980; Gomez et al. 2003; Balogh et al. 2004), we calculated the projected local density parameter as where d is the projected distance to the 6th neighbour brighter than M (we assumed a mass-to-light ratio of 5 to convert stellar masses to luminosities) and km (Balogh et al. 2004).
In Fig.7, we show the distributions of galaxies according to their local density for simulated galaxies without a near companion (a) and simulated galaxies in pairs (b), separated in two groups depending on their star formation activity: passive star-forming galaxies (solid lines) and active star-forming galaxy (dotted lines), as defined in Section 3. As we can see from Fig.7a, passive star forming simulated galaxies without a close companion dominate the higher density regions, while active SF ones prefer the lower density environments161616A stronger SF-density relation is obtained from the simulations if a more restrictive value of is used to classify systems are passive or active. Note that implies that a system is forming stars at a rate comparable to the average of the Milky Way., accordingly to the observed SFR-density relation (Gomez et al. 2003) and its analogous density-morphology relation (Dressler 1980). A similar trend is found for galaxies in pairs as it can be seen in Fig. 7b.
In order to quantify this trend, we adopt a value of to separate galaxies into low and high density regions. This value segregates the sample in two subsamples with similar number of members. ¿From Table 3 we can see that, the ratio () between the percentage of passive and active SF galaxies decreases from 3.1 in high density regions to 1.6 in low density ones for the control sample. A similar behaviour is found for simulated galaxies in pairs with varying from to from high to low density regions, respectively. We found no significant differences between the dependence of SF on environment for galaxies with or without a companion. However, if the systems are in close pairs ( kpc and 100 km s-1), the dependence of on environment is found to be stronger, changing from in low density regions to in high density ones.
In Fig. 8 we show the distribution of birthrate parameters for galaxies in pairs in low (lower panel) and high (upper panel) density regions and the distributions for their corresponding control samples. As it can be appreciated from this figure the SF activity tends to be larger in galaxies with a close companion, principally in low density regions. We computed the median () of these distributions and found that for the control and galaxy pair samples, the values increase from high to low density regions by a similar factor (1.6 and 1.7, respectively). Conversely, close pairs show a stronger dependence of this parameter on environment by changing a factor of 3 in the same density range. The parameter of close galaxy pairs in high density regions is comparable to that of the control sample () while in low density environments, the parameter of close pairs exceeds by a factor of three that of the control sample.
The important decrease in the star formation activity and the significant increase of the fraction of passive SF members from low to high density regions for galaxies in close pairs suggest that interactions play a relevant role in the origin of the SF-density relation. As shown in Section 3, passive star forming systems tend to be gas poor, to be dominated by old stellar populations and to have deep potential wells, indicating that they are in an advanced stage of evolution. In this sense the fact that in high density regions a larger fraction of galaxies in close pairs are passively forming star shows that the environment plays a role by accelerating the structure evolution as expected in hierarchical clustering scenarios where mergers and interactions are more common in high density environments.
So far we have not taken into account the effects of spurious pairs. We estimated that for the projected simulated-galaxy pairs in low density environments (i.e. kpc and km s-1), are spurious pairs while this percentage increases to in high density regions. For close pairs ( kpc and 100 km s-1), these percentages go down to and for low and high environments, respectively. If the 2G-PG catalog is cleaned up of these spurious pairs, the dependence of the star formation activity on environment remains basically unchanged. For this clean sample, we found a ratio of and in high and low density regions, respectively. These numbers are comparable to those found for the complete 2G-PG catalog (Table 3).
We have also calculated a density estimator in three dimensions as where d is now the tridimensional distance to the 6th neighbour brighter than M. As it can be seen from Fig. 9 the 3D local densities (i.e. ) of these galaxies are lower than that estimated from the projected distances (). This suggests that projected density estimators can overpredict the local density. Note however that there is a correlation between both estimators although with an important dispersion towards larger values of . It is worthnoting that our simulation corresponds to a typical field region, so that most galaxies have low with a minimum possible value at log defined by the size of the box. For the projected sample this minimun value increases to log due to projection effects.
In Fig. 10 we show similar distributions to those of Fig. 7 but as a function of . We have also estimated the fractions for these distributions taking the value to divide the samples into low and high density subsamples with comparable number of members. The fractions for these samples indicate a weaker SF-density relation for the control sample, with a variation of from to from high to low density regions, and a stronger one for galaxies in pairs, with varying from to in the same density range. Hence, overall, projection seems to weaken the role of pairs in the SF-density relation.


| Total Pair Sample 171717Galaxy pairs with spatial separations and | Close Pairs Sample181818Galaxy pairs with spatial separations and | Control Sample 191919Galaxy pairs with spatial separations | ||||||||||
| Passive 202020Passive and Active columns represent percentages normalized to the total number of members in each Total Sample. We use log to define high/density environments | Active | 212121Ratio between the percentage of passive () and active () galaxies. | Passive | Active | Passive | Active | ||||||
| Total Samples | 66 | 34 | – | 55 | 45 | – | 68 | 32 | – | |||
| High density regions | 43 | 17 | 2.53 | 37 | 18 | 2.06 | 37 | 12 | 3.08 | |||
| Low density regions | 23 | 17 | 1.35 | 18 | 27 | 0.67 | 31 | 20 | 1.55 | |||
4.3 Comparison with observations
The results discussed in previous sections lead us to conclude that even if in 2D we only considered tridimensional pairs, projection redistributes their contribution in projected distance and relative velocity bins.
In Fig. 11 we show the 2D-GPs dependence of star formation on and for the CDM (solid line) and SCDM (dashed line), including the observational trends obtained by Lambas et al. (2003) for galaxy pairs in the field. In the case of the projected radial velocity, we introduced a random noise in the simulated relations with maximum amplitude equal to two times the observational velocity error of the 2dFGRS (Coles et al. 2001) in order to make the comparison with observations more realistic. As it can be appreciated, the relations are within the observed trends, although in the case of relative separation the simulated star formation activity at larger distances is lower than the observed one. Nevertheless, we note that observations and simulations are in agreement at 1.5 level.
Since for the simulated pairs the enhancement of star formation during the interactions are produced by tidal torques, the agreement found with observations suggests that the observed correlations are produced by this mechanism and seems to be independent of cosmology.
5 Conclusions
In this paper we analysed the star formation activity in galactic systems in pairs in a CDM and in a SCDM scenarios. We also assessed effects introduced when pairs are selected from a 2D projection of the tridimensional galaxy distribution.
Our findings can be summarized as follows:
-
1.
We found that tidal interactions trigger star formation at levels higher than those statistically measured for galactic systems without a close companion, if systems are closer than 30 kpc . We did not find a clear difference between low and high velocity encounters. By comparing with results obtained with a different cosmological model, we infer that interaction-induced star formation is a generic feature whose trends do not depend strongly on cosmology.
-
2.
Our findings showed that dynamically unstable systems with shallow potential wells could experience gas inflows driven by tidal torques at earlier stages in the interaction. Conversely, stable systems need to have a closer neighbour to experience strong star formation activity. These results suggest that the combination of spatial proximity and the characteristics of the potential wells seems to be a key factor to induce strong star formation activity during an interaction.
-
3.
We also found that close systems with no SF enhancement have, on average, steep potential wells, low gas fraction and are dominated by old stars. However, some of them have shallow mass distributions and have experienced some SF activity in the near past, so that the fraction of recently formed stars anticorrelates with central circular velocity. These systems are, on average, in a more advance stage of evolution in comparison with galaxies in pairs with strong star formation activity.
-
4.
The projected simulated galaxy pair catalog showed star formation activity in very good agreement with observations. We detected that, in projected distance, systems have to be closer than kpc to show important star formation enhancement in agreement with observations.
-
5.
We found that spurious pairs represent 27 of the 2D-GP sample but this percentage decreases to for close pairs. Spurious pairs are more likely to affect high density regions ( of spurious pairs are detected in the high density regions while corresponds to the low density environments).
-
6.
The analysis of the dependence of the star formation on local density yields a relation in agreement with the observed SF-density one for both galaxies in pairs and in the control sample, with a comparable decrease in the level of SF activity and a comparable increase in the fraction of passive SF systems with increasing local density. However, these trends are significantly stronger for close pairs which suggests that, in a hierarchical clustering scenario, galaxy-galaxy interactions contribute to establish a SF-density relation.
Acknowledgements.
We are grateful to the anonymous referee for the thorough remarks and comments which importantly helped to improve this paper. The simulations were run on the Ingeld PC-cluster funded by Fundación Antorchas. This work was partially supported by the Consejo Nacional de Investigaciones Científicas y Técnicas and Fundación Antorchas.References
- (1) Alonso M.S., Tissera P.B., Coldwell G. & Lambas D.G. 2004, MNRAS, 352, 1081.
- (2) Athanassoula E., Sellwood J.A., 1986, MNRAS, 221, 213
- (3) Balogh et al., 2004, MNRAS 348, 1355.
- (4) Barnes, J. & Hernquist L., 1996, ApJ, 471, 115.
- (5) Barton E.J., Geller M.J. & Kenyon S.J., 2000, ApJ, 530, 660.
- (6) Binney J., Tremaine S., 1987, Galactic Dynamics. Princeton Univ. Press, Princeton, NJ
- Carter et al. (2001) Carter, B. J., Fabricant, D. G., Geller, M. J., Kurtz, M. J., Mclean, B. 2002, ApJ, 559, 606
- (8) Colles M.M, Dalton G., Maddox S., Sutherland W., Norberg P., et al (2dFGRS Team), 2001, MNRAS, 328, 1039.
- (9) Cora S.A., Tissera, P.B., Lambas D.G., Mosconi M.B., 2003, MNRAS, 343, 959.
- (10) Davis M., Efstathiou G., Frenk C.S. & White S., 1985, ApJ, 292, 371.
- (11) Donzelli C.J.& Pastoriza M.G., 1997, ApJS, 111, 181
- (12) Dressler A., 1980, ApJ 236, 351.
- (13) Gomez et al., 2003, ApJ 584, 210.
- (14) Kennicutt R.C., 1998, ARA&A, 36, 189
- (15) Lambas D.G, Tissera P.B., Alonso M.S. & Coldwell G. 2003, MNRAS, 346, 1189.
- (16) Larson R.B. & Tinsley B.M., 1978, ApJ, 219, 46.
- (17) Le Fèvre O. et al., 2000, MNRAS, 311, 565.
- (18) Mamon G.A., 1986, ApJ, 307, 436.
- (19) Martinet L., 1995, Fund. Cosmic Phys., 15, 341
- (20) Merchán M. & Zandivarez A., 2002, MNRAS, 335, 216.
- (21) Mihos J.C. & Hernquist L., 1996, ApJ, 464, 641.
- (22) Mihos, C., Clusters of Galaxies: Probes of Cosmological Structure and Galaxy Evolution, from the Carnegie Observatories Centennial Symposia. Published by Cambridge University Press, as part of the Carnegie Observatories Astrophysics Series. Edited by J.S. Mulchaey, A. Dressler, and A. Oemler, 2004, p. 278.
- (23) Mo H.J., Mao S., White S.D.M., 1998, MNRAS, 295, 319
- (24) Mosconi M.B., Tissera P.B., Lambas D.G.& Cora S.A., 2001, MNRAS, 325, 34.
- (25) Navarro J.F. & White S.D.M., 1994, MNRAS 267, 401.
- (26) Nikolic B., Cullen H., Alexander P., 2004, MNRAS 355, 874.
- (27) Patton D.R, Pritchet C.J, Carlberg R.G, Marzke R.O, Yee H.K. et al, 2002, ApJ, 565, 208.
- (28) Scannapieco C., Tissera P.B, White S.D.M. & Springel V. 2005, MNRAS, accepted (astro-ph/0505440).
- (29) Tissera P.B., 2000, ApJ, 534, 636.
- (30) Tissera P.B., Lambas D.G., Mosconi M.B., Cora S., 2001, ApJ, 557, 527.
- (31) Tissera P.B., Domínguez-Teneiro R., Scannapieco C.& Sáiz A., 2002, MNRAS, 333, 327.
- (32) Toomre, A., 1976, BAAS, 8, 354T.