Slow and fast components in the X-ray light curves of Gamma-Ray Bursts
Gamma-ray burst light curves show quite different patterns: from very simple to extremely complex. We present a temporal and spectral study of the light curves in three energy bands (2–5, 5–10, 10–26 keV) of ten GRBs detected by the Wide Field Cameras on board BeppoSAX. For some events the time profiles are characterized by peaks superposed on a slowly evolving pedestal, which in some cases becomes less apparent at higher energies. We describe this behaviour with the presence of two components (slow and fast) having different variability time scales. We modelled the time evolution of slow components by means of an analytical function able to describe asymmetric rising and decaying profiles. The residual light curves, after the subtraction of the slow components, generally show structures more similar to the original curves in the highest energy band. Spectral study of these two components was performed evaluating their hardness ratios, used also to derive photon indices. Slow components are found generally softer than the fast ones suggesting that their origin is likely different. Being typical photon indices lower than those of the afterglows there is no evidence that the emission processes are similar. Another interesting possibility is that slow components can be related to the presence of a hot photosphere having a thermal spectrum with around a few keV superposed to a rapid variable non-thermal emission of the fast component.
Key Words.:
X rays: bursts - gamma rays: bursts1 Introduction
Light curves (hereafter LC) of Gamma-ray Bursts (GRB) are characterized by a large variety of shapes: they can be very simple with a unique prominent peak or extremely complex with several peaks having different durations, heights and spectra. These particular behaviours have been extensively studied looking for possible relations between different parameters of the LCs (see Fenimore et al. 1995, Norris et al. 2000, Reichart et al. 2001). The majority of GRBs has been detected at photon energies higher than about 30 keV, and only a relatively small set of data in the energy band of a few keV is available. In particular the two Wide Field Cameras (WFC) (Jager et al. 1997), on board the satellite BeppoSAX (Boella et al. 1997), detected several events in the energy range 2–26 keV and provided some detailed X-ray LCs of the prompt emission. Their shapes confirm the large variability with the energy and the different spectral properties of the various substructures. These differences become more relevant when comparing the shape of the X-ray curve of a burst with that observed in the low energy -rays either by the BeppoSAX Gamma-Ray Burst Monitor (GRBM) (Frontera et al. 1997) or by BATSE (Fishman et al. 1985).
A seminal work on BATSE LCs was done by Norris et al. (1996) who deconvolved the temporal profiles of 46 GRBs into pulses using a model-dependent, least squared pulse fitting algorithm in four energy bands from 25 keV to 1 MeV. Their basic assumption was that structured burst emission is the superposition of a series of individual pulses. Using a pulse model characterised by separate rise and decay time constants and a sharpness peak parameter Norris et al. (1996) found different trends of pulse shape with energy. They found that the widths of individual pulses have a power law dependence on energy consistent with the result by Fenimore et al. (1995). Furthermore, they examined the pulse shape dependence on energy and introduced the following ’pulse paradigm’ between pulse asymmetry, width and spectral softening: among pulses, with relatively well defined shapes, a decreasing rise-to-decay ratio corresponds, for lowering energies, to wider and more asymmetric shapes with the pulse centroid shifted at later times. These results are relevant because they can lead to major understanding of the physics of GRBs. However, Norris et al. (1996) succeeded in deconvolving 41 light curves in different pulses while the fits were not successful for 5 GRBs. In fact, LCs of these GRBs, especially in the lowest energy range (25–55 keV), seemed to be composed by several pulses superposed on the top of a broader, smooth component.
A direct inspection of the LCs of GRBs detected in the WFCs shows that in some of them the lowest level of the count rate, from which narrow peaks are emerging, is significantly higher than the average background level during the entire duration of the burst. For several GRBs the amplitude of this effect decreases at higher energies, although in a few cases it is increasing or remains stable. This particular structure of the X-ray LCs of bright GRBs suggests the possibility that the time evolution of the events can be described in terms of two components: one showing the rapid evolving peaks and spikes and the other with a much longer typical time scale of the order of several tens of seconds. The occurrence of an underlying X-ray component with a spectral distribution softer than the mean prompt emission has also been recently pointed out by Vanderspek et al. (2004) for GRB 030329 observed by (Shirasaki et al. 1999). We will show in the present paper, based on an analysis of the BeppoSAX WFC observations, that this is not a unique case but there are several GRBs with a similar behaviour. Likely, these events constitute a GRB subclass whose main characteristics must be investigated.
| GRB | Duration | X-Peak Flux(a) | -Peak Flux(a) | afterglow | |||
| h m s | ∘ ′ ′′ | s | 10-7erg cm-2 | 10-7erg cm-2 | |||
| GRB 980519 | 23 22 15 | +77 15 00 | 250 | 0.51 | 13 | X-O-Radio | |
| GRB 990704 | 12 19 30 | 03 48.2 | 30 | 1.0 | 1.8 | X | |
| GRB 001011 | 18 23 4.6 | 50 54 16 | 50 | 0.07 | 25 | O | |
| GRB 001109 | 18 30 02 | +55 18.4 | 100 | 0.22 | 4.2 | X | |
| GRB 010222 | 14 52 12.55 | +43 01 6.3 | 200 | 2.1 | 86 | 1.47 | X-O |
| GRB 010412 | 19 23 36 | +13 37 | 100 | 0.46 | 17 | ||
| GRB 990123 | 15 25 30.6 | +44 46 00 | 70 | 0.5 | 170 | 1.6 | X-O |
| GRB 990705 | 05 09 52 | 72 08 00 | 50 | 0.85 | 37 | 0.843 | X-O |
| GRB 990908 | 06 53 | 75 | 150 | 0.17 | 1.0 | ||
| GRB 000528 | 10 45 24 | 34 00 | 130 | 0.21 | 14 | X |
: (Frontera 2004) : No follow-up performed with BeppoSAX NFI
Using the WFC database, containing data on 56 GRBs, we derived the LCs in three energy bands and selected those showing a presence of a possible component evolving over the entire duration of the burst. In the following we will refer to it as Slow Component (shortly SC), while the residual prompt emission structure, often characterised by a series of short duration peaks will be indicated as Fast Component (FC), and the original light curve will be indicated as OR. This approach is not in contrast with that of Norris et al. (1996). In fact, they are just two different points of view: our attention is focused on the broad and smooth structures relevant in the X-ray energy range, while their work is centred on the modelling of the fast and spiky features in the -ray band. We found that about one third of the database shows a possible SC while 13 GRBs have light curves too faint to tell something about.
In this paper we present the results on ten GRBs for which it is possible to distinguish the two components. These events were selected to have a representative sample of different types of SCs. LCs and other data on the remaining GRBs in the WFC database will be described in subsequent paper.
We used a simple analytical model to describe the time evolution of the SCs and to derive their main temporal and spectral properties. We found that spectral properties of SC and FC of the same GRB are not generally the same suggesting different emission processes. We also searched for possible connections between the SCs and the subsequent X-ray afterglow emission and discuss some possible physical scenarios to understand the origin of this phenomenology. In particular, we speculate that SC can be related to an outflow photosphere, early proposed by Mészáros, Laguna & Rees (1993) and developed by Mészáros & Rees (2000), Mészáros et al. (2002), Rees & Mészáros (2005). The result of our spectral analysis suggest that several SCs have softening spectra, likely associated with a thermal emission.
2 Observations and data reduction
All the data analysed in this work were taken with the two WFCs on board the BeppoSAX satellite. Each WFC is a multi-wire proportional counter with an open area of 2525 cm2 and a coded mask in the field of view allows to obtain images of the sky (Jager et al. 1997). The transparency of the mask is 33% and the flux is limited by a collimator with no flat field. The effective area is 140 cm2 in the centre of the field of view. Most GRBs were observed with an effective area of a few tens of cm2. There are two different ways to extract a LC from WFC data:
-
•
considering the whole detector image and deconvolving it using the mask response function with an implicit background subtraction
-
•
selecting just the region of the detector concerned with the burst, without subtracting the background component (i.e. excluding the pixels occulted by the collimator).
The former way gives LCs without the background, while the latter gives LCs in which counts are distributed according to Poisson statistics. It is important to note that generally the integrated count rate of instrumental background is 130 counts/s and it is due to the cosmic X-ray background and undetected sources for almost 85%. In some regions of the sky rich in X-ray sources, like the Galactic Centre or Cygnus, this value can even double. Furthermore, the burst’s counts depend not only on the incident spectrum but also on the mask transparency, the detector efficiency and on the burst position in the field of view. For this reason we decided to use the former way of LC extraction to have a more controlled background subtraction, in particular when a bright source is in the field of view. For the majority of the events considered in this work the count rate was much above the background one so that its subtraction was straightforward and did not affect the burst’s light curve.
For each burst we created LCs in three energy bands: 2–5, 5–10, 10–26 keV, selected to have approximately the same number of counts in each band for a typical GRB. The bin integration time was generally 0.5 s, but for few bursts with a low S/N ratio a bin time of 1 s was used. The main properties of the 10 GRBs considered in the present paper are given in Table 1.
2.1 Spectral analysis
The evaluation of spectral properties of SCs is limited by the three energy bands used. The simplest way to obtain useful information is to compute the Hardness Ratios (hereafter HR) between the various bands which were used to estimate a photon index by convolving a power law input spectrum with the WFC response matrix in the GRB direction. Using the counts in two selected bands we evaluated the expected HR from a set of spectra with photon indices assigned in a given range simulated by means the XSPEC code (Arnaud et al. 1996). In this way we obtained a relationship between and the HR, from which we could find the photon index corresponding to the observed HR. We calculated the values of HR and for the original (OR) LCs and for both the FC and SC of all GRBs. Hereafter we will indicate with the HR between 5–10 keV and 2–5 keV energy range and with the HR between 10–26 keV and 5–10 keV, the corresponding photon indices are indicated as and , respectively. Statistical uncertainties were computed by propagating the 1 errors on HRs with the usual quadratic formulae. When working with time integrated LC, the number of counts is high and the resulting errors are generally smaller than those obtained by spectral best fits over several energy bins. Reported photon indices must therefore be considered as a quantitative indication of the mean spectral behaviour in the WFC range.
3 Slow component modelling
There is no direct (and unambiguous) way to separate SC and FC in a X-ray LC of a GRB. We therefore applied a simple heuristic approach and modeled the SC by means of the following analytical formula containing only a small number of parameters:
| (1) |
where is the time dependent number of counts in the energy band (hereafter we use =1, 2, 3 for the lowest, mid and highest energy bands specified in Sect. 2, respectively), is the amplitude of the SC in the considered energy band, and the values of remaining shape parameters , and were chosen by interpolating the local minima of the LC in the band where the SC was more apparent. Parameters’ uncertainties cannot be evaluated in a simple way because they were not found by means of a statistical regression. For the GRBs with a high S/N ratio, however, we tried to obtain an indicative range for the parameters by fitting our SC model to those data points for which a zero residual is expected. Typically , we obtained good and the percent errors were 20%.
An advantage of Eq. (1) is the possibility to represent rising and decaying sections having different time scales with a unique smooth function. We are aware that this description of SCs is somewhat arbitrary and that the values of the involved parameters cannot be estimated on the basis of a statistical method. The main fact is that there is no ‘a priori’ information on possible physical models of GRBs producing a SC and on its spectral and temporal evolution. The simple approach followed by us should be therefore considered a first tool to distinguish phenomena characterised by different time scales in the prompt emission LCs.
In most cases we found that the assumption of the energy independence of the time evolution of the SC was substantially confirmed, and in only two cases an energy dependent time evolution was needed. We discuss these cases when presenting the results on individual bursts. We found also that some possible residuals of a SC are apparent only in a small number of LCs and, when present, these residuals are generally small indicating that a substantial fraction of SC was actually subtracted. In the majority of cases SCs are soft and quite small or unapparent in the highest energy band, however, for about one third of the studied GRBs the SCs is growing from 2–5 keV to 5–10 keV and to 10–26 keV. In the next section we describe in detail the LCs and the SCs of all the GRBs.
Residual FCs were obtained by subtracting the SCs from the original data sets:
| (2) |
where is the original LC, the fast component, and is the ratio between the amplitudes for the energy bands and (usually ), where parameters were estimated; is a possible time delay between the SCs at different energies: it was taken different from zero only for GRB~000528. A useful check ‘a posteriori’ of our modelling was done by comparing the FC light curves of the same GRB at different energies resulting with very similar profiles. In only one case, we did not obtain an acceptable model and we had to model it using the sum of two curves like Eq. (1) shifted in time.
| GRB | (s) | ||||||
| GRB 980519 | 5.0 | 5.9 | 0.10 | 1 | 0.60 | 60.84 | |
| GRB 990704 | 2.15 | 0 | 1.2e-4 | 3.7 | 1.3 | ||
| 1.6 | 0 | 4e-4 | 3.7 | 3.3 | |||
| GRB 001011 | 6.0 | 4.9 | 0.12 | 1 | 0.67 | 10.8 | |
| GRB 001109 | 4.0 | 5.4 | 0.12 | 1 | 0.75 | 10.41 | |
| GRB 010222 | 1.83 | 3.45 | 0.0878 | 0.95 | 0.80 | 163.6 | |
| GRB 010412 | 2.5 | 4.9 | 0.10 | 1 | 0.80 | 15.58 | |
| GRB 990123 | 2.8 | 4 | 0.112 | 1 | 1 | 1 | 32.0 |
| 8.8 | 3.05 | 0.085 | 1.07 | 1.125 | 0.82 | 0 | |
| GRB 990705 | 0.5 | 7.9 | 0.2 | 1 | 1.4 | 1.7 | 45.58 |
| GRB 990908 | 0.7 | 6.4 | 0.10 | 1 | 0.86 | 0.5 | 50.0 |
| GRB 000528 | 8.0 | 5.8 | 0.11 | 1 | 2 | 2 | 30.598 |
– Values for the 5–10 keV SC.
It is known that GRB peaks tend to be broader at lower energies. This effect was studied at first by Fishman et al. (1992) who noticed that individual peaks frequently are narrower and better defined at higher energies. After Link, Epstein, & Priedhorsky (1993) showed that this is a prevalent property of most bursts and Fenimore et al. (1995), using the average autocorrelation function and the average pulse width, showed there is a well defined relationship between the latter and the energy:
| (3) |
where is the FWHM of each individual peak. This result was in agreement with the theoretical expectations of the shock emission model (Tavani 1996) and with the pulse modelling by Norris et al. (1996). A possible consequence of this low energy broadening is that peaks with a small time separation can blend together and produce an apparent underlying pedestal evolving on a longer time scale. As discussed in Sect. 6 we verified that the SC is not originated by this effect.
We also analyzed the distribution of the power on the various time scales of the SCs and FCs of a couple of GRBs having a high S/N ratio by means of wavelet analysis. This method provides useful information on the power distribution of the signals in the various time scales from those of the narrowest spikes to the entire duration of the prompt emission. Moreover, it can also be used to compare the power distributions between the original LCs and their components. Standard wavelet analysis is based on the computation of Wavelet Power Spectra defined as the normalised square of the modulus of the wavelet transform:
| (4) |
where
| (5) |
with the sampling time of the series , the complex conjugate of the wavelet function, a normalisation factor and the time scale. For a brief and practical introduction to wavelet analysis and its computation we refer to Torrence and Compo (1998) while for application to astrophysical data to the recent paper by Lachowicz and Czerny (2005).
In our analysis we adopted the DOG2 wavelet (second Derivative of a Gaussian, also known as Mexican Hat or Marr wavelet) which gives a good description of the scale of individual pulses. To have a more representative picture of the signal strength distribution over the various time scale we preferred to plot instead of only the positive values of . In this way we excluded from the power distribution all the time intervals where the negative wings of the DOG2 wavelet are in anticorrelation with the signal. In the following we will refer to these plots as Wavelet Positive Amplitude Spectra (WPAS).
![[Uncaptioned image]](/html/astro-ph/0510314/assets/x1.png)
|
![[Uncaptioned image]](/html/astro-ph/0510314/assets/x2.png)
|
|
|
|
4 Description of individual GRB
As written above the GRBs analysed in this work can be divided in two groups characterised by the presence or not of a SC in the highest energy band (10–26 keV), hereafter named hard and soft SC, respectively. In the case of GRB~010222, however, we cannot exclude that a SC is marginally detectable in the highest energy range. This burst was one of the brightest recorded events and it is possible that the SC appearance is due to the high S/N ratio. Although its behaviour is intermediate between soft and hard SC GRBs we classified it in the former type because the SC in the 10–26 keV range, if present, must be much lower than below 10 keV. In the next subsections we describe the analysis done for each burst, considering first those without an apparent 10–26 keV SC.
4.1 GRBs with soft Slow Components
4.1.1 GRB~980519
GRB 980519 was detected on 1998 May 19, 12:20:13 UT by CGRO-BATSE and BeppoSAX-GRBM. It was in the field of view of the BeppoSAX-WFC 2, allowing an estimate of its position within a 3′ error circle (Piro 1998). Jaunsen et al. (1998) detected in the WFC error box a fading optical counterpart in and bands 8.8 h after the burst (see also Djorgovski et al. 1998, Hjorth et al. 1999a). A fading X-ray afterglow was detected 9.7 h after the burst with the Narrow-Field Instruments (NFI) on BeppoSAX (Nicastro et al. 1998).
The LC at 2–5 keV (Fig. 2, upper left panel) is characterised by a prominent peak at about the centre of the prompt emission and by some others of smaller amplitude before and after the main peak. The time structure of the evolving SC is not simple: it is detectable in the 2–5 keV data, but at 5–10 keV is less apparent and it is undetectable at 10–26 keV. The values of the parameters of Eq. (1) were therefore estimated from the 2–5 keV LC and then we subtracted the resulting SC from the original one to derive the FC. The 5-10 keV SC was obtained by a simple amplitude scaling. The SC parameters are given in Table 2, and the fraction of counts is reported in Table 3.
The comparison of the LC at 10–26 keV with the FCs shows that they really look alike indicating that the SCs modelling is acceptable (Fig. 2 lower right panel). We cannot exclude, however, that SC may be more complex and structured. Note that above 10 keV only the central peak is clearly apparent, indicating that it has a spectrum harder than the other features, which at these energies are practically absent. A soft SC could not consist of only a simple and regular profile and can be due to a couple of features, one before and the other after the main peak. In this case the fractions of counts in Table 3 should be properly considered as lower limits to the actual SC content.
![[Uncaptioned image]](/html/astro-ph/0510314/assets/x3.png)
|
![[Uncaptioned image]](/html/astro-ph/0510314/assets/x4.png)
|
|
|
|
![[Uncaptioned image]](/html/astro-ph/0510314/assets/x5.png)
|
![[Uncaptioned image]](/html/astro-ph/0510314/assets/x6.png)
|
|
|
|
4.1.2 GRB~990704
On July 4, 1999 a GRB was detected by the BeppoSAX GRBM and WFC and its position was given with a 7′ error radius (Heise et al. 1999a). A NFI observation, 8 hours after the burst, revealed an X-ray afterglow (Feroci et al. 2001). The X-ray emission shows a well apparent SC with some peaks superposed, (Fig. 2). This is a very interesting event being the most X-ray rich BeppoSAX GRB: it is well apparent at 2–26 keV but only the highest peak is significantly detectable at 40–700 keV (Fig. 4). The ratio of fluences in the WFC and GRBM instrumental ranges is (Feroci et al. 2001): the largest value found in the BeppoSAX sample if we consider X-Ray Flashes as a separate class. The duration of the event is strongly energy dependent, ranging from 30 s in 2-5 keV to less than 20 s in the 40–700 keV energy range.
SC parameters were estimated from the 2–5 keV LC but, after scaling the amplitude, we could not match the signal at 5–10 keV, because of the shorter duration. To find a curve able to model the SC we considered first Eq. (1) and found a satisfactory result only considering a symmetric curve (i.e. ):
| (6) |
where and were energy dependent to take into account the change of SC profile. The comparison of the FCs with the light curve at 10–26 keV shows a good accordance (Fig. 2).
![[Uncaptioned image]](/html/astro-ph/0510314/assets/x7.png)
|
![[Uncaptioned image]](/html/astro-ph/0510314/assets/x8.png)
|
|
|
|
A useful description of the power distribution over the various time scales can be obtained from wavelet analysis. We computed WPAS for all the LCs and their components. These are shown in Fig. 6 (2–5 keV), Fig. 6 (5–10 keV) and Fig. 4 (10–26 keV): note that while in the WPAS of the original data set (top panels) the power contribution from narrow peaks (on time scales of a few seconds) is much less apparent than that on longer times, being the signal dominated by SC, the WPAS of FC (bottom panels) show clearly an enhanced relative power from these features and compare well with the WPAS of the high energy curve. In particular, the WPAS in Fig. 4 shows how the power on time scales shorter than 5 s is concentrated only in four features. The two strongest central peaks are also present in the WPAS of the original LC at lower energies (Figs. 5 and 6), while the others become evident only in the WPAS of FCs. Note also that there is no significant feature with a time scale between 10 and 30 seconds.
The complex time profile of this GRB is worthy of a more detailed analysis. Note first that the FC duration in the lowest energy range (Fig. 2, upper right panel) is comparable to those in other ranges (see also the WPAS in Figs. 5, 6). This implies that the longer duration measured at 2–5 keV is essentially due to the SC. Furthermore, it is clearly visible that the width of single peaks decreases at higher energies and this effect continues to be apparent even after the subtraction of the SC. We verified it for the main peak of the FC (the highest at 5–10 keV) and found that it agrees with Eq. (3). We estimated for the two more prominent peaks the FWHM and found 3.5 s, 2.7 s and 1.9 s and their ratios, when considering the central energies of our bands (i.e. 3.5, 7.5, 18 keV)
| (7) |
as expected from Eq. (3).
In summary, when comparing the OR and the FC we find a similar energy behaviour of the main peaks, while the total prompt event duration is totally different. This finding implies that the SC subtraction does not modify the energy behaviour of the main features of the prompt event because the SC seems to be responsible only of the longer duration of the entire OR. This is clearly visible in Fig. 2 where the durations of the FC in all the three energy bands are just like that of the OR at 10-26 keV.
As noticed above, the SC duration is also dependent on energy and in the 5-10 keV band it is significantly shorter than at 2-5 keV. Considering the FWHM of their time profiles (20.7 s and 15.7 s at 2-5 keV and 5-10 keV, respectively) as indicative of this difference we verified whether their ratio agrees with Eq. (7). The resulting value of 1.41 is indeed very close to that derived from the corresponding energies as in the case of the peaks of the FC.
Though on different timescales, there is a common energy dependence between the SC and the features of the OR. However it is still unclear what physics causes Fenimore’s relationship, so it is unclear how we can explain this partial similarity. Anyway, it is important to underline that this is the only burst to show this behaviour and it is an outstanding burst also for other properties.
4.1.3 GRB~001011
This GRB was detected on 2000 October 11 at 15:54:50 UT by the GRBM and WFC2 and localized with an accuracy of 5′ (Gandolfi et al. 2000a). About 8 hours after the trigger, optical ( band) and near infrared ( and bands) observations were performed at the 1.54m Danish Telescope and the 3.58m New Technology Telescope, respectively, both at ESO, La Silla, and led to the discovery of a counterpart (Gorosabel et al. 2000, 2002).
WFC LCs have changing profiles at different energies. In the 10–26 keV the time evolution is a typical FRED (Fast Rise Exponential Decay) with a decay time of 15.0 s. In the 2–5 keV range it shows instead a more stable level, having an approximate e-folding time 44.8 s, with some narrow peaks superposed.
![[Uncaptioned image]](/html/astro-ph/0510314/assets/x9.png)
|
![[Uncaptioned image]](/html/astro-ph/0510314/assets/x10.png)
|
|
|
|
![[Uncaptioned image]](/html/astro-ph/0510314/assets/x11.png)
|
![[Uncaptioned image]](/html/astro-ph/0510314/assets/x12.png)
|
|
|
|
In this case it was not easy to find the right curve to represent the SC. A possible model (2–5 keV) is shown in the upper panel (left side) of Fig. 8: it is nearly symmetric with a rather mild rising portion followed by a slower decay. As before, the SC at 5-10 keV has a smaller amplitude, a decay time 23.5 s, while it disappears at 10-26 keV (Fig. 8, right panels). We used the 2-5 keV LC to estimate the parameters of the SC and the resulting FC is plotted in the same figure (upper panel, right side), which has practically the same decay time of the original LC. We fitted the same SC function to the 5–10 keV LC, changing only the normalization, and found a decay time of the FC equal to 18.1 s, well comparable with that derived for the 10-26 keV curve (Fig. 8, left panels). Taking into account these differences in the decay times of the LCs above 5 keV with respect to that at lower energies, we cannot exclude that the SC has a very soft spectrum that makes it apparent only in the 2–5 keV LC.
4.1.4 GRB~001109
On November 09, 09:23:17 UT this GRB was detected by the GRBM and WFC1 with a refined position uncertainty of 2.5′ (Gandolfi et al. 2000b,c). The NFI X-ray follow up showed a previously unknown source (Amati et al. 2000a). Other observations in the radio (Taylor et al. 2000, Berger & Frail 2001a) and in the optical-near infrared (Castro Cerón et al. 2004) showed sources which could not be related with GRB~001109.
The 2–5 keV LC (Fig. 8, upper left panel) is characterised by a prominent peak about at the beginning of the prompt emission followed by others of smaller amplitudes. All these peaks are superposed on a small amplitude SC, which is further reduced at 5–10 keV and undetectable at 10–26 keV. As before we estimated the SC parameters from the low energy LC and the amplitude was scaled to derive the SC at 5–10 keV. As in other cases we found a good accordance between the 10–26 keV LC and the estimated FCs at 2–5 keV and 5–10 keV (Fig. 8, right panels). Note, however, that together with GRB~980519 the SC of this burst has a low fractional content. Furthermore, it shows a prominent symmetric initial peak whose FWHM is clearly increasing with energy.
4.1.5 GRB~010222
GRB 010222 was detected on 2001 February 22 at 07:22:34.9 UT by GRBM and WFC1 and its position was determined with an accuracy of 2′.5 (Piro 2001a). Only 3.2 h after the burst an alert message was distributed so follow-up observations were performed very quickly. The discoveries of an optical and radio counterparts were announced 4.4 h after the burst (Henden 2001a, 2001b) and 7.7 h (Berger & Frail 2001b), respectively. Other detections followed in the band (Stanek et al. 2001a), near-infrared (Di Paola et al. 2001), and at sub-mm wavelengths (Fich et al. 2001).
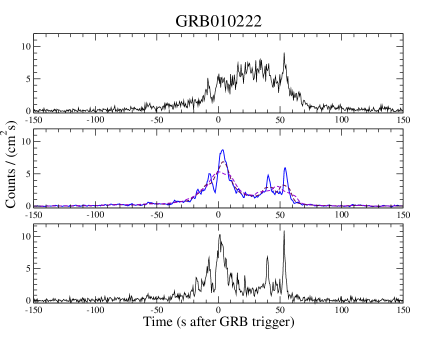
GRB~010222 is a very strong burst and the count rates in all the X-ray bands are a factor of about four higher than for other GRBs. The isotropic energy output was estimated =(154.217)1052 erg (Amati et al. 2002) at a redshift = 1.477 (Stanek et al 2001b). The 2–5 keV LC shows several peaks superposed on an evolving SC which at 5–10 keV has a comparable amplitude and it is strongly reduced at 10-26 keV. Likely, an SC in this energy band would not be apparent if the count rate had a S/N ratio like those of other GRBs.
The time profile of SC is anomalous with respect other GRBs because it has a slow rise followed by a faster decay. We then preferred to swap in time the model equation:
| (8) |
where s. SC parameters were estimated from the 2–5 keV LC and the same function was used to fit the SC at higher energies leaving free only the normalization. The resulting FCs are shown in the right panels of Fig. 10 and present similar structures indicating that SC was well modeled.
Also for this GRB we studied the time structure of LCs by means of wavelet analysis and the WPAS confirm the components’ behaviour. Fig. 10 shows that before the subtraction of the SC the power on long time scales was not symmetrically distributed with respect to the central time of the 2–5 keV LC. This effect is due to the SC which has the maximum at about = 30 s, starting from the trigger instant. After the SC subtraction the power of the resulting FC does not continue to show this asymmetry and the power content on much shorter time scales is clearly apparent. WPAS of the FCs at 5–10 and 10–26 keV (Fig. 12, 12) looks nearly identical with a series of features proceeded by the narrow peaks. In particular, note also for this GRB, the lack of power on time scales longer than 5 s in the central portion of the GRB.
Finally, it is important to note that for this burst the SC is much longer than FC, particularly on the leading side and this is clearly apparent in the LCs of Fig. 10: the series of narrow peaks of the FC starts about 20 s before the trigger time, while the smooth increase of the SC begins about 90 s before.
4.1.6 GRB~010412
This GRB was detected on 2001, April 12 at 21:46 UT by the GRBM and WFC1 (Piro 2001b). There was no follow-up observation with BeppoSAXNFI was scheduled due to an ongoing TOO. No previous analysis and information on a possible afterglow can be found in the literature.
The LCs of this event are characterised by two main peaks at the beginning and the end of the prompt emission with several smaller and narrower peaks between them. A SC is present in the 2–5 and 5–10 keV curves but it not apparent at higher energies. Also in this case we estimated the SC from the lowest energy data and found a satisfactory agreement between the resulting FCs with the LC in the highest energy band (Fig. 14). A residual SC with a very small amplitude can be seen at 10–26 keV, but it could be an artifact due to peak blending.
![[Uncaptioned image]](/html/astro-ph/0510314/assets/x13.png)
|
![[Uncaptioned image]](/html/astro-ph/0510314/assets/x14.png)
|
|
|
|
4.2 GRBs with hard Slow Components
4.2.1 GRB~990123
GRB~990123 was detected by WFC1 on January 23 at 09:47:13.9 UT. It is the only burst whose prompt emission was detected in X- and -ray bands and also in the optical (Akerlof et al. 1999a, 1999b, Feroci et al. 1999). Its afterglow was followed in the X rays (Heise et al. 1999b), optical (Odewahn et al. 1999), and radio (Frail et al. 1999) after the rapid localization (Piro et al. 1999a, 1999b, 1999c) so that its spectrum and evolution were extensively studied (Galama et al. 1999a, Fruchter et al. 1999, Kulkarni et al. 1999a, Sari & Piran 1999, Corsi et al. 2005).
Optical observations began with the ROTSE-I telephoto array while the -ray event was still in progress: the optical transient (OT) reached a peak about 32 s after the start of the burst with 8.9 mag (Akerlof & McKay 1999). Within hours, spectroscopy revealed metal absorption lines in the spectrum of the OT at = 1.60 (Kelson et al. 1999; Hjorth et al. 1999a). This was followed by a detection of a strong unusual radio flare from the same source (Kulkarni et al. 1999; Galama et al. 1999).
![[Uncaptioned image]](/html/astro-ph/0510314/assets/x15.png)
|
![[Uncaptioned image]](/html/astro-ph/0510314/assets/x16.png)
|
|
|
|
GRB~990123 is the strongest burst detected by the WFCs with the isotropic energy output = (27832) 1052 erg (Amati et al. 2002). The 2–5 keV LC is characterized by the presence of a relevant SC with a growing amplitude at 5-10 keV and at 10-26 keV (Fig. 14). We were not able to model an acceptable SC pattern using only Eq. (2) and reached a satisfactory result considering the sum of two similar functions. The parameters’ values for the two model functions are given separately in the two lines in Table 2. Note that the WFC light curves are not complete because the burst direction was obscured by Earth atmosphere and, consequently, the evolution of the X-ray SC in the last part of the event is unknown.
This complex SC modelling required different amplitude ratios for the two functions. We preferred to change only the amplitude of the second function, which varied of about 15%, and to keep that of the first function constant, although it could be increasing at higher energies. Another problem in the SC modelling arises from the different spectra of short peaks. For instance, there is a strong peak at the beginning of the prompt emission which becomes more apparent at higher energies, whereas the spike at s, well visible at 2–5 keV is smaller and broader at 5–10 keV and practically disappears above 10 keV. Note that this behaviour is opposite to that of the typical peak described by the Eq. (3).
Time resolved X-ray spectroscopy of this GRB was recently performed by Corsi et al. (2005) without a distinction between possible slow and fast components . These authors find that spectra cannot be well represented by a single simple law from the optical to X and rays and suggest that emission mechanisms working at low and high frequencies may be different (see also Vestrand et al. 2005). We will discuss better this result in Sect. 5.
4.2.2 GRB~990705
It was detected by GRBM and WFC on July 5, 1999 at 16:01:25 (Celidonio et al. 1999). It is the second brightest in -rays (40–700 keV) after GRB 990123 and ranks in the top 15% in X-rays (2–26 keV). Optical and near-infrared observations of the GRB 990705 location led to the discovery of a reddened fading counterpart and a possible host galaxy (Masetti et al. 2000). Holland et al. (2000) have imaged the GRB~990705 field with the Hubble Space Telescope, detecting a spiral galaxy at the GRB position: although the distance of this galaxy is not known, its size and brightness were found compatible with a redshift 1. A redshift estimate at has been derived by Amati et al. (2000b) from an absorption edge in the X-ray spectrum. GRB~990705 is characterised by an isotropic energy output = (3.50.15)1053 erg (Amati et al. 2002).
The X-ray LCs of GRB~990705 suggest the presence of a SC whose amplitude is increasing with energy. We applied to them our standard analysis using Eq. (1) and and obtained a nearly symmetric SC whose amplitude ratios confirm its hard spectrum (Table 2). Fig. 16 shows the X-ray curves of SCs and of the resulting FCs. The latters show only one large feature at the beginning of the burst followed by a series of much narrower peaks.
4.2.3 GRB~990908
This GRB was detected on September 8, 1999 at 00:18 UT by GRBM and WFC instruments with a position accuracy of 8′ (Piro et al. 1999d). No subsequent BeppoSAX observation was performed, because the follow-up of GRB~990907 was still ongoing and, therefore no information on a possible afterglow is available. There are no published data on this GRB. The average count rate is lower than other bursts and LCs appear noisy: their similar shapes in the three bands indicate that SC is dominating over the entire duration of about 150 s (Fig. 16). Only a few narrow peaks are barely detectable at the beginning and at the end of LCs indicating that FCs are much weaker than other GRBs, if present at all. The 2–5 keV SC has quite similar rise and decay times, whereas at higher energies the latter seems shorter. To reproduce this behaviour we inverted the time direction in the standard SC modelling. Parameters were evaluated from the 5–10 keV LC and then the same function was adapted to the other bands. The result is acceptable although it is not very precise as apparent from the residual FCs shown in Fig. 16 (left panels).
| GRB | ||||||||
| ct/cm2 | ct/cm2 | ct/cm2 | ct/cm2 | |||||
| GRB 980519 | 87.2 | 0.27 | 81.7 | 0.17 | 51.9 | 216.3 | (0.17) | |
| GRB 990704 | 66.7 | 0.66 | 53.2 | 0.45 | 26.6 | 146.5 | (0.46) | |
| GRB 001011 | 24.9 | 0.62 | 27.6 | 0.37 | 21.0 | 73.5 | (0.35) | |
| GRB 001109 | 25.9 | 0.28 | 26.6 | 0.20 | 20.4 | 72.9 | (0.17) | |
| GRB 010222 | 441.6 | 0.57 | 392.3 | 0.52 | 277.9 | 0.25 | 1111.8 | 0.47 |
| GRB 010412 | 61.9 | 0.31 | 71.7 | 0.21 | 64.1 | 197.7 | (0.17) | |
| GRB 990123 | 104.3 | 0.67 | 140.3 | 0.53 | 132.8 | 0.48 | 377.4 | 0.56 |
| GRB 990705 | 56.2 | 0.46 | 82.5 | 0.44 | 109.1 | 0.41 | 247.8 | 0.43 |
| GRB 990908 | 46.4 | 0.72 | 42.4 | 0.77 | 24.4 | 0.86 | 113.2 | 0.77 |
| GRB 000528 | 22.7 | 0.56 | 48.5 | 0.53 | 48.9 | 0.53 | 120.1 | 0.54 |
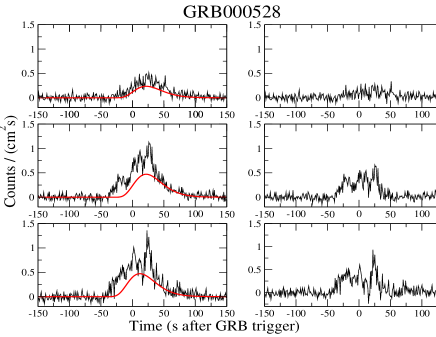
4.2.4 GRB~000528
This GRB was detected on May 28, 2000 at 08:46:35 UT by BeppoSAX, Ulysses and NEAR, and localized to better than 2′ (Gandolfi et al. 2000d). The LC in the 2–5 keV band appears dominated by the SC, whereas narrower peaks become more evident at higher energies (Fig. 17, upper left panel). Note that also SC is growing at 5–10 keV and more at 10-26 keV. After evaluating the SC for the 2–5 keV LC and retrieving from it the SC profile for the other energy ranges, we realized that to fit the 10–26 keV data we had to anticipate the starting time by 10 s, according to Eq. (2). Note from Table 2 that for this GRB the SC amplitudes at energies higher than 5 keV are twice bigger than at 2–5 keV: . There is a hint that above 10 keV the SC can show a faster decay or can be structured. Possibly it could be better described by the sum of two functions, like in the case of GRB~990123.
5 SC and FC spectral properties
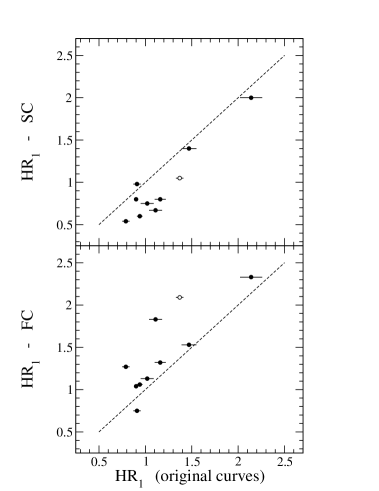
The above results show that in several cases we found that SCs change with the energy differently than the total prompt emission signal and therefore the spectral properties of SCs and FCs cannot be similar to those of the original LCs. The simplest way to describe these changes is to compare the hardness ratios of FCs and SCs with the original ones. All the HR values are given in Table 4 and in Table 5 are reported the correspondent photon indices, derived using the method described in Sect. 2.1. The values of HR2 and for the GRBs with a soft SC given in square brackets were computed using the 5–10 keV FC and the original 10–26 keV LC. In the following we will consider mainly HRs between the time integrated counts at 5–10 keV and 2–5 keV, because HR2 values in the case of soft SCs were not evaluated.
Fig. 18 shows how HRs of the slow and fast components compare with those of the original data sets: the dashed diagonal line corresponds to unchanged HRs. Note that, while SC points generally lie below the diagonal line, those of FCs are on the opposite side. The unique exception is GRB~990908 that has an SC moderately harder than the original data set. For the majority of GRBs spectral differences are not large, with the exception of GRB 990123 and GRB 001011. The mean value of HR1 for the original LCs of GRBs with a soft SC is 0.99, while that of SCs is 0.69 and the mean of differences is 0.25. Spectral behaviour of FCs is symmetric with an increase of the mean HR1 to 1.27 and a mean difference of 0.27.
The corresponding variations for GRBs having hard SCs are different. Note first that this subsample is not so homogeneous as the former: HR values of OR data are generally higher with the only exception of GRB~990908 whose HRs are similar to those of bursts with soft SCs. HR1 values of SCs are only moderately smaller than OR data, again with the exception of GRB~990908. We recall that this GRB is somewhat peculiar because of the absence of prominent features in its LC, in fact it has also the softest FC in all the sample.
Another peculiar behaviour is that of GRB~000528, which has the highest values of HR1 whereas those of HR2 are comparable to other GRBs. As already noticed in Sect. 4.2.5, LCs in Fig. 17 show that it is dominated by the SC in all the energy bands, particularly at 2–5 keV where the FC is slightly above the background level, while some peaks become apparent in the other LCs. We cannot exclude that high HR values can be related to the difficulty of the SC modelling, however, a possible explanation to be investigated in more detail is that of the large fraction of photons below a few keV are absorbed in the source itself or in its environment.
| GRB | SC | FC | OR | |||
|---|---|---|---|---|---|---|
| HR1 | HR2 | HR1 | HR2 | HR1 | HR2 | |
| GRB 980519 | 0.60 | 1.06 | [0.78] | 0.94 (0.03) | 0.63 (0.03) | |
| GRB 990704 | 0.54 | 1.27 | [0.91] | 0.79 (0.04) | 0.50 (0.03) | |
| GRB 001011 | 0.67 | 1.83 | [1.28] | 1.11 (0.07) | 0.81 (0.06) | |
| GRB 001109 | 0.75 | 1.13 | [0.95] | 1.02 (0.07) | 0.76 (0.07) | |
| GRB 010222 | 0.80 | 0.33 | 1.04 | 1.18 | 0.90 (0.02) | 0.71 (0.02) |
| GRB 010412 | 0.80 | 1.32 | [1.13] | 1.16 (0.06) | 0.89 (0.05) | |
| GRB 990123 | 1.05 | 0.88 | 2.09 | 1.21 | 1.37 (0.04) | 1.04 (0.04) |
| GRB 990705 | 1.40 | 1.21 | 1.53 | 1.41 | 1.47 (0.08) | 1.32 (0.06) |
| GRB 990908 | 0.98 | 0.64 | 0.75 | 0.35 | 0.91 (0.04) | 0.58 (0.04) |
| GRB 000528 | 2.0 | 1.0 | 2.33 | 1.3 | 2.14 (0.12) | 1.02 (0.05) |
| GRB | SC | FC | OR | |||
|---|---|---|---|---|---|---|
| GRB 980519 | 1.56 | 1.16 | [1.39] | 1.24 (0.02) | 1.51 (0.04) | |
| GRB 990704 | 1.42 | 0.81 | [1.05] | 1.15 (0.04) | 1.47 (0.05) | |
| GRB 001011 | 1.45 | 0.73 | [0.99] | 1.09 (0.05) | 1.32 (0.06) | |
| GRB 001109 | 1.21 | 0.93 | [1.05] | 0.99 (0.05) | 1.21 (0.07) | |
| GRB 010222 | 1.18 | 1.80 | 0.99 | 0.94 | 1.10 (0.01) | 1.26 (0.02) |
| GRB 010412 | 1.15 | 0.80 | [0.91] | 0.89 (0.04) | 1.07 (0.04) | |
| GRB 990123 | 0.94 | 1.06 | 0.45 | 0.84 | 0.74 (0.02) | 0.94 (0.03) |
| GRB 990705 | 1.01 | 1.12 | 0.95 | 1.01 | 0.98 (0.04) | 1.06 (0.04) |
| GRB 990908 | 1.18 | 1.47 | 1.37 | 1.92 | 1.22 (0.03) | 1.55 (0.05) |
| GRB 000528 | 0.65 | 1.13 | 0.54 | 1.12 | 0.60 (0.04) | 1.13 (0.04) |
The most interesting case is that of the famous GRB~990123 whose FC shows the highest increase of HR1: we found a value of 2.09 while that of the OR data is only 1.37, the corresponding ratio for the SC lowers only to 1.05. Note also that the changes of HR2 are much smaller. The recent spectral analysis of Corsi et al. (2005) indicates that the low-frequency extrapolation of the WFC spectrum of the prompt emission fails to match the simultaneous optical photometric data. The best fit photon index given by these authors is 0.890.08, intermediate between our and (see Table 5). As written in Sect. 4.2.1 the extrapolation of the X-ray spectrum of the prompt emission in the optical range is much lower than the fluxes given by Akerlof et al. (1999a,b); one could then try to associate this emission with one of the GRB components. From the spectra given by Corsi et al. (2005), however, we can see that an X-ray spectrum able to match optical points must have a photon index close to 2. We found, instead, photon indices of both components close to unity, too hard to avoid this discrepancy.
6 The nature of the slow component
Our analysis of X-ray LCs of a sample of GRB detected by WFCs on board BeppoSAX has shown that their complex shapes can be accounted by the presence of a slow component. Before speculating about the origin of this component we have to verify if an SC, like those modeled in previous sections, can be produced by peak blending as a consequence of the low energy broadening mentioned in Sect.3. A possible consequence of this low energy broadening is that peaks with a small time separation can blend together and produce an apparent underlying pedestal evolving on a longer time scale. To evaluate the relevance of this effect we measured the FWHM of the most intense peaks in the three energy bands and derived the scale factor for the broadening according to Eq. (3). We then smoothed the 10–26 keV LC with this factor resulting in a curve that represents the 2–5 keV temporal evolution if it would depend on energy only as Eq. (3). The resulting 2–5 keV LC for GRB~010222, which has a high S/N ratio, is shown in the middle panel of Fig. 19 (solid line): the comparison with the original 2–5 keV LC (upper panel) did not show a SC of strength and shape comparable to the original signal and therefore we concluded that the peak broadening cannot be the origin of SCs. A further possibility is that the appearance of a SC is related to a broadening even larger than that expected from Eq. (3). We therefore smoothed the previously obtained curve with running average filters and found the light curves shown in the central panel of Fig. 19 (dashed lines). It is evident that all these LCs have very different structures from the original 2–5 keV LC depending on the spectral properties of individual features. Note also that there is no way to obtain a SC peaking around = 30 s.
Spectral differences between FCs and SCs suggest that their emission can be due to different emission mechanisms: one producing highly variable structures and another responsible of the SCs. We tried to investigate whether this second mechanism could be the initial phase of the afterglow but failed to find evidence that SC spectra are similar to those of the afterglows. The latters are usually characterised by photon indices 2 (De Pasquale et al. 2005) while the medium values of SCs are all smaller (see Table 5). Furthermore, SCs are generally softer than the corresponding FCs and their spectra are not single power laws but steepen at high energy, as indicated by the different values of and (when measured), at variance with the afterglow spectra.
Another possible interpretation is that SC is originated in an outflow photosphere as in the model developed by Mészáros & Rees (2000), Mészáros et al. (2002), Rees & Mészáros (2005). Usually the highly variable emission of GRBs is attributed to internal shocks occurring at a certain distance from the centre of the relativistic outflow, that is beyond the photosphere at which the flow become optically thin. At small enough radii the shock through dissipative effects can create a number of pairs sufficient to reestablish a second leptonic photosphere with a limiting radius beyond which the shock remain optically thin. Thus above this radius there will be a region favorable for producing the highly variable signals while the region below it will be favorable to produce a less variable emission. Moreover, sub photospheric dissipation leads to an increase of the radiative efficiency of the outflow, consequently boosting the quasi-thermal photospheric component so that it can dominate the synchrotron component due to non-thermal shocks outside the photosphere. The expected spectrum of this thermal component is that of Black Body (BB), but it can also show a Comptonized component (Mészáros and Rees 2000). The of the BB component depends on the dimensionless entropy (here is the fireball luminosity and the mass rate of the outflow) and on the time scale variability with s the Kepler rotation timescale ( is the black hole mass in units of 10 solar masses). In particular values ranging from a few keV to tens of keV are obtained for and , the latter corresponding to long duration GRBs, like those in our sample.
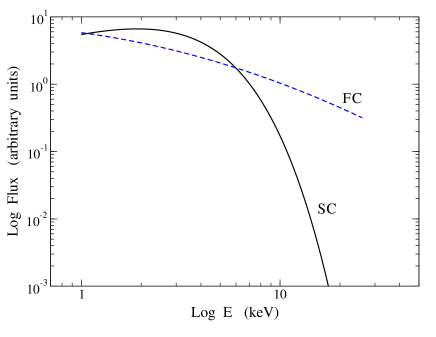
In this scenario it is natural to associate the SC with the photospheric emission and FC with the more variable and harder non-thermal emission. It is important, therefore, to verify that the SC is or not a trace of a photospheric GRB emission, but this require the development of a complex physical model that is beyond the aim of this work. In any case some useful indications for this modelling can be obtained by the evaluation of the energy dependence of the luminosity ratio between the components. As for example, we considered the two possible photon spectral distributions (in the observers’ frame) of these two components shown in Fig. 20, where we plotted a BB spectrum with = 1.2 keV and a slowly steepening spectrum representing the flatter time averaged synchrotron emission from the peaks of the FC, or, if present the Comptonized component.
Using these simple spectra we computed the fractional content of the SC in the same energy ranges considered in our analysis and found 0.63 (2–5 keV), 0.29 (5–10 keV) and 0.03 (10–26 keV). These numbers compare well with those of some GRBs with a soft SC in our sample, for instance they are very close to those measured for GRB~001011.
In the case of GRB~990704 we found that the duration of the SC at 5–10 keV is significantly shorter than at 2–5 keV and satisfy the Fenimore et al. (1995) relation (Sect. 4.1.2). It is unclear whether photospheric light curves do or do not have the same time evolution at different energies, as pointed out in Sect. 4.1.2.. In the case it was the same, one has to invoke other emission processes and/or geometries to explain such a peculiar behaviour.
7 Conclusions
Our analysis of X-ray LCs of a sample GRBs detected by WFCs on board BeppoSAX provided evidence of components evolving on time scales of several tens/hundreds of seconds. Although in some cases the shape of the SC cannot be well defined because of the low S/N ratio, for the majority of GRBs in our sample, the existence of a SC can be considered safely established. In particular, in the case of GRB~010222 we verified that SCs are not originated by blending of narrow peaks and of features closely spaced in time as a consequence of the low-energy broadening found by Fenimore et al. (1995). Likely the same conclusion holds for the other GRBs. Furthermore, the subtraction of a SC model from original LCs gave residual fast components showing time structures very similar to those of LCs above 10 keV and having peak broadening in agreement with Eq. (3).
Spectral analysis on SCs was not simple and we were able to derive some indicative photon indices. In six of GRBs studied by us, the spectra of SCs were characterised by a rather sharp cut-off above 10 keV. In a few cases, however, we found a clear indication that spectra of SCs are harder with a detectable emission in the range 10–26 keV. A very promising scenario to explain these spectral behaviours seems that of a thermal component originating from an expanding photosphere having of a few keV as in the model proposed by Mészáros & Rees (2000). To verify this hypothesis it is necessary to develop a more detailed spectral model to be adapted to individual GRBs. This is beyond the present work, which is essentially based on the study of LCs, and it can be a further step for the understanding of such complex transient phenomena.
It is also relevant to develop a fast algorithm to be applied for a safe identification and modelling of slow components in GRB light curves. The simple approach adopted by us in this work, although useful in a first level analysis, is user dependent and therefore cannot be of general application. A filtering technique, based on wavelet analysis, considering the power distribution over the various time scales can be useful, but its development and testing over a large variety of LC profiles, is not a simple task.
As a final remark we stress the relevance of broad band GRB observations. The comparison between light curves at different energies is an unavoidable step to unravel the presence of components evolving on different time scales. It is important that future space missions mainly devoted to GRB observations will be designed to cover also the X-ray bands down to a fraction of keV.
Acknowledgements.
We are grateful to the referee J.T. Bonnell for his comments and suggestions. This research was supported by INAF and Universitá La Sapienza di Roma. The authors are grateful to ASDC, ASI Data Center, in particular to F. Verrecchia for making the WFC data available and the support in the data transfer, and to L. Amati, A.Corsi and M. Feroci for providing us some data.References
- (1) Akerlof, C.W., et al. 1999a, GCN Circ. 205
- (2) Akerlof, C.W., et al. 1999b, Nature, 398, 400
- Akerlof & McKay (1999) Akerlof, C.W., McKay, T. A.,1999, IAU Circ. 7100
- (4) Amati, L., Frontera, F., et al. 2000a, IAU Circ. 7519
- (5) Amati, L., Frontera, F., et al. 2000b, Science, 290,953
- Amati et al. (2002) Amati, L. et al., 2002, A&A 390, 81
- Arnaud et al. (1996) Arnaud, K.A., 1996, Astronomical Data Analysis Software and Systems V, eds. Jacoby G. and Barnes J., p17, ASP Conf. Series volume 101
- (8) Berger, E., Frail, D.A. 2001a, GCN Circ. 1168
- (9) Berger, E., Frail, D. A. 2001b, GCN Circ. 968
- Boella et al. (1997) Boella, G., Butler, R.C. et al., 1997, A&AS 125, 557
- Castro Cerón et al. (2004) Castro Cerón, J.M., Gorosabel, J., et al., 2004, A&A , 424, 833
- Celidonio et al. (1999) Celidonio, G., Tarei, G., et al. 1999, IAU Circ. 7218
- Corsi et al. (2005) Corsi A., Piro L., et al., 2005, A&A , in press, astro-ph/0504607
- De Pasquale et al. (2005) De Pasquale, M., Piro, L., Gendre, B. 2005, A&A ,submitted
- Di Paola et al. (2001) Di Paola, A., Antonelli, L.A. et al. 2001, GCN Circ. No. 977
- Djorgovski et al. (1998) Djorgovski, S.G., Gal, R. R., Kulkarni, S. R., Bloom, J. S., Kelly, A. 1998, GCN Circ. 79
- Fenimore et al. (1995) Fenimore, E.E., in ’t Zand, J.J., Norris, J. P., Bonnell, J. T., Nemiroff, R. J. 1995, ApJ, 448, L101
- Feroci et al. (1998) Feroci, M., Piro, L., Daniele, M.R. et al., 1998, IAU Circ. 6909
- Feroci et al. (1999) Feroci, M., et al. 1999, IAU Circ. 7095
- Feroci et al. (2001) Feroci, M., Antonelli, L. A., Soffitta, P. et al. 2001, A&A 378, 441F
- Fich et al. (2001) Fich, M., Phillips, R.R. et al., 2001, GCN Circ. 971
- Fishman et al. (1985) Fishman, G., et al. 1985, ICRC, 3, 343F
- Fishman et al. (1992) Fishman, G., et al. 1992, in Gamma-Ray Bursts: Huntsville, 1991, ed. W. S. Paciesas & G. J. Fishman (New York: AIP), 13
- Frail et al. (1999) Frail, D. A., et al. 1999, GCN Circ. 211
- Frontera et al. (1997) Frontera, F., Costa, E. et al., 1997, A&AS 122, 357
- Frontera (2004) Frontera, F., 2004, ASP Conference Series, Vol. 312
- Fruchter et al. (1999) Fruchter, A., et al. 1999, ApJ, 519, L13
- (28) Galama, T., et al., 1999a, Nature, 398, 394
- (29) Galama, T., et al., 1999b, GCN Circ. 212
- (30) Gandolfi, G. et al., 2000a, GCN Circular No 846
- (31) Gandolfi, G., Piro, L. 2000b, GCN Circular No. 878
- (32) Gandolfi, G., Piro, L. 2000c, GCN Circular No. 879
- (33) Gandolfi, G., 2000d, BeppoSAX Mail n. 00/10 and 00/11 (Rome: IASF)
- Gorosabel et al. (2000) Gorosabel, J, Hjorth, J., Pedersen, H. et al. 2000, GCN Circular No. 849
- Gorosabel et al. (2002) Gorosabel, J, Fymbo, J.U., Hjorth, J., et al.. 2002, A&AS 384, 11
- (36) Heise, J., in ’t Zand, J., Celidonio, G., et al. 1999a, IAU Circ., No. 7217
- (37) Heise, J., Delibero, C., et al. 1999b, IAU Circ., No. 7099
- (38) Henden, A. et al., 2001a, GCN Circ. No. 961
- (39) Henden, A. et al., 2001b, GCN Circ. 96
- (40) Hjorth, J., Pedersen, H., Jaunsen, A.O., Andersen, M.I. 1999a, A&AS 138, 461
- (41) Hjorth, J., et al., 1999b, GCN Circ. 219
- Holland et al. (2000) Holland et al., 2000, GCN Circ. 753
- Jager et al. (1997) Jager, R., Mels, W.A. et al., 1997, A&AS 122, 299
- Jaunsen et al. (1998) Jaunsen, A. O., Hjorth, J. et al., 1998, GCN Circ. 78
- Kelson et al. (1999) Kelson, D.D., Illingworth, G.D.,1999, IAU Circ. 7096
- (46) Kulkarni, S.R., Djorgovski, S.G., et al. 1999a, Nature,398, 389
- (47) Kulkarni, S.R., Frail, D.A., 1999b, ApJ 522, L97
- Lachowicz & Czerny (2005) Lachowicz P., & Czerny B., 2005, MNRAS (in press), astro-ph/0412136
- Link, Epstein, & Priedhorsky (1993) Link, B., Epstein, R. I., & Priedhorsky, W. C. 1993, ApJ, 408, L81
- Masetti et al. (2000) Masetti, N. et al. 2000, A&A 354, 4730
- Mészáros et al. (1993) Mészáros, P., Laguna, P., Rees, M.J., 1993, ApJ 415, 181
- Mészáros & Rees (2000) Mészáros,& P., Rees, M.J., 2000, ApJ 530, 292
- Mészáros et al. (2002) Mészáros, P., Ramirez-Ruiz, E. et al. 2002, ApJ 578, 812
- Muller et al. (1998) Muller, J. M., et al. 1998, IAU Circ. 6910
- Nicastro et al (1998) Nicastro, L. et al. 1998, IAU Circ. 6912
- Norris et al. (1996) Norris, J.P., Nemiroff, R.J. et al. 1996, ApJ, 459, 393
- Norris et al. (2000) Norris, J.P., Marani, G.F. & Bonnell, J.T. 2000, ApJ, 534, 248
- Odewahn et al (1999) Odewahn, S.C., et al. 1999, GCN Circ. 201
- Piro et al (1998) Piro, L., 1998, GCN Circ. No. 75
- (60) Piro, L., et al. 1999a, GCN Circ. 199
- (61) Piro, L., et al. 1999b, GCN Circ. 202
- (62) Piro, L., et al. 1999c, GCN Circ. 203
- (63) Piro, L., et al. 1999d, GCN Circ. 406
- (64) Piro, L. 2001a, GCN Circ. 959
- (65) Piro, L. 2001b, GCN Circ. 1033
- Rees & Meszaros (2005) Rees, M.J., & Meszaros, P., 2005, ApJ in press, astro-ph/0412702
- Reichart et al. (2001) Reichart, D.E., Lamb, D.Q. et al. 2001, ApJ, 552, 57
- Sari & Piran (1999) Sari, R., & Piran, T. 1999, ApJ, 517, L109
- Shirasaki et al. (2003) Shirasaki, Y., Kawai, N., et al. 2003, Proceedings op the SPIE, 4851, 1310
- (70) Stanek, K.Z., Jha, S., McDowell, et al. 2001a, GCN Circ. 970
- (71) Stanek, K.Z., Garvanich, P., Jha, S., Pahre, M. 2001b, IAU Circ., No 7586
- Taylor et al (2000) Taylor, G.B., Frail, D.A., Kulkarni, S.R. 2000, GCN Circ. 880
- Tavani (1996) Tavani, M., 1996, ApJ 466, 768
- Torrence and Compo (1998) Torrence, C., Compo, G.P. 1998, BAMS 79 61
- Vanderspek et al. (2004) Vanderspek R., Sakamoto T., Barraud C., 2004, ApJ 617, 1251
- Vestrand et al. (2005) Vestrand, W.T., Wozniak, P.R., Wren, J.A. et al. 2005, Nature, 435, 178
- in ’t Zand et al. (1999) in ’t Zand, J.J.M., Heise, J., van Paradijs, J., Fenimore, E.E. 1999, ApJ 516, L57