1–
The Connections between QSO Absorption Systems and Galaxies: Low-Redshift Observations
Abstract
Quasar absorption lines have long been recognized to be a sensitive probe of the abundances, physical conditions, and kinematics of gas in a wide variety of environments including low-density intergalactic regions that probably cannot be studied by any other means. While some pre-Hubble Space Telescope (HST) observations indicated that Mg II absorption lines arise in gaseous galactic halos with a large covering factor, many early QSO absorber studies were hampered by a lack of information about the context of the absorbers and their connections with galaxies. By providing access to crucial ultraviolet resonance lines at low redshifts, deployment of HST and the Far Ultraviolet Spectroscopic Explorer enabled detailed studies of the relationships between QSO absorbers and galaxies. The advent of large surveys such as the Sloan Digital Sky Survey (SDSS) has also advanced the topic by greatly improving the size of absorber and galaxy samples. This paper briefly reviews some observational results on absorber-galaxy connections that have been obtained in the HST/SDSS era, including Mg II absorbers, the low Ly forest, Lyman limit and damped Ly absorbers, and O VI systems.
keywords:
quasars: absorption lines; galaxies: evolution, formation, ISM, halos1 Introduction
1.1 Some Advantages of QSO Absorption Lines
Absorption-line spectroscopy is a powerful tool for the study of gas in the universe. A wide array of elements can be detected in absorption; in the Milky Way ISM, absorption lines ranging from common elements (e.g., H, C, N, O) to exotic heavy metals (e.g., arsenic, selenium, tin, and lead, see, e.g., Cardelli et al. 1991,1993; Hobbs et al. 1993) have been detected. With adequate signal-to-noise, these exotic species can in principle be observed in higher column density QSO absorbers as well (Prochaska, Howk, & Wolfe 2003). Abundance patterns in QSO absorption systems provide valuable information on the nucleosynthetic origins and dust content of the gas and the buildup of metals vs. time. QSO absorption lines also probe the physical conditions of interstellar and intergalactic material: line widths, excited fine-structure lines, and column density ratios yield good constraints on the temperature, density, pressure, and ionization mechanism as well as the radiation field to which the gas is exposed.
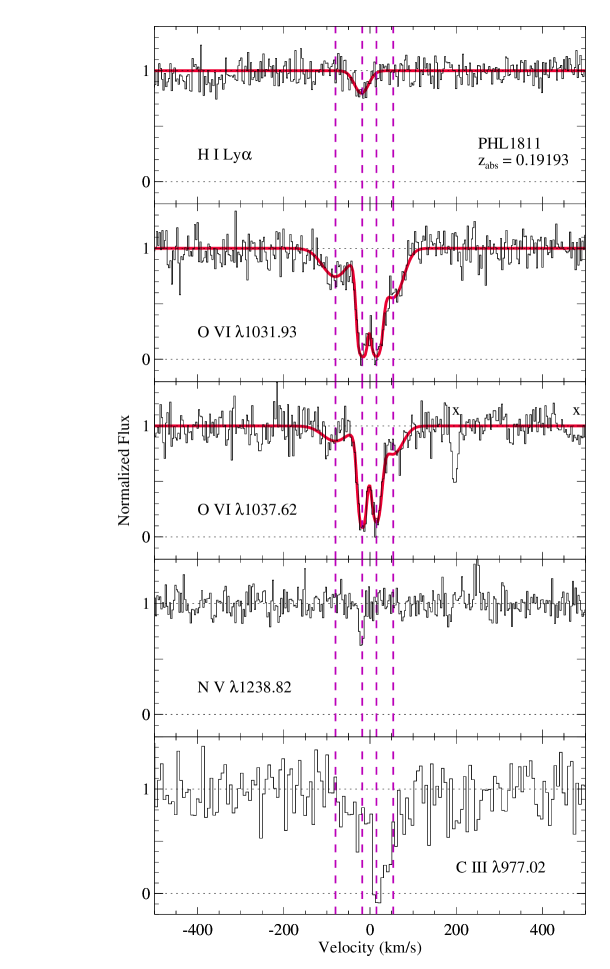
Possibly the greatest advantage of absorption spectroscopy, however, is its tremendous sensitivity. QSO absorption lines can be used to detect low-density gas that is orders of magnitude below the detection threshold of most other techniques. As an example, Figure 1 shows absorption lines detected at = 0.19193 in a UV echelle spectrum of the bright QSO PHL1811 (Jenkins et al. 2003) obtained in a modest HST program with the Space Telescope Imaging Spectrograph (STIS). The H I Ly absorption line shown in the top panel of Figure 1 has log (H I) = 12.8 and is detected at the 4 level. For comparison, 21 cm emission can be used to study H I-bearing gas, and with considerable effort, gas with log (H I) 18.0 can be detected in 21 cm emission. For the study of H I, high-resolution spectra are typically five or six orders of magnitude more sensitive than 21 cm emission observations. Moreover, absorption lines can be measured comparably well from out to 4 while 21 cm emission can only be detected in the nearby universe with current facilities. And, absorption is not limited to low-density, weak absorption lines; high column densities can be measured with great precision as well because these cases show broad damping wings spread over many pixels. Intrinsically weak lines (e.g., spin-changing transitions such as the O I 1355.6 Å line) can also be used to measure abundances in high column density and/or high metallicity systems in which the usual resonance lines are strongly saturated but not strong enough to show damping wings.
However, QSO absorption systems can be complex, and in order to take full advantage of the technique, high spectral resolution and broad wavelength coverage are required. Figure 1 again provides good examples of absorber complexity and the benefits of high resolution with broad coverage. Comparing the various panels in Figure 1, it is readily apparent that there is more to life than H I – Ly only reveals the tip of the iceberg in this system. Four components are evident in the O VI doublet at and +54 km s-1. Ly is only detected at km s-1 along with N V, weak C III, and O VI. This is also the only component to show N V. At first glance, C III appears to be strongest at yet a different velocity. However, because the STIS spectrum covers a substantial wavelength range, we realize that a strong Ly system is present at a different redshift, one that shifts its Ly line into a blend with the C III line shown in Figure 1. Thanks to the high spectral resolution of the data, we can decompose this C III/Ly blend and at least provide useful constraints based on the C III line. Indeed, at lower resolution, these lines in Figure 1 could still be detected (with adequate signal-to-noise), but such data would not allow the column densities to be correctly assigned to different components, which could lead to erroneous conclusions. High spectral resolution provides many other benefits, e.g., better ability to assess and correct for line saturation and better ability to measure widths of narrow lines such the N V line in Figure 1.
1.2 Some Disadvantages of QSO Absorption Lines
However, like all observational techniques, QSO absorption lines have some drawbacks. For example, faint QSOs are difficult to observe at high resolution – especially at lower redshifts – which limits sample sizes. The main disadvantage, however, is that the technique only provides information about material along the pencil beam to the background QSO. At higher redshifts, it is extremely challenging to understand how the detailed information provided by quasar absorption measurements is really connected with the more global context, e.g., whether the absorption arises in the IGM or the ISM of a galaxy, what type of galaxy, etc. However, at low redshifts, detailed information about the environment in which the absorption occurs can be obtained, information such as redshifts and deep images of nearby galaxies, 21 cm or CO emission maps, and the locations of nearby galaxy groups/clusters, voids, and large-scale structures. With such knowledge, we can hope to understand the real nature of QSO absorption lines and their implications for galaxy evolution and cosmology.
The purpose of this paper is to present some examples of how studies of the connections between low-redshift absorbers and galaxies have so far advanced our understanding of the topic as well as goals for future work. This brief (and incomplete) review will comment on studies of low Mg II absorbers, Ly clouds, systems with higher H I column densities, and O VI absorbers.
2 Mg II Absorbers
Historically, the study of QSO absorber-galaxy relationships began with Mg II absorption systems. Magnesium is not particularly abundant and moreover is prone to confusion from dust depletion and ionization effects, so in hindsight, Mg II seems like a strange species to use for probing the galaxy-absorber connection. However, this choice was strongly driven by practical constraints: before the deployment of HST, only Mg II could be studied from the ground at redshifts low enough to allow follow-up investigation of nearby galaxies. Among the dominant ions in H I gas, Mg II is the species with the longest-wavelength resonance transitions, the Mg II doublet at 2796.35, 2803.53. Intrinsically more useful species (e.g., H I or O I) only have resonance transtions at 2000 Å, and ions with resonance lines in the optical (e.g., Na I or Ca II) are even more difficult to analyze than Mg II.
The first observational test of the Mg II - galaxy connection was to image the field around a QSO with a known Mg II system and then measure the redshifts of galaxies close to the line of sight to search for objects at the redshift of the absorption system. Such observations were pioneered by Bergeron (1986), Bergeron et al. (1987), Cristiani (1987), and Bergeron & Boissé (1991). These early studies successfully found galaxies at the Mg II absorption redshifts and at relatively small impact parameters. The investigation of Mg II systems with the largest sample, however, was done by Steidel and collaborators, who found that all normal galaxies with luminosities had Mg II absorbing halos of radius kpc, and that the radius of a halo scales weakly with galaxy luminosity (Steidel et al. 1994; Steidel 1994). These studies appeared to establish a direct link between an individual galaxy and a Mg II absorption system. However, the nature of this link remains unclear. Steidel et al. (2002) have compared the kinematics of five Mg II absorbers with the rotation curves of nearby ( kpc) inclined galaxies, and they conclude that most of these Mg II systems arise in rotating halo gas associated with the nearby galaxy. On the other hand, Chuchill, Steidel, & Vogt (1996) have compared high-resolution Mg II absorption recordings to high-quality HST observations of nearby galaxies, and they find no compelling correlations between the absorber properties and the nearby galaxy properties. Further comments and more recent results on Mg II absorber - galaxy relationship studies are found in Churchill, Kacprzak, & Steidel (2005). It now appears likely that Mg II systems have a variety of origins, and more observations are needed.
More vigorous comparison of observations to theoretical work on gas in galaxies is also required. Over the last decade, theorists have produced detailed hydrodynamical simulations which trace the growth of large-scale structure in the universe and predict the emergence of a ‘cosmic web’ of filaments connected at nodes where galaxy clusters are found. The filamentary distribution of galaxies has been abundantly verified by large galaxy redshift surveys such as 2MASS (e.g., Maller et al. 2003), SDSS (e.g., Stoughton et al. 2002), and 2dFGRS (e.g., Colless et al. 2001), but observations of gas in the web are much more sparse. Indeed, these models would seem to require a re-assesment of how absorbing gas and galaxies might be connected. In the dark matter halos and filaments, gas and galaxies share the same gravitational potentials — and so would be found at similar redshifts — but the exact interplay between a galaxy and the intergalactic medium (IGM) is poorly understood. On the one hand, the IGM may be metal-enriched through much earlier episodes of star-formation [e.g. winds from the first galaxies (Aguirre et al. 2001), population III stars, etc.] so the presence of a galaxy is not a necessary condition for the existence of metallic (absorbing) gas. On the other hand, galaxies probably continue to enrich the IGM from their formation through to the present (Heckman et al. 2000) via a variety of processes, including: winds from starburst and blue compact dwarf galaxies, the more normal expulsion of interstellar gas via galactic chimneys, tidal stripping through galaxy-galaxy interactions, the evaporation of dwarf galaxies, or ram-pressure stripping from passage through an intragroup/intracluster medium.
So what do Mg II systems represent in this new paradigm of galaxies embedded in the cosmic web? There seems little doubt that Galactic disks give rise to strong Mg II lines since disks have a substantial (H I) and relatively high metallicity over a large cross-section of a galaxy. Our own Milky Way, for example, produces complex, saturated Mg II absorption along all sightlines which penetrate (only half of) the Galactic disk (e.g., Bowen et al. 1995; Savage et al. 2000). However, several groups have concluded that rotating disks by themselves are not sufficient to explain the observed Mg II kinematics (e.g., Charlton & Churchill 1998; Steidel et al. 2002). Some Mg II absorbers are strong and strikingly symmetric, and this has led to suggestions that these particular systems arise in superbubbles/superwinds (Bond et al. 2001; Ellison, Mallen-Ornelas, & Sawicky 2003).
2.1 Do all galaxies cause Mg II absorption?
This is a fundamental first question. Mg II studies in the late 1980s and early 1990s gave the impression that if a luminous galaxy is within some impact parameter of a background QSO sight line, Mg II absorption would almost always be detected. This is somewhat surprising because in the Milky Way, interstellar clouds are small and have a patchy distribution. Most of these early searches for absorbing galaxies were conducted toward QSOs with Mg II systems which were already known. Hence, although Mg II absorbers appear to be associated with galaxies in some way, we do not know that all galaxies (and/or their environments) give rise to Mg II systems. To address this question, it is worthwhile to invert the procedure originally used to study Mg II-galaxy relationships, i.e., first select galaxies close to QSO sightlines (without any knowledge of the absorption spectrum), then search for Mg II lines at the foreground galaxy redshift.
This inverted experiment is useful for testing ideas about how galaxies and the IGM might be connected. If galaxies and QSO absorbers are only loosely associated, the detection rate and covering factor of Mg II around galaxies should be considerably smaller than the 100% found from the original studies. And there should be no correlation with galaxy luminosity. Clearly, if the gas is merely a component of the IGM, then it will be an important challenge to understand the physical state (ionization, kinematics and abundances) of such lone clouds. As we discuss below, there are many viable explanations for a low covering factor for Mg II absorbing gas. Nevertheless, a covering factor substantially less than 100% would suggest that the origin of Mg II systems is more complicated than originally thought. Alternatively, if Mg II absorbers do have a near-unity covering factor and adhere to the scaling relationship between radius and luminosity found in the earlier studies, then modeling of galaxy evolution and dynamics would have to take into account the existence of extended and metal-enriched baryonic halos and explain how galaxies can sustain such halos over a significant fraction of their lifetime.
Selecting a significant number of galaxies which lie close on the plane of the sky to QSOs (without forehand knowledge of absorption in the QSO spectrum) is challenging because the galaxies need to be found within of a sightline to be within a proper distance of 60 kpc. The QSO must also be bright enough to be observed spectroscopically at a resolution of only a few Å for the follow-up search for Mg II. Selection of such QSO-galaxy pairs has, until recently, required prohibitively large amounts of observing time. Now, however, the SDSS has made such an experiment possible. The wide area of sky covered, the robust identification of large numbers of QSOs, and the availibility of multicolor photometry for selection of foreground galaxies ensures that substantial numbers of potential QSO-galaxy pairs can be investigated.
2.2 Results
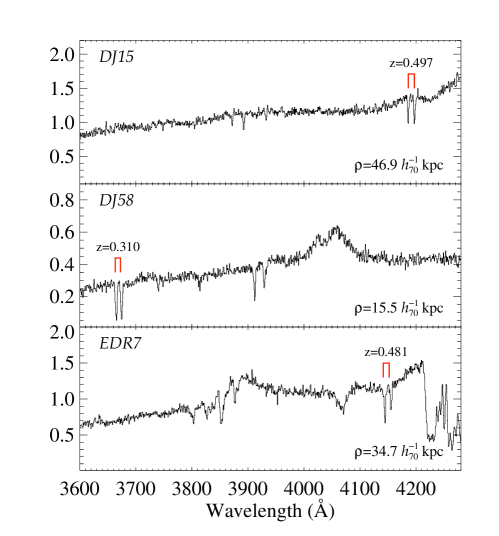
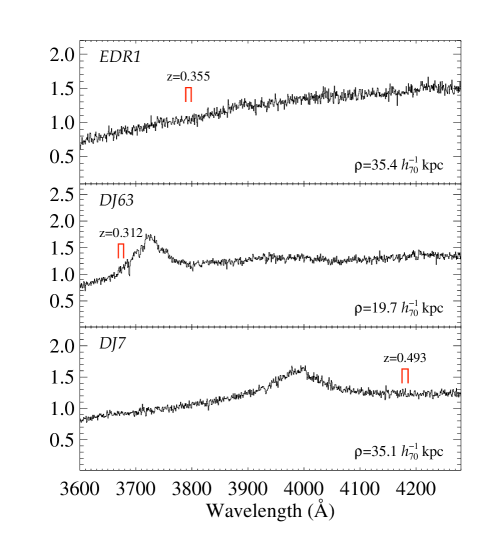
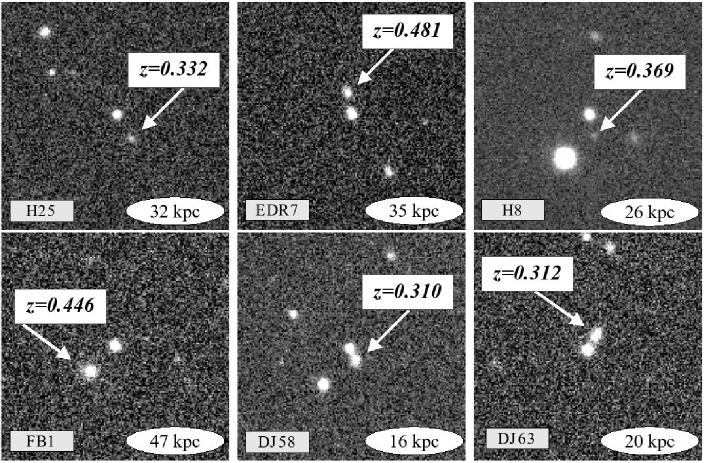
We have been taking advantage of the SDSS in order to carry out the inverted Mg II - galaxy study described above. Briefly, we have used multicolor SDSS imaging to first select galaxy-QSO pairs; photometric redshifts were used to select galaxies with (so that Mg II could be observed from the ground). While SDSS does obtain follow-up spectroscopy, the galaxies and QSOs in the selected pairs were generally too faint to be covered in the spectroscopic component of the SDSS. Consequently, we have used the Hobby Ebberly Telescope to measure the redshifts of thirty galaxies within kpc of QSOs. Fig. 2 shows examples of the SDSS -band images (from Data Release 3) of six such pairs. After the galaxy redshifts were securely measured, in December 2004 we completed a substantial fraction of the second phase of the experiment by using the Multi Mirror Telescope (MMT) to observe two thirds of the QSOs at intermediate spectral resolution in order to search for Mg II absorption at the galaxy redshifts. The intital results are surprising. Although all the galaxies lie within the canonical 60 kpc established as the size of Mg II-absorbing halos, we find that 50% (10/20) of the QSO spectra show no Mg II lines at the redshifts of the intervening galaxies. Figure 3 shows some examples of our MMT spectra in which the Mg II absorption was detected, and Figure 4 shows cases where no Mg II lines are apparent at the expected wavelength. In both figures, the redshift of the foreground galaxy and the expected wavelengths of the Mg II doublet are indicated above the spectrum, and the projected distance between the galaxy and the sightline are noted at in the lower right corner of the panel.
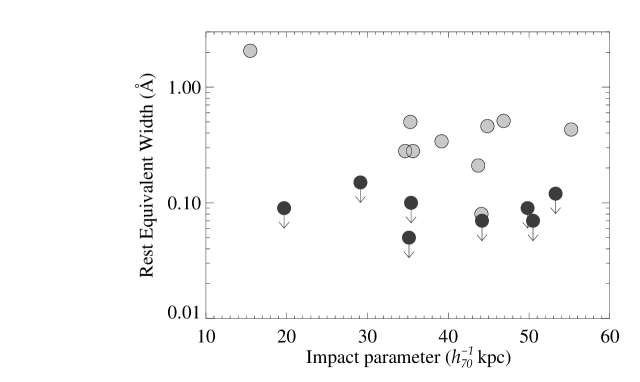
Could selection effects explain our finding that the detection rate is lower than the 100% expected from earlier studies? Several comments about this issue can be made. First, the non-absorbing galaxies are no fainter than the absorbing ones: all have absolute magnitudes in the range to (between 0.3 and 5 when compared to the -band luminosity function of galaxies at constructed by Blanton et al. 2003). Second, the detection of Mg II is not determined by how close a galaxy is to the QSO sightline. Figure 5 summarises our results by showing the rest equivalent width () of the Mg II absorption line — or the upper limit — at the redshift of the intervening galaxy, plotted against the separation of the galaxy from the QSO sightline. The non-detections do not simply arise because a galaxy is further away from the sightline. Preliminary analysis shows no clear dependence on galaxy luminosity either. Finally, the non-detections are not a consequence of differences in sensitivity of the spectra: all of our QSO spectra reach similar rest equivalent width limits of Å, a value which is small compared to the Mg II lines used to define halo sizes in the previous work. The main difference between our program and earlier work is whether or not the targets are selected by having known Mg II absorption. It appears that if Mg II absorption is present at a particular redshift, there is a high probability that a galaxy will be found nearby, but the converse does not necessarily hold.
There are many possible reasons that some galaxies have affiliated Mg II absorption and others do not. For example, the detection of Mg II absorption could depend on galaxy morphology: perhaps a mixture of late and early type galaxies, or interacting and non-interacting galaxies, is responsible for the 50 % success rate of detections in our sample. However, Steidel et al. (1994) found that Mg II-selected galaxies have colors indicative of all normal galaxy types, including ellipticals. High-resolution imaging of these systems would be very valuable for further investigation of the nature of the absorbing and non-absorbing galaxies. Another possibility is that the presence or absence of Mg II absorption depends on environmental factors. For example, galaxies that are embedded in hot intragroup or intracluster gas might lack associated Mg II absorption because the halo gas is highly ionized or has been swept away by ram pressure. Again, this hypothesis can be tested with follow-up studies, e.g., deep galaxy redshift surveys over a much larger field centered on the QSO and X-ray imaging observations. Ultimately, comparsion between the properties and environments of absorbing and non-absorbing galaxies, when significant numbers of both are available, will reveal the nature and origin of the absorbing gas which, in turn, will make the technique more useful for the broader goals of galaxy evolution and cosmology.
3 Low-Redshift Ly Forest Systems
As noted above, Mg II is not an ideal ion for tracing the distribution and physical conditions of gas in, around, and (especially) far away from galaxies. Truly intergalactic gas with low density would likely be significantly ionized by photoionization from the UV background from QSOs and AGNs. Intergalactic gas can also have low metallicity. These ionization and metallicity factors can make Mg II undetectable in such gas. Clearly, H I observations are much more fundamental. While the hydrogen can also be extremely ionized in the low-density IGM, H I Ly remains detectable because hydrogen is so abundant.
However, since the longest-wavelength resonance H I transition is the Ly line at 1215.67 Å, ultraviolet spectroscopy is required for low-redshift observations and absorber-galaxy correlation studies. Before the launch of HST, it was not clear that many low Ly forest lines would be detected in a typical sight line. At high redshifts, the number of Ly clouds per unit redshift () declines rapidly with decreasing redshift, and as an example, extrapolation of the high trend to predicts that one or two Ly lines with 50 mÅ should be found in the sight line to 3C 273. Consequently, it was a delightful surprise when the first HST observations of 3C 273 revealed ten Ly clouds with 50 mÅ (Morris et al. 1991). This was a boon for Lya cloud - galaxy studies; useful samples could evidently be accumlated more rapidly than expected. The Ly vs. has now been measured well (Penton, Stocke, & Shull 2004; Williger et al. 2005) and is theoretically understood: at high-redshift, (H I) falls steeply with due to decreasing gas density caused by expansion of the Universe. However, the space density of QSOs also declines substantially at which, in turn, causes the UV background intensity and the H I photoionization rate to decrease markedly at lower redshifts; the fading of the UV background counteracts the decreasing density so that the forest does not thin out as rapidly as expected. The observed (H I) vs. is also well-matched in hydrodynamic simulations of cosmological structure growth (e.g., Davé et al. 1999).
Soon after the first HST observations, investigations of the Ly – galaxy connection were initiated. It is worth recalling that before HST (and Keck), the prevailing paradigm associated (high H I column) metal absorbers with galaxies, and the (lower H I column) Ly forest clouds were thought to be metal-free, pristine clouds uncorrelated with galaxies (e.g., Sargent et al. 1980). In this context, initial HST studies that found Ly clouds associated with intervening galaxies in a few cases (e.g., Bahcall et al. 1992; Spinrad et al. 1993) attracted considerable interest. Soon thereafter, ground-based echelle spectroscopy with the Keck 10m telescope showed that metals are widespread even in low-(H I) Ly forest clouds (Tytler et al. 1995; Cowie et al. 1995) and a major shift in the QSO absorber/IGM paradigm began. It was apparent that the Ly clouds are not randomly distributed with respect to galaxies, and moreover they are somehow enriched by nucleosynthesis products from stars.
However, as more extensive spectroscopic surveys of galaxy redshifts near low QSO sight lines were executed and analyzed, a debate about the nature of low Ly lines emerged. One school argued that the low Ly lines, like Mg II systems, arise primarily in large, spherical gaseous halos of individual galaxies with near-unity covering factor and 200 kpc (Lanzetta et al. 1995; Chen et al. 1998, 2001). This interpretation was mainly built upon an observed anticorrelation between impact parameter and Ly equivalent width, i.e. the lower the projected galaxy-sight line distance, the greater the Ly equivalent width (see the left panel of Figure 6). On the other hand, several groups — using more sensitive data — found that the while Ly lines are significantly correlated with galaxies, the correlation is not as strong as the galaxy-galaxy correlation, and indeed some Ly clouds were found to be located in galaxy voids (Morris et al. 1993; Stocke et al. 1995; Tripp, Lu, & Savage 1998; Impey, Petry, & Flint 1999). To reconcile these discordant results, it was suggested that strong Ly clouds with 300 mÅ — which dominate the samples of Lanzetta, Chen et al. — arise in individual halos, and the Ly lines with 200 mÅ are less strongly correlated with galaxies but still are largely located in the same large-scale dark matter structures as the galaxies. Using a sample of QSO - galaxy pairs at very low redshifts ( 4000 km s-1), Bowen, Pettini, & Blades (2002) have also confirmed the anticorrelation. However, they hypothesize that the Ly line strength is correlated with the volume density of nearby galaxies rather than the impact parameter to a particular galaxy (see their Figure 19). The basic idea is that as dark matter potential wells grow deeper, the density of galaxies and the density of accumulated gas both increase leading to this correlation.
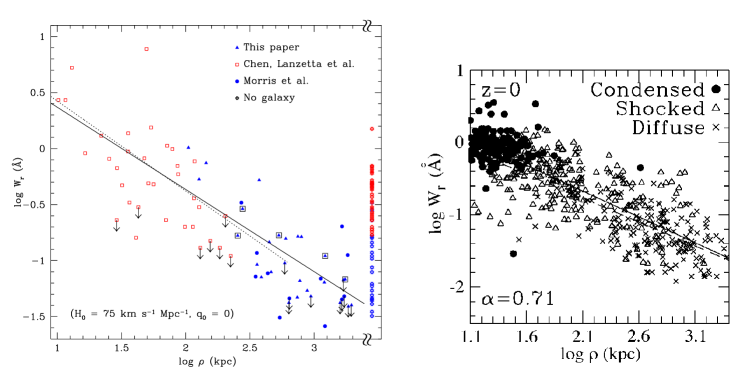
A similar interpretation is favored by theoretical work. Hydrodynamic cosmological simulations reproduce the impact paramemter - equivalent width anticorrelation. Figure 6 compares the observed anticorrelation [left panel] to the same anticorrelation measured from artificial spectra from the cosmological simulation of Davé et al. (1999) [right panel]. The power law fitted to the observed data () has the same slope as the power law from the simulations ( vs. from the CDM model of Davé et al. 1999). Using the algorithm of Gelb & Bertschinger (1994), Davé et al. (1999) have identified galaxies in their simulation, which in turn they use to determine which Ly lines originate in the bound halos of individual galaxies. They find that the impact paramemter - equivalent width anticorrelation is not strictly due to absorption arising in particular single galaxies. The filled circles in the right panel of Figure 6 arise in bound halos of “condensed” individual galaxies; these cases are mostly at 50 kpc. Thus, Ly absorbers at larger impact parameters are not bound to individual galaxies but nevertheless are located in the same large-scale structures as the nearby galaxies. Interestingly, Davé et al. find that some of the Ly lines near galaxies come from shock-heated gas at K, which has some implications for the missing baryons problem (see §5). Others are from “diffuse” clouds, photoionized and relatively cool gas (at K), which are most analogous to the gas clouds that dominate the high Ly forest.
There remain many open questions about the nature of lowz Ly clouds. Existing studies suffer from a variety of selection effects (see, e.g., Tripp et al. 1998). A particularly serious problem with Ly observations carried out with first-generation HST spectrographs is that many (but not all) of the spectra have low spectral resolution, i.e., FWHM 150 km s1. One of the original HST instruments, the Goddard High-Resolution Spectrograph (GHRS), was capable of recording high-resolution spectra (e.g., Morris et al. 1991; Cardelli et al. 1991, 1993; Bowen et al. 1995). However, the one-dimensional detectors of the GHRS severely limited the wavelength range of individual exposures obtained in high-resolution modes, and to obtain broad wavelength coverage required prohibitive telescope time. The installation of STIS, which used two-dimensionsal detectors and therefore could observe wide wavelength ranges at high resolution in single exposures, provided a great leap in capability.
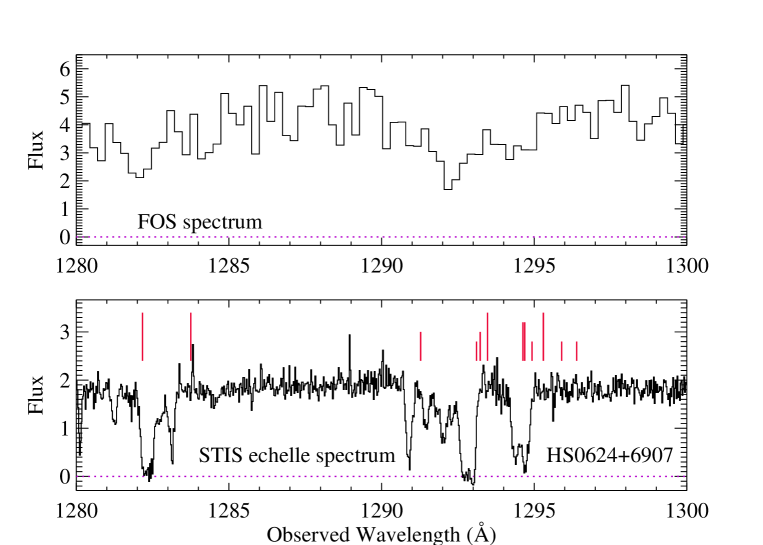
The importance of high resolution is illustrated in Figure 7. This figure compares the same portion of the spectrum of the low QSO HS0624+6907 observed with the HST Faint Object Spectrograph (FOS, FWHM km s-1, upper panel) from Bechtold et al. (2002, see also Jannuzi et al. 1998) and the E140M echelle mode of STIS (FWHM = 7 km s-1, lower panel) from Aracil et al. (2005). It is immediately obvious from this comparison that crucial information is lost in the low-resolution spectrum. We notice several problems: (1) The FOS mainly detects strongly saturated lines, which makes accurate column density measurements very difficult or impossible. (2) In this case, there is a substantial error in the FOS wavelength zero point (the FOS is shifted by by 80 km s-1 with respect to the STIS spectrum, which has an accurate zero point. This is only half of an FOS resolution element, but nevertheless such errors can cause confusion if velocity differences are used to match a particular Ly absorber with a particular galaxy (at Ly redshifts, there are often multiple galaxies with comparable and values) or if galaxy velocity curves are compared to the line centroids. (3) The kinematics and component structure revealed by high resolution substantially improve our understanding of the absorption. Consider the cluster of Ly lines evident between 1290 and 1295 Å in Figure 7. We find that 13 H I components are spread over this 1000 km s-1 interval. These kinematics cannot be explained by rotation of a galaxy disk or halo. Even tidal stripping is unlikely to produce such a velocity spread. Instead, this absorption cluster is likely intragroup gas that is not bound to a particular galaxy. On the other hand, the FOS data can only indicate the presence of one or two components in this wavelength range, which could be erroneously interpreted as simple, ordinary halo gas associated with the two nearest galaxies (the two longest bars in Figure 7). We expect that the current archive of high-resolution STIS spectra will significantly advance our knowledge of the Ly-galaxy connection in upcoming years (as shown in, e.g., Bowen et al. 2002; Penton et al. 2004; Richter et al. 2004; Sembach et al. 2004; Williger et al. 2005; Aracil et al. 2005)
4 Lyman Limit, Sub-damped, and Damped Ly Absorbers
Many papers in these proceedings discuss the higher-(H I) absorption systems, i.e., the Lyman limit ((H I) cm-2), sub-damped Ly ((H I) cm-2), and damped Ly ((H I) cm-2) absorption systems and their relationships with galaxies. Furthermore, most of the Mg II absorbers discussed in §2 are actually in these high-(H I) categories; most Mg II systems have log (H I) 16. However, we would like to add a few additional comments about these types of absorbers.
In the nearby universe, relatively large clouds of intergalactic H I have been known from 21 cm emission studies for many years; these would be LL, sub-DLA, and DLA absorbers if a QSO were behind them. Some well-known examples include H I 1225+01 (Giovanelli & Haynes 1989), the “Leo Ring” in the M96 group (Schneider 1989), HIPASS J1712-64 (Kilborn et al. 2000), and most recently, “VIRGOHI21” (Minchin et al. 2005). These clouds have attracted considerable interest, but it is often not clear what role they play in galaxy evolution and cosmology. They could be the leftover building blocks of galaxy formation, i.e., the small dark matter and gas halos that merge to form large galaxies in hierarchical formation scenarios (e.g., Blitz et al. 1999), but many other interpretations remain viable, e.g., they could be debris from tidal or ram-pressure stripping. Recently Minchin et al. have suggested that VIRGOHI21 is the first discovery of a “dark galaxy”, a large dark matter halo ( M⊙) that for some reason has failed to form detectable stars. If correct, this is an important finding for cosmology and galaxy evolution. However, Oosterloo & van Gorkom (2005) have argued that VIRGOHI21 might instead be material dynamically stripped from the nearby galaxy NGC4254.
The nature and importance of these H I clouds are poorly understood partly because 21 cm emission provides no information about the chemical enrichment and star-formation history of the objects. Galaxies are usually found in or near the clouds, but whether the gas is entering or leaving the galaxy (or neither) is unclear. Chemical enrichment measurements can elucidate the nature of H i clouds: tidal or ram-pressure stripped gas should be enriched to the metallicity level of the source galaxy. Small and old dark matter halos, on the other hand, are expected to be metal poor.
Hence, there is need to combine information from QSO absorption measurements with other techniques such as 21 cm emission mapping. We have recently discovered an intergalactic H I cloud similar to VIRGOHI21, but uniquely our cloud was discovered in Ly absorption in an ultraviolet HST spectrum of a background QSO (Tripp et al. 2005). The sight line to this QSO (PG1216+069, = 0.331) passes through the outskirts of the Virgo cluster close to the X-ray bright NGC4261 galaxy group. We obtained a high-resolution (7 km s-1 FWHM) UV echelle spectrum of PG1216+069, and this revealed damped Ly absorption at the Virgo redshift = 0.00632 (see Figure 2 in Tripp et al. 2005) with log (H i) = 19.320.03. Metal absorption lines in the echelle spectrum robustly indicate that the metallicity is quite low: [O/H] = . Moreover, nitrogen is significantly underbundant, which suggests that intermediate-mass stars have not contributed substantially to the metal enrichment. Evidently, this is a relatively primitive damped Ly absorber. We have searched for associated galaxies using HST imaging and spectroscopic redshift surveys, but we are unable to find a nearby galaxy. The closest known galaxies are at substantial projected distances from the sight line (see Tripp et al. 2005). Clouds like this one appear to be not uncommon in the spectra of low QSOs. Additional information from techniques like 21 cm emission observations could provide valuable information such as the physical dimensions of the cloud, its H I mass and dynamical mass, and its morphology. Conversely, deployment of a more a new, substantially more sensitive, high-resolution UV spectrograph (e.g., Sembach et al. 2005) could enable studies of objects that have already been mapped in, e.g. 21 cm, because faint QSOs are known behind many interesting targets, but they are too faint for current UV facilities.
Like the absorbers discussed in previous sections, the high-(H I) systems probably have a variety of origins. The Giovanelli & Haynes cloud spans kpc in its long dimension, for example, and the properties of some QSO absorbers imply similar sizes (e.g., Savage et al. 2002,2005). On the other hand, some high-(H I) systems have properties that imply vastly smaller sizes (e.g., Tripp et al. 2002; Rigby, Charlton, & Churchill 2002), sizes of order a few tens to few hundreds of parsecs. Stocke et al. (2004) have found a dwarf poststarburst galaxy near the small cloud studied by Tripp et al. (2002), and they have suggested that the absorber is an ejecta fragment in a supernova-driven wind. The dwarf galaxy is relatively faint () and has a projected distance of 71 kpcfrom the sight line. In order to search for similar galaxies near other QSO absorption systems, very deep observations will be needed. This poses a serious challenge for absorber-galaxy studies.
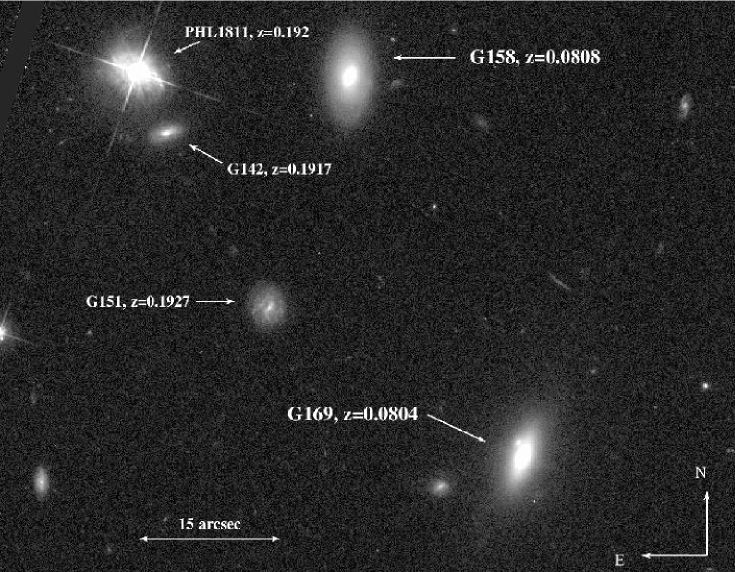
Some high-(H I) systems have shown surprising abundances patterns. For example, we have recently completed a detailed investigation of a Lyman limit absorber at towards the bright QSO PHL 1811 (Jenkins et al. 2005). This LL system shows a rather unusual abundance pattern with a high oxygen metallicity but an extrememly low nitrogen abundance. Underabundances of nitrogen are expected (and often observed) in low metallicity systems because nitrogen is synthesized in longer-lived intermediate-mass stars and moreover its synthesis depends on the initial metallicity of the gas (see, e.g., Henry, Edmunds, & Köppen 2000; Prochaska et al. 2002; Pilyugin et al. 2003, and references therein). In these cases, the nitrogen production is lagging behind the rapid element enrichment from type II SNe. However, it is surprising to find that nitrogen is underabundant in high-metallicity gas. Possibly this abundance pattern is due to a massive burst of star formation that enriched and blew out the interstellar gas before intermediate-mass stars were able to substantially enrich the gas with nitrogen. High-resolution imaging of the PHL1811 field obtained with the HST Advanced Camera for Surveys (see Figure 8) has revealed two S0 galaxies at the Lyman limit redshift near the sight line (see Jenkins et al. 2005 for details), so ram-pressure stripping or tidal interactions may also play a role in the origin of this absorber.
5 O VI Absorbers, Broad Ly Lines, and the WHIM
We close this article with a brief review of O VI absorption systems and their connections to galaxies. These absorbers appear to harbor a significant fraction of the baryons at the present epoch (Tripp, Savage, & Jenkins 2000; Tripp & Savage 2000; Savage et al. 2002, 2005; Sembach et al. 2004; Richter et al. 2004; Danforth & Shull 2005). Again this observation jibes well with the general results of cosmological simulations because the O VI ion fraction peaks at K in collisional ionization equilibrium, and therefore these absorbers have the potential to reveal the so-called “warm-hot” intergalactic medium (WHIM) at K that is predicted by the cosmological simulations to contain 30-50% of the baryons at the present epoch (Cen & Ostriker 1999; Davé et al. 1999).
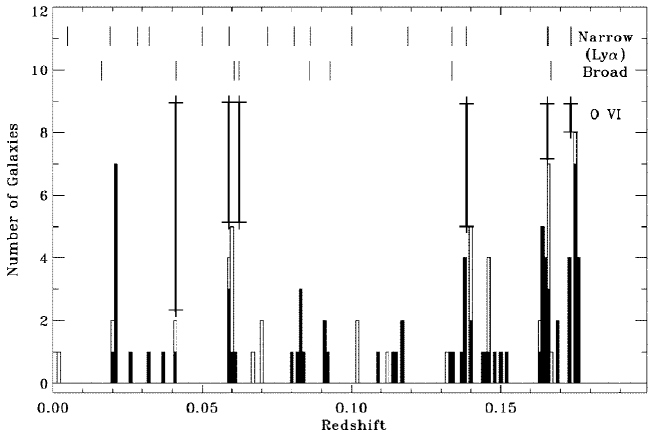
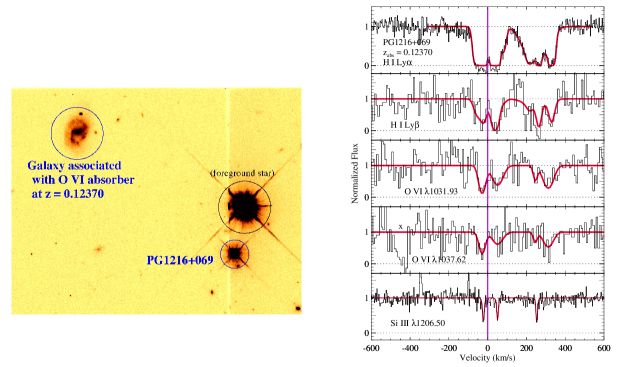
Studies of O VI - galaxy connections are in their infancy. However, galaxy redshift surveys have been conducted in the fields of several QSOs that show intervening O VI absorbers (e.g., H1821+643, PG1116+215, PG0953+415, PKS0405-123), and in these directions, the O VI absorbers appear to be strongly correlated with galaxy structures. Figure 9 compares the distribution of galaxies as a function of redshift in the field of PG1116+215 (histograms) to the distribution of O VI absorbers (long thick lines with cross bars). At a glance, the O VI absorbers appear to mostly follow the galaxies, and this is confirmed by statistical tests: Sembach et al. (2004) show that the probability that the O VI systems are randomly distributed with respect to the galaxies in the field is extremely small. Case studies of specific O VI systems show that O VI absorption arises in a variety of locations (see, e.g., Tripp & Savage 2000; Chen & Prochaska 2000; Tripp et al. 2001; Sembach et al. 2001; Savage et al. 2002; Shull, Tumlinson, & Giroux 2003; Tumlinson et al. 2005) ranging from modest overdensity regions of large-scale structures to galaxy groups to relatively dense regions in the Virgo cluster. Figure 10 shows an example of an O VI system associated with a spiral galaxy at a projected distance of 88 kpc. The absorption line profiles in this case have a symmetric shape reminiscent of the Mg II absorbers presented by Bond et al. (2001), and this absorption could arise in a similar outflow scenario. Three components are significantly detected in the Si III 1206.5 transition. This may seem surprising since supernova-driven, outflowing hot gas might be expected to ionize silicon to the degree where very little Si III is present. However, optical observations of outflows from nearby superwind and ultraluminous infrared galaxies show that even Na I (which is much more easily ionized than Si III) survives and is accelerated to substantial velocities in such outflows (e.g., Heckman et al. 2000; Rupke, Veilleux, & Sanders 2002; Martin 2005), so some aspect of the outflow process can accelerate material considerably without severely ionizing it. The narrow Si III components that are associated with the O VI lines shown in Figure 10 may be analogous lower-ionization clouds in an outflow. Indeed, in the hydrodynamic models of a superwind outflow presented by Heckman et al. (2002), O VI is predicted to exist in interface regions between low-ionization clumps and the hotter X-ray emitting gas.
A persistent problem with the use of O VI absorption lines as a probe of the warm-hot intergalactic medium is that often the O VI doublet and the H I Ly lines are the only detected transitions in a particular absorber. With only these transitions, the metallicity of the gas can only be loosely constrained, and this introduces considerable uncertainty into the baryonic content of the absorber. Another means to search for WHIM gas is to look for very broad Ly lines. As shown in Figure 6, the cosmological simulations predict that a reasonable fraction of Ly lines in the vicinity of a galaxy should occur in shock-heated gas (open triangles in Figure 6). Consulting Davé et al. (1999), we find that these shocked Ly lines are predicted to have gas temperatures ranging from to K and therefore should be quite broad. Tripp et al. (2001) reported a broad Ly line associated with an O VI absorber that arises in a small group of galaxies; this system is a strong candidate for WHIM gas. Richter et al. (2004) and Sembach et al. (2004) have recently identified a number of broad Ly lines in high-resolution STIS spectra of the QSOs PG1259+593 and PG1116+215. Estimates of the baryonic content of these broad Ly candidates suggests that their baryonic content is comparable to that of the O VI systems. Again, a better UV spectrograph would likely lead to real progress on understanding broad Ly candidates and their relationship to the WHIM: the current data suffer from limited signal-to-noise ratios, and this can cause blends, for example, to mimic smooth and broad Ly features. However, a more sensitive UV spectrograph could be used to obtain much higher S/N data. With higher S/N, the shape of a Ly profile can be carefully inspected to check whether the absorption is truly a single broad Gaussian or if it shows asymmetries and signs of blended component structure. The Cosmic Origins Spectrograph, which is now built and awaiting installation in the Hubble Space Telescope, is ideal for this topic and indeed would be very useful for all of the topics presented in this brief review.
Acknowledgements.
This work was supported by NASA through the Long-Term Space Astrophysics grant NNG 04GG73G.References
- [Aguirre et al. (2001)] Aguirre, A., Hernquist, L., Schaye, J., Weinberg, D.H., Katz, N., & Gardner, J. 2001, ApJ 560, 599
- [Aracil et al. (2005)] Aracil, B., Tripp, T. M., Bowen, D. V., Prochaska, J. X., Chen, H.-W., & Frye, B. L. 2005, MNRAS, submitted
- [Bahcall et al. (1992)] Bahcall, J. N., Jannuzi, B. T., Schneider, D. P., Hartig, G. F., & Green, R. F. 1992, ApJ, 397, 68
- [Bechtold et al. (2002)] Bechtold, J., Dobrzcki, A., Wilden, B., Morita, M., Scott, J., Dobrzcka, D., Tran, K.-V., & Aldcroft, T. L. 2002, ApJS, 140, 143
- [Benítez et al. (2004)] Benítez, N. et al. 2004, ApJS, 150, 1
- [Bergeron (1986)] Bergeron, J. 1986, A&A, 155, L8
- [Bergeron & Boissé (1991)] Bergeron, J. & Boissé 1991, A&A, 243, 344
- [Blanton et al. (2003)] Blanton, M.R. et al. 2003, ApJ 592, 819
- [Blitz et al. (1999)] Blitz, L., Spergel, D. N., Teuben, P. J., Hartmann, D., & Burton, W. B. 1999, ApJ, 514, 818
- [Bond et al. (2001)] Bond, N. A., Chuchill, C. W., Charlton, J. C., & Vogt, S. S. 2001, ApJ, 562, 641
- [Bowen et al. (1995)] Bowen, D. V., Blades, J. C., & Pettini, M. 1995, ApJ, 448, 634
- [Bowen et al. (2002)] Bowen, D. V., Pettini, M., & Blades, J. C. 2002, ApJ, 580, 169
- [Cardelli et al. (1993)] Cardelli, J. A., Federeman, S. R., Lambert, D. L., & Theodosiou, C. E. 1993, Ap.J., 416, L41
- [Cardelli et al. (1991)] Cardelli, J. A., Savage, B. D., & Ebbets, D. C. 1991, ApJ, 383, L23
- [Cen & Ostriker (1999)] Cen, R. & Ostriker, J. P. 1999, ApJ, 514, 1
- [Charlton & Churchill (1998)] Charlton, J. C., & Churchill, C. W. 1998, ApJ, 499, 181
- [Chen et al. (1998)] Chen, H.-W., Lanzetta, K. M., Webb, J. K., & Barcons, X. 1998, ApJ, 498, 77
- [Chen et al. (2001)] Chen, H.-W., Lanzetta, K. M., Webb, J. K., & Barcons, X. 2001, ApJ, 559, 654
- [Chen & Prochaska (2000)] Chen, H.-W., & Prochaska, J. X. 2000, ApJ, 543, L9
- [Churchill, Kacprzak, & Steidel (2005)] Churchill, C. W., Kacprzak, G. G., & Steidel, C. C. 2005, these proceedings
- [Churchill, Steidel, & Vogt (1996)] Churchill, C. W., Steidel, C. C., & Vogt, S. S. 1996, ApJ, 471, 164
- [Colless et al. (2001)] Colless, M., et al. 2001, MNRAS, 328, 1039
- [Cowie et al. (1995)] Cowie, L. L., Songaila, A., Kim, T.-S., & Hu, E. M. 1995, AJ, 109, 1522
- [Cristiani (1987)] Cristiani, S. 1987, A&A, 175, L1
- [Danforth & Shull (2005)] Danforth, C. W., & Shull, J. M. 2005, ApJ, 624, 555
- [Davé et al. (1999)] Davé, R., Hernquist, L., Katz, N., & Weinberg, D. 1999, ApJ, 511, 521
- [Ellison, Mallen-Ornelas, & Sawicky (2003)] Ellison, S. L., Mallen-Ornelas, G., & Sawicky, M. 2003, ApJ, 589, 709
- [Gelb & Bertschinger (1994)] Gelb, J. M., & Bertschinger, E. 1994, ApJ, 436, 467
- [Giovanelli & Haynes (1989)] Giovanelli, R., & Haynes, M. P. 1989, ApJ, 346, L5
- [Heckman et al. (2000)] Heckman, T. M., Lehnert, M. D., Strickland, D. K., & Armus, L. 2000, ApJS, 129, 493
- [Heckman et al. (2002)] Heckman, T. M., Norman, C. A., Strickland, D. K., & Sembach, K. R. 2002, ApJ, 577, 691
- [Henry, Edmunds, & Köppen (2000)] Henry, R. B. C., Edmunds, M. G., & Köppen, J. 2000, ApJ, 541, 660
- [Hobbs et al. (1993)] Hobbs, L. M., Welty, D. E., Morton, D. C., Spitzer, L., & York, D. G. 1993, ApJ, 411, 750
- [Impey, Petry, & Flint (1999)] Impey, C. D., Petry, C. E., & Flint, K. P. 1999, ApJ, 524, 536
- [Jannuzi et al. (1998)] Jannuzi, B. T. et al. 1998, ApJS, 118, 1
- [Jenkins et al. (2005)] Jenkins, E.B., Bowen, D.V., Tripp, T.M. & Sembach, K.R. 2005, ApJ, 623, 767
- [Jenkins et al. (2003)] Jenkins, E. B., Bowen, D.V., Tripp, T.M., Sembach, K. R., Leighly, K. M., Halpern, J. P., & Lauroesch, J. T. 2003, AJ, 125, 2824
- [Kilborn et al. (2000)] Kilborn, V. A. et al. 2000, AJ, 120, 1342
- [Lanzetta et al. (1995)] Lanzetta, K. M., Bowen, D. V., Tytler, D., & Webb, J. K. 1995, ApJ, 442, 538
- [Le Brun et al. (1997)] Le Brun, V., Bergeron, J., Boisse, P. & Deharveng, J.M. 1997, A&A, 321, 733
- [Maller et al. (2003)] Maller, A. H., McIntosh, D. H., Katz, N., & Weinberg, M. D. 2003, ApJ, 598, L1
- [Martin (2005)] Martin, C. L. 2005, ApJ, 621, 227
- [Minchin et al. (2005)] Minchin, R. et al. 2005, ApJ, 622, L21
- [Morris et al. (1993)] Morris, S. L., Weymann, R. J., Dressler, A., McCarthy, P. J., Smith, B. A., Terrile, R. J., Giovanelli, R., & Irwin, M. 1993 ApJ, 419, 524
- [Morris et al. (1991)] Morris, S. L., Weymann, R. J., Savage, B. D., & Gilliland, R. L. 1991, ApJ, 377, L21
- [Oosterloo & van Gorkom] Oosterloo, T. & van Gorkom, J. 2005, A&A, 437, L19
- [Penton, Stocke, & Shull (2004)] Penton, S. V., Stocke, J. T., & Shull, J. M. 2004, ApJS, 152, 29
- [Pilyugin, Thuan, & Vílchez (2003)] Pilyugin, L. S., Thuan, T. X., & Vílchez, J. M. 2003, A&A, 397, 487
- [Prochaska et al. (2002)] Prochaska, J. X., Henry, R. B. C., O’Meara, J. M., Tytler, D., Wolfe, A. M., Kirkman, D., Lubin, D., & Suzuki, N. 2002, PASP, 114, 933
- [Prochaska et al. (2003)] Prochaska, J. X., Howk, J. C., & Wolfe, A. M. 2003, Nature, 423, 57
- [Richter et al. (2004)] Richter, P., Savage, B. D., Tripp, T. M., & Sembach, K. R. 2004, ApJS, 153, 165
- [Rigby, Charlton, & Churchill (2002)] Rigby, J. R., Charlton, J. C., & Churchill, C. W. 2002, ApJ, 565, 743
- [Rupke, Veilleux, & Sanders (2002)] Rupke, D. S., Veilleux, S., & Sanders, D. B. 2002, ApJ, 570, 588
- [Sargent et al. (1980)] Sargent, W. L. W., Young, P. J., Boksenberg, A., & Tytler, D. 1980, ApJS, 42, 41
- [Savage et al.(2005a)] Savage, B. D., Lehner, N., Wakker, B. P., Sembach, K. R., & Tripp, T. M. 2005, ApJ, 626, 776
- [Savage et al. (2002)] Savage, B. D., Sembach, K. R., Tripp, T. M., & Richter, P. 2002, ApJ, 564, 631
- [Savage et al. (2000)] Savage, B. D., et al. 2000, ApJS, 129, 563
- [Schneider (1989)] Schneider, S. E. 1989, ApJ, 343, 94
- [Sembach et al. (2001)] Sembach, K. R., Howk, J. C., Savage, B. D., Shull, J. M., & Oegerle, W. R. 2001, ApJ, 561, 573
- [Sembach et al. (2004)] Sembach, K. R., Tripp, T. M., Savage, B. D., & Richter, P. 2004, ApJS, 155, 351
- [Sembach et al. (2005)] Sembach, K. R. et al. 2005, The Baryonic Structure Probe: Characterizing the Cosmic Web of Matter Through Ultraviolet Spectroscopy, an Origins Probe concept study submitted to NASA, May 13, 2005
- [Shull, Tumlinson, & Giroux (2003)] Shull, J. M., Tumlinson, J., & Giroux, M. L. 2003, ApJ, 594, 107
- [Spinrad et al. (1993)] Spinrad, H. et al. 1993, AJ, 106, 1
- [Steidel (1994)] Steidel, C.C. 1994, in G. Meylan (ed), QSO Absorption Lines, ESO Astrophys. Symp., p. 139
- [Steidel et al. (1994)] Steidel, C.C., Dickinson, M. & Persson, S.E. 1994, ApJ 437, L75
- [Steidel et al. (2002)] Steidel, C.C., Kollmeier, J. A., Shapley, A. E., Churchill, C. W., Dickenson, M., & Pettini, M. 2002, ApJ, 570, 526
- [Stocke et al. (2004)] Stocke, J. T., Keeney, B. A., McLin, K. M., Rosenberg, J. L., Weymann, R. J., & Giroux, M. L. 2004, ApJ, 609, 94
- [Stocke et al. (1995)] Stocke, J. T., Shull, J. M., Penton, S., Donahue, M., & Carilli, C. 1995, ApJ, 451, 24
- [Stoughton et al. (2002)] Stoughton, C., et al. 2002, AJ, 123, 485
- [Tripp et al. (2001)] Tripp, T. M., Giroux, M. L., Stocke, J. T., Tumlinson, J., & Oegerle, W. R. 2001, ApJ, 563, 724
- [Tripp et al. (2005)] Tripp, T. M., Jenkins, E. B., Bowen, D. V., Prochaska, J. X., Aracil, B., & Ganguly, R. 2005, ApJ, 619, 714
- [Tripp et al. (1998)] Tripp, T. M., Lu, L., & Savage, B. D. 1998 ApJ, 508, 200
- [Tripp & Savage (2000)] Tripp, T. M., & Savage, B. D. 2000, ApJ, 542, 42
- [Tripp, Savage, & Jenkins (2000)] Tripp, T. M., Savage, B. D., & Jenkins, E. B. 2000, ApJ, 534, L1
- [Tripp et al. (2002)] Tripp, T. M., et al. 2002, ApJ, 575, 697
- [Tumlinson et al. (2005)] Tumlinson, J., Shull, J. M., Giroux, M. L., & Stocke, J. T. 2005, ApJ, 620, 95
- [Tytler et al. (1995)] Tytler, D., Fan, X. M., Burles, S., Cottrell, L., Davis, C., Kirkman, D. & Zuo, L. 1995, in QSO Absorption Lines, ed. G. Meylan (Berlin: Springer), p289
- [Williger et al. (2005)] Williger, G. M., Heap, S. R., Weymann, R. J., Davé, R., Ellison, E., Carswell, R. F., Tripp, T. M., & Jenkins, E. B. 2005, ApJ, in press (astro-ph/0505586)