Radiative Transfer Effects on the LyForest
Abstract
Strong observational evidence for a fluctuating ultraviolet background (UVB) has been accumulating through a number of studies of the H and He Ly forest as well as accurate IGM metallicity measurements. UVB fluctuations could arise both from the inhomogeneous distribution of the ionizing sources and/or from radiative transfer (RT) through the filamentary IGM. In this study we investigate, via numerical simulations, the role of RT effects such as shadowing, self-shielding and filtering of the ionizing radiation, in giving raise to a fluctuating UVB. We focus on possible detectable signatures of these effects on quantities derived from Lyforest spectra, as photoionization rate fluctuations, () parameter distributions and the IGM temperature at . We find that RT induces fluctuations up to 60% in the UVB, which are tightly correlated to the density field. The UVB mean intensity is progressively suppressed toward higher densities and photon energies above 4 Ryd, due to the high He opacity. Shielding of overdense regions () from cosmic He ionizing radiation, produces a decreasing trend of with overdensity. Furthermore we find that the mean value inferred from H -He Lyforest observations can be explained only by properly accounting for the actual IGM opacity. We outline and discuss several implications of our findings.
keywords:
cosmology: theory - radiative transfer - methods: numerical - cosmology: diffuse radiation - cosmology: large scale structure of Universe1 Introduction
The lack of the Gunn-Peterson trough in the spectra of quasars at redshift indicates that the intergalactic medium (IGM) after that epoch is photoionized by the ubiquitous presence of a metagalactic ionizing radiation, also known as the ultra-violet background (UVB).
Usually, studies of the so-called Lyforest (the highly ionized absorbers that give rise to the absorption lines in quasar spectra) assume the UVB to be spatially uniform, with the same intensity and spectral shape everywhere in the universe at a given redshift. This is a good approximation if the sources of the UVB radiation are uniformly distribued in space, as long as the attenuation volume is large enough to contain a fair sample of both the sources and the attenuating structures (Zuo 1992). This last condition would imply a low cosmic optical depth, , to ionizing photons after reionization (). The cosmic optical depth should be low enough infact, to insure the attenuation lengh to be larger than the typical separation between sources producing the UVB, which is Mpc (comoving) for quasars and more than an order of magnitude less for galaxies. The relative contribution of these two populations to the UVB is unclear. Different independent studies found that the contribution from galaxies should be at least comparable to that of quasars (Giallongo etal. 1997; Shull etal. 1999; Steidel etal. 2001; Kim etal. 2001, Bianchi etal. 2001, Sokasian etal. 2003) in the redshift range 2-3. As a caveat, we recall that Meiksin (2005) has pointed out that QSOs might dominate the UVB in the redshift range ; according to his study QSO counts are highly uncertain near and seem to be sufficient to account for the UVB at . The expected signature of a significant contribution from galaxies is a considerable softening of the UVB spectrum compared to previous models assuming quasars as the sole sources of ionizing radiation (Haardt & Madau, 1996).
Although the IGM at is highly ionized, cosmic mildly overdense regions which give rise to the Lyforest contain enough neutral hydrogen and singly ionized helium to significantly attenuate the Lyman continuum flux from the sources of the UVB. As a result, the condition might not be fulfilled. For this reason, the metagalactic ionizing flux has been modeled starting from the intrinsic spectra of the ionizing sources, subsequently filtered through the IGM (Haardt & Madau, 1996; Fardal, Giroux & Shull, 1998). In brief, these calculations consist in reprocessing the UVB photons in a clumpy photoionized universe, by solving the radiative transfer (RT) equation in one dimension. The space density along the photon propagation direction, and physical properties of the sources (as well as of those of the absorbing clouds) are assumed as the average of the observed values, and the spectral redshift evolution of the UVB, assumed to be uniform in space, is derived.
Clustering of the ionizing sources and scattering in their emission properties, together with inhomogeneities in the IGM density field can introduce significant fluctuations both in the intensity and spectral shape of the UVB.
Indeed, increasingly strong observational evidence for a significantly variable metagalactic ionizing radiation has been accumulating through a number of studies of the H and He Lyforest. In a highly photoionized gas the ratio of He to H column density, defined as the parameter, is proportional to the ratio of H to He photoionization rates (Fardal etal. 1998): .
Kriss etal. (2001) and Shull etal. (2004) analyzed the FUSE observations of the fluctuating He absorption toward the bright quasar HE 2347-4342 at . Using H Lydata from Keck and HIRES (High Resolution Echelle Spectrograph), they found an H counterpart for more than 50% of the He absorption lines. The measured values, cover a wide range from 1 to 1000 (with an average ). Analogous observations of the He Ly forest towards HS 1700+6416, by Remiers etal. (2004), reveal a similar variation. The large scatter is a clear signature from an ionizing background which is significantly fluctuating throughout the IGM. Shull etal. (2004) pointed out two important points: (i) a small scale variability (on typical scales of , corresponding to about 1 Mpc comoving at ), and (ii) an observed correlation of high- (i.e. soft ionizing spectra) absorbers with low density regions (voids in the H Lydistribution). The authors further suggest that these effects, confirmed by Reimers etal. (2004) observations, might be caused either by spatial/spectral fluctuations of the ionizing sources on scales of 1 Mpc, or by RT effects trough a filamentary IGM whose opacity variations control the penetration of 1-5 Ryd radiation over 30-40 Mpc distances (a combination of the two is also possible).
Although recent HST (Hubble Space Telescope) observations (Telfer etal. 2002) show a broad distribution of QSO spectral indices from 0 to 3 ( representing the quasar spectrum) this spread could hardly be advocated to explain the small scale fluctuations. The reason is that the QSO mean separation ( Mpc comoving at ) exceeds by far the characteristic scale of about 1Mpc on which the variations are observed. Radiative transfer through an inhomogeneous medium appears to be the most natural origin for such fluctuations. In turn, these might result from a number of effects, such as shadowing, self-shielding and filtering of the radiation. All these effects act on the same scales of the inhomogeneities in the IGM, thus on scales smaller than 1 Mpc. It is then important to study the correlation function of both and with the density fluctuations.
The first attempt to account for the RT effects of a background ionizing radiation was by Nakamoto, Umemura & Susa (2001). They focused on the reionization of an inhomogeneous universe looking at the evolving configuration of the neutral hydrogen distribution, but not directly at the fluctuations in the radiation field. Nonetheless, emphasizing the deviations of the neutral hydrogen distribution obtained in their simulation from the case of a perfectly transparent medium embedded in a uniform ionizing background, they indirectly stressed the importance of RT effects such as self-shielding and shadowing by translucent regions, which indeed have been well reproduced by their simulations.
Radiative transfer is furthermore expected to have some effect on the IGM temperature. Previous studies (Abel & Haehnelt 1999; Bolton etal. 2004) focused on the effects of RT on the temperature evolution during reionization, i.e. behind an ionization-front (I-front) expanding in a neutral or mildly ionized IGM. These analysis have shown that radiative transfer can boost the mean gas temperature with respect to the case in which an instantaneous, uniform reionization occurs (i.e. its OT counterpart), as a consequence of filtering effects. In fact, the ionizing spectrum across the I-front becomes harder as it expands further from the ionizing source, because most of the low-energy photons (having higher cross-sections) are absorbed by recombining atoms inside the H region, and its photo-heating power increases accordingly. The overall predicted RT effects are: (i) an enhancement of the IGM temperature by a factor after reionization; (ii) increased scattering in temperature-density relation; (iii) a strong hardening of the metagalactic ionizing flux after the He reionization. Here we consider the more stationary situation in which the mean ionization level in the simulation volume remains roughly constant; hence strong RT signatures on the IGM temperature are not expected. Nevertheless we look for a systematic dependence of the photoheating rates on the density.
So far, much of the work in studing UVB fluctuatios have be done to asses the effects produced by inhomogeneous distribution of ionizing sources, almost neglecting or just approximately including the effects of RT through the filamentary IGM. Zuo (1992a,1992b) first developed a theory to deal with the fluctuations produced by randomly distributed ionizing sources, in terms of the probability distribution of the ionizing UV radiation field (Zuo, 1992a) and of its two-point correlation function (Zuo, 1992b). Meiksin & White (2003) made a step forward by appying Zuo’s formalism to ionizing sources distribution derived via numerical simulations of structures formation. A few groups have studied, trough numerical simulations, the effects on the statostical properties of the Lyforest of UVB fluctuations induced by source clustering or non-uniform emissivity properties as light-cone effects, QSO time variability, lifetime and spectral index scattering. Gnedin & Hamilton (2002) first investigated via RT simulations the effects of UVB fluctuations induced by quasars inhomogeneous distribution, on the matter power-spectrum inferred from the observed/simulated trasmissivity of the Lyforest (Croft etal. 1999). By comparing the mock spectra from RT simulations and from simulations assuming photoionization equilibrium with a uniform UVB, they found the effects of RT to be negligible for the power spectrum; nevertheless it is interesting to notice that, in order to match the observed transparency of the IGM, the mean photoionization rate required when including properly RT, has to exceed by 20% the one required in the OT approximation. Meiksin & White (2004) attempted to quantify the UVB fluctuations and examined the possible effects on the power spectrum and auto-correlation function of the Ly forest. They calculate the UVB intensity smearing out the radiation emitted from a discrete distribution of QSOs in the simulated volume, within an attenuation length whose evolution with redshift is evaluated modeling the gas density distribution with a PM simulations. Their calculation separately adds the contribution of Lyman Limit System (LLS), which are not resolved in numerical simulations, on the basis of their observed statistical properties. Croft (2004) uses a time-independent ray tracing algorithm to model the space density of ionizing radiation produced by QSOs at , neglecting its feedback on the ionization state of the IGM. The study is based on N-body simulations and prescriptions must be used to relate the dark matter density and the H optical depth. McDonald etal. (2004) use a rough self-shielding approximation, in which the background radiation in each cell is attenuated by the column density of that cell; shadowing and filtering effects are neglected altogether. The most relevant outcome of these studies for the present one is that UVB fluctuations induced by the discreteness of the UVB sources could be only relevant at high redshifts and on large scales. Below the importance of such fluctuations rapidly decreases, as a consequence of the increase of which smooths the flux at a given position over a larger ensemble of sources.
For this reasons we take here a complementary, and still unexplored, approach which consists in the investigation of UVB fluctuations introduced by the RT effects mentioned above. We focus on possible detectable signatures of these effects on quantities derived from Lyforest spectra,as photoionization rate fluctuations, the temperature-density relation and parameter distributions. To this aim we have performed RT simulations, applying CRASH (Maselli, Ferrara & Ciardi, 2003, hereafter MFC03) to a cosmological density field exposed to an ionizing background radiation characterized by a spatially constant emissivity. Such radiation field, by interacting with the filaments of the cosmic web, is rapidly turned into a fluctuating one. The rest of the paper is devoted to study and quantify this effect.
2 Numerical simulations
The aim of the present study is to estimate the effects of RT on the metagalactic ionizing radiation and the resulting effects induced in the physical properties of the IGM. The present study is focused at . We have exposed a snapshot at a fixed redshift of a cosmological density field to an (initially) uniform ionizing radiation field. The density field has been derived with the numerical code described in Marri & White (2002), a modified, multiphase version of the entropy-conserving SPH code GADGET2 (Springel etal. 2001). Several algorithms have been designed to reduce artifacts which occur in cold, dense gas clouds embedded in a hot diffuse halo; the code includes a new implementation of feedback which allows supernova energy to be channeled effectively into the heating of diffuse gas and the evaporation of cold clouds. A multiphase description of the interstellar medium is adopted, based on an explicit separation of protogalactic gas into diffuse and dense (star forming) components which is able to suppress star formation, reheat cold gas and drive outflows from galactic disks. The presence of a UV background produced by QSOs is included in the OT approximation following Haardt & Madau (1996) from which the IGM temperature and ionization state are calculated assuming photoionization equilibrium.
We use here a snapshot at from a simulation which has been used and analyzed in previous works of our group (Bruscoli etal. 2003; Maselli etal. 2003; Fangano, Ferrara & Richter 2005, in preparation). These studies have shown that the statistical properties of the IGM, e.g. the PDF of the transmitted Lyflux, are correctly reproduced. The simulation uses particles in a 10.5 comoving Mpc box (corresponding to a mass resolution of in gas) and assumes a CDM cosmological model with , , , and ; periodic boundary conditions are assumed.
2.1 Radiative Transfer
We have performed the RT calculation using the code CRASH . A detailed description of the code, its performances and several test problems can be found in MFC03, to which we defer the interested reader. In the present study we neglect the effects of cosmological expantion; this choise is motivated by the fact that the light crossing time of an attenuation leght ( Mpc) is roughly one tenth of the Hubble time at the redshift of interest. We have exposed the density field obtained from the SPH simulation to a UVB radiation with spatially constant emissivity. The UVB is subsequently modified as it propagates in the filamentary density field by self-shielding, shadowing and spectral filtering effects, finally resulting in a fluctuating field. The RT simulation has been evolved for a physical time, . This choice has been made, after some experiments, to guarantee that numerical convergence of the solution is achieved. It has to be noticed that here the simulation time does not correspond to a physical evolution of the background, but it is the time required for the gas ionization and temperature to reach equilibrium in the self-consistently radiation field shaped by radiative transfer. In the following we discuss two crucial, albeit somewhat technical, points concerning a new implementation of a uniform radiation background in CRASH and its flux calibration within the simulation.
2.1.1 Simulating a uniform UVB
The algorithm described in MFC03 for the implementation of the presence of a uniform background radiation in the simulation box has been improved in several ways. In the original implementation, background radiation was modeled by allowing box boundary cells to emit photons packets with the prescribed UVB spectral energy distribution. Although this choice is suitable for some type of problems it cannot match the high accuracy required by the present study. To better fulfill such requirement we have devised a new implementation in which all cells in the box, but the ones with overdensity , behave as UVB radiation sources, in the sense that they emit photon packets111It is important to notice that here the cells emitting photons are not meant to reproduce physical sources of UV radiation; the adopted method aims at reproducing a uniform UVB in the simulated volume, within a Monte Carlo ray tracing scheme.. The threshold on the overdensity is meant to preserve the effect of self-shielding in high density regions and galactic halos. For definiteness, we take the value corresponding to the typical overdensity of collapsed halos at the virial radius. The exact value of depends on the density profile of the halo; it can be shown that it is for a isothermal profile and it is for the NFW profile (Navarro, Frenk & White 1996). In this paper, has been assumed. We adopt periodic boundary conditions, so that packets can travel trough the simulation box for a number of cycles, , given by the ratio between the mean free path of ionizing photons, , and the physical size, , of the simulated volume. We have derived an estimate for , running a benchmark simulation aimed at evaluating the statistical distribution of the mean free paths of photons -whose frequencies are distributed according to the HM96 spectrum- in the assigned density field. For this purpose, in the benchmark simulation we just follow the propagation of photons packets, i.e. not cosidering their effect on the gas properties; due to the statistical treatment of the packet energy deposition inherent to the Monte Carlo scheme (see MFC03), we define as “absorbed” a packet whose initial energy has been depleted by . In Fig. 1 we show the mean free path distribution obtained from such numerical experiment. The solid curve corresponds to the mean free path obtained by including the opacity of both hydrogen and helium absorbers, whereas the dotted curve corresponds to H opacity only. The mean (median) values of the two distributions are 300 and 495 (199 and 306) Mpc comoving. This shows that the He contribution to the diffuse IGM opacity is significant. The above value of , for H opacity, is consistent with that inferred from Fan etal. (2002), Mpc at , by comparing observations of high resolution quasar spectra with semianalytical models of the Lyforest with a simple schematic model of the IGM opacity based on a peak statistics approach.
Guided by this finding, and given our box size, we fix . The agreement of the simulated and observed mean values of further supports the choice above. Periodic boundary conditions allow us to simulate volumes smaller than the mean free path of neutral hydrogen ionizing photons, having thus a higher spatial resolution, without much information loss. However, we make clear that the main aim of the present study are RT effects on scales of Mpc, the characteristic scale of IGM filaments; no attempt is made to describe large scale fluctuations induced by non-uniform distribution of the UVB sources.

According to the CRASH Monte Carlo algorithm tracking photon packet propagation, the mean number of crossings events per cell is given by
| (1) |
where is the total number of photon packets in a single run, and the number of grid cells in the computational volume222In the OT case, a single packet crosses typically cells, thus the total number of crossings in a simulation is for cells (for more details see MFC03). The new background implementation has been tested by running a simulation in which we force the condition . Although, when not inlcuding cosmological expansion, the assumption would imply an infinite radiation filed (i.e. the Olber’s paradox), we get around this problem by fixing to a finite value. All the parameters then, are setted in order to reproduce the required UVB intensity, as described in Sec. 2.1.1. Ideally, in this case the intensity of the UVB should be perfectly uniform, as fluctuations caused by photon-matter interactions (absorption and scattering), redistributing the ionizing radiation in space and frequency, are suppressed. In practice, uniformity can be achieved only up to a certain accuracy level, due to finite number packet statistics, which produces noise fluctuations in the emission pattern. The amplitude of such fluctuations decreases with increasing , which is however constrained by computational expense. We have performed different test runs increasing to accurately quantify the amplitude of such fluctuations. The computed r.m.s. of the fluctuations, , around the mean value of the UVB intensity as a function of the numerical parameters of the run are shown in Table 1. The value for and are the same adopted for the actual cosmological simulations333The intrinsic scatter , associated to the numerical resolution of a given run, does not depend on the physical time of the simulation, , and on the intensity of the UVB which, as discussed later, depends on the normalization factor .. These fluctuations are due to the photon shot noise intrinsic to the adopted numerical algorithm.
From Tab. 1, we see that runs at higher resolution (i.e. higher values of ) are characterized by a small intrinsic scatter of the radiation intensity: , decreases from 20% for , to less than 1% for . At the same time, we have also checked that during these test runs closely matches the theoretical value (as expressed in eq. 1). As a good compromise between accuracy and computational time we will adopt for the cosmological RT simulations. This value, according to the above tests, guarantees that the ionizing radiation field fluctuations are uniformly distributed within a precision level of 4%. Hence, larger fluctuations seen in the simulation outputs can be safely attributed to RT effects.
| Uniformity Tests | |||||
| 10 | 128 | 20 % | |||
| 10 | 128 | 10 % | |||
| 10 | 128 | 4% | |||
| 10 | 128 | 1% | |||
| Calibration Tests | |||||
| 10 | 32 | 1% | |||
| 5 | 32 | 10% | |||
| 10 | 64 | 3% | |||
| 10 | 128 | 2% |
2.1.2 UVB intensity calibration
Particular attention must be devoted to the ionizing flux calibration. The problem arises when the emissivity has to be related to the photon content of packets originating from a cell, as it is not obvious how convert the latter into the specific flux units in which is usually assigned (erg s-1 cm-2 Hz-1 sr-1 ). To overcome the problem we have devised a calibration technique which turned out to be highly precise and straightforward.
Given a set of simulation parameters, , , and , the intensity of the radiation field can be tuned by varying the number of (monochromatic) photons contained in a packet, , at emission. We express this quantity as follows
| (2) |
where is the calibration factor444Note that the calibration factor has physical dimensions s-1, i.e. a photoionization rate. to be determined and is the mean time interval between two subsequent crossings of a cell by photon packets; for the second equality see MFC03. A nice feature of the previous expression is its scaling with the simulation parameters. Once the intensity and the UVB spectral shape are fixed, the factor is the same for any combination of the numerical parameters. An order of magnitude for can be derived by equating the theoretical and numerical estimates of the ionization fraction increment, , for a cell during the time interval . We will consider here, for the sake of clarity, the case of a pure hydrogen gas and a monochromatic spectrum (). The theoretical value is given by
| (3) |
similarly, the numerical one can be expressed as
| (4) |
where is the cell optical depth, , with being the cell volume, is the total number of H-atoms in the cell; the last equality holds for the OT case (). By equating the two expressions, one can write as
| (5) |
where we have used , with being the H photo-ionization cross-section at the Lyman limit. For the RT simulations used in this study, kpc; hence for a typical s-1, s-1.
The determination of the exact value of for the general case of a H/He gas and of a
non-monochromatic
spectrum, is not as straightforward.
The adopted strategy has been to select a cell at the center of the simulation box, to assign it
physical
properties characteristic of the hydrodynamic simulation (we choose cm-3, K,
the value at the
photo-ionization equilibrium with the assigned value). We assume for all
remaining cells in the box;
this guarantees that the ionizing radiation field impinging on the target cell
has not been modified either in intensity or spectral shape by RT effects.
In the above configuration, we run CRASH to compute the H fraction in the central cell
and the average photoionization rate, , by counting the cumulative number of ionizing
photons absorbed in a given simulation time. We then tune the value of by requiring that the
and
estimated values match the assigned values within an accuracy of 1%.
We find that s-1 (HM96) corresponds to
s-1.
As discussed above, the same value of reproduces correctly the assigned ionization rate
(for a given UVB spectral shape) independently of the values of , , and ,
provided that is evaluated according to eq. 2.
The degree of accuracy is shown in the bottom part of Tab 1 where the r.m.s. deviation, ,
of the distribution of with respect to the theoretical value
is shown for different combinations of the numerical parameters.
The scatter is always less than 10%, depending on the resolution of the run.
The calibration method adopted results thus to be accurate and stable.
In actual RT simulations, we should further account for the opacity of the IGM in order to reproduce
at each cell the correct ionizing flux555With “correct” we mean the ionizing flux which
reproduces the assigned mean opacity.; the photon content of packets is infact depleted
while it propagates trough the box, due to non-zero opacity of the IGM distribution. To counteract
this effect, we boost the normalization parameter by 2.3; the exact value of this factor has been
determined empirically, requiring that the mean opacity of the simulated volume is the same for the
OT (zero-opacity) and RT cases. If the calibration factors for the RT and OT cases are related
according to the equation , it corresponds to an effective
optical depth .
Extracting the correct physical values of the photoionization and photoheating rates (at each cell) from the RT simulation is not straightforward as well. Again, we need a reference OT simulation (with the same numerical parameters) in order to calibrate correctly these values. The OT and RT simulations differ (i) in the normalization factor, and related as above, and (ii) in the fact that for the OT we do not allow for absorption to occur. In both RT and OT cases, summing up the contribution given at each crossing event, the following relations hold:
| (6) | |||||
where is the index counting the crossing events in a given cell and is the frequency of the packet at the -th crossing; and are a scaling factor which depend only by the numerical parameters and are the same for both the OT and RT cases. The other symbols follow the conventional notation. Having determined as seen above, we can safely impose that (e.g. s-1) and accordingly derive , which in turns is used to derive the correct physical values at each cell in the box.
Finally, we mention that in the RT simulation the emission of diffuse radiation from recombining gas (estimated to account for about 30% of the ionizing background at ) has been turned off inside CRASH. This is done to prevent double-counting of such radiation, which is already included in the Haardt & Madau (1996) computation of the adopted UVB.
3 Results
In this section we present the results of the RT simulations. We first analyze the amplitude of RT-induced fluctuations as traced by UVB photo-ionization and photoheating rates of the three absorbers H , He and He . These are defined as
| (7) |
the index denotes the absorbing species and the averages are done over all the cells at the end of the RT simulation We then focus on the effects of such fluctuations on the IGM distribution, the -density relation and on the IGM temperature-density relation, with the aim of identifying possible detectable signatures.
3.1 UVB fluctuations
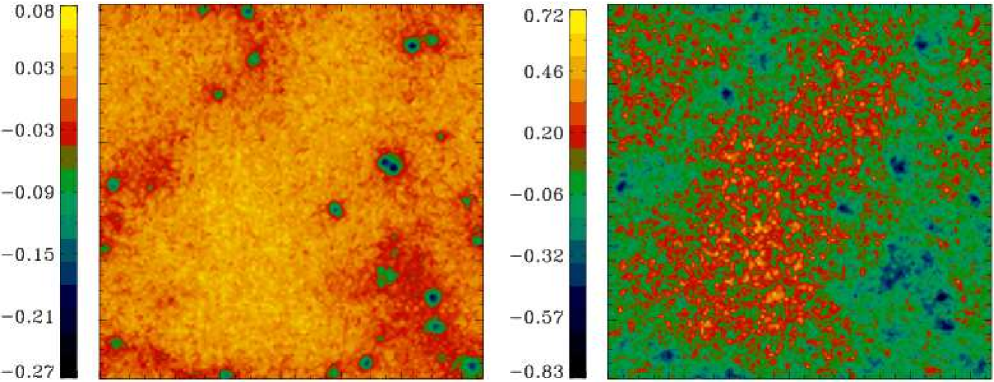
Spatial fluctuations of the H and He photoionization rates are shown in Fig. 2
on a slice across the RT simulation box of (physical) depth kpc,
corresponding to one grid cell ( and in the left and
right panels respectively). RT effects result in significantly fluctuating photo-ionization
rates on scales of few comoving Mpc, whose structure is closely linked to the underlying density
fluctuations. As shown in the following, typically regions of low overdensity
(say , often referred to as voids) have ,
whereas overdense regions tend to have negative fluctuations.
Comparing the two maps one can also notice that fluctuations are much stronger than
those of . In general, though, RT induces fluctuations of several tens of percent of
the mean ionizing flux in both species. Such deviations from a homogeneous radiation field are
produced by the combined action of shielding and shadowing effects. Although these features can be
qualitatively understood from simple physical arguments, their quantitative evaluation can only be
done through full 3D RT simulations.
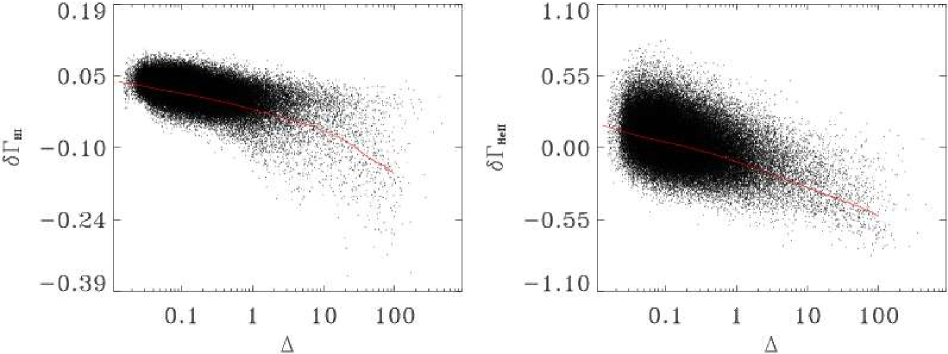
In order to make the above statements more quantitative, we show in Fig. 3 the
and distributions as a function of the local
overdensity, . Each point in the plots corresponds to a cell of the simulated grid.
The plot in left panel shows clearly how the mean amplitude of H photoionization rate fluctuations
varies with overdensity, passing from positive values (of the order of a few percent) in the voids
to negative ones, larger than 10%,
towards higher densities. , shown in the right panel, exhibits an analogous
trend, although with larger excursion, with values % (%)
at the lowest (highest) density boundaries of the density range.
Deviations from the mean value can be as high as 20% and 60%, for and
respectively, in structures corresponding to overdensities with ,
where therefore the UVB intensity appears to be significantly suppressed.
The steeper dependence and larger scatter of – relation reflect the
fact that the universe is more opaque in He than in H .
Note also that in underdense regions can exceed by more than 40%
the volume averaged mean value, .
We focus now on mildly overdense regions, such as filaments, which give raise to absorption lines in
the Lyforest. These regions are exposed to roughly the mean photoionization rates for H ,
but the photoionization of He is here suppressed by about 20% with respect to the mean value.
This fact suggests that the He fraction, which both in numerical simulations and data
interpretation of Ly forest is usually derived
assuming photoionization equilibrium with a uniform UVB , is probably seriously overestimated.
The ultimate physical nature of the decreasing trend of , with H ,He , with density is a mixture of self-shielding and shadowing effects.
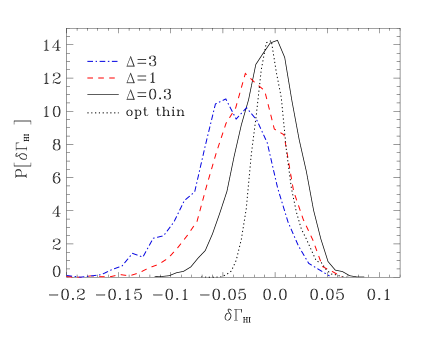
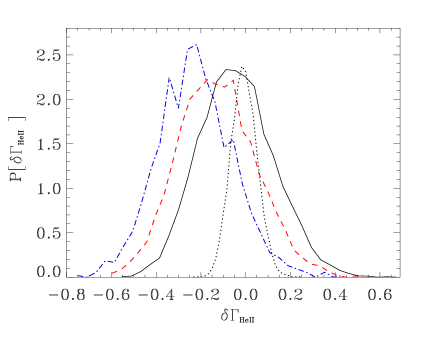
It is very instructive to inspect the probability distribution function of the fluctuations at fixed overdensities. Fig. 4 shows such distribution at (solid, dashed and dotted-dashed curves respectively), for (left panel) and (right panel). The distributions resemble Gaussian curves whose mean value decreases with . The shift of the mean is caused by the increasing importance of the shielding and it is about five times larger for He () than for H (): as explained above, the attenuation of the flux due to the structures shielding is more prominent above 4 Ryd due to the larger opacity at those energies. In the case of H , a significant increase of the distribution width is observed towards larger overdensitites; contrarily, the three distributions obtained for show a similar dispersion. This results from the fact that, while the H optical depth of the IGM is dominated by rare, overdense regions, the He optical depth is non-negligible even in voids. This fact is confirmed if one look at the probability distribution for the mean free path of photons at 1 Ryd and 4 Ryd, shown in Fig. 5 (solid and dotted-dashed curves respectively). For 1 Ryd photons the mean free path distribution is highly peaked at roughly 60 Mpc 666Note that these values are lower than the ones in Fig. 1, because here we consider only photons at the H and He ionization threshold., showing that these photons are preferentially absorbed in high density peaks. The 4 Ryd photons mean free path distribution is wider and has a mean value of about 7 Mpc, which is a clear indication for a significant contribution of voids to the He opacity.
We have checked that the dispersion of the flux distribution shown in Fig. 4 do not result
from spurious effects introduced by the emission algorithm,
comparing the distributions above with the analogous ones derived in the OT
simulation777We use the OT simulation we have run to test the accuracy of the uniformity of the
emission algorithm, with , having thus the same numerical resolution of the RT
simulation.. The latter are shown in the panels of Fig. 4 by the dotted curves for
(as the OT distribution does not depend on overdensity, we only plot this case).
For visualization purposes, these curves have been normalized so that their peaks match the peaks
of the corresponding RT distributions.
The dispersion of these distributions is obviously unphysical as it represents the intrinsic error of
the numerical algorithm, which is of the the order of 4%
for H , as already pointed out in Table 1, and more than twice for He (%);
the higher numerical dispersion for He is due to the worse spectral sampling of energies above 4 Ryd
888The number of photon packets emitted with energy above the He threshold is roughly one
order of magnitude smaller less than ..
Both for H and He , the dispersion induced by RT in the photoionization rates values is
significantly larger than the one originating purely from numerical noise and, in the case of H ,
it is increasingly so at larger values of . Hence, this confirm that the effects we are
finding are of physical origin and the corresponding fluctuations are a truly genuine by-product
of UVB filtering through cosmic density structures.
We have found so far that RT effects induce significant fluctuations in the metagalactic ionizing
radiation; these could be effective in deviating the actual IGM ionization state from the one
inferred assuming a uniform ubiquitous UVB and hence should be accounted for in high-precision
studies of the Lyforest. However, performing full RT simulations is extremely expensive and
prohibitive in maximum-likelihood analysis.
The tight correlation between fluctuations in the photo-ionization rate and
overdensity can be used to correct the commonly adopted mean values derived
in calculations (e.g. Haardt & Madau 1996; Fardal etal. 1998) carried out with 1D RT calculations,
under the assumption of photo-ionization equilibrium with a uniform UVB.
In order to cast our results in a form which could be useful for future studies, we have computed the
photo-ionization rate correction factors from our RT simulations. These are defined as
| (8) |
their mean values are plotted in Fig. 6 for H , He and He (upper, central and bottom panel respectively) along with the associated 1 errors. These results are valid for . In a companion paper we will study the evolution with redshift of the UVB fluctuations. RT transfer effects are generally more important in overdense regions, although the correction factors derived in the present study can be reliably used for , a limit dictated both by mass resolution of the SPH simulation and shot noise associated to the limited number of photon packets. Differently from the case of H , for which is close to unity, the mean value of the correction factors for He and He are and (averages are evaluated over the overdensity range ) . This reflects mean opacities differences among the three absorbers. In the OT approximation, the IGM opacity is higher in H than in He and, as a consequence, the UVB increase necessary to match the IGM H Lyopacity in RT simulations results in a higher mean . For the same reason, as the IGM OT opacity is by far higher in He than in H , is highly suppressed with respect to the OT value when RT effects are properly treated. Again, our results demonstrate that the contribution to the He opacity of the diffuse IGM (as opposed to discrete absorbing systems) is relevant. The same arguments explain the steeper dependence of the He correction factor from density and its larger dispersion.
A few remarks are worth concerning the correction factors. First, we remind that the adopted flux
calibration (see Sec. 2) guarantees that the mean H opacity in the RT simulation box corresponds
to that at the photoionization equilibrium with the uniform UVB in the
OT case. We found that the mean value of in the two
cases (RT and OT) are the same within few percent.
Gnedin & Hamilton (2002) found a different result: in order to reproduce the same H LyIGM
trasmissivity in their RT calculation, they require a 20% higher volume-averaged H photoionization rate with respect to the OT case.
The reasons for the discrepancy are not clear, but
it is probably due to the fact that while Gnedin & Hamilton (2002) account for RT during the
reionization process (i.e. ionizing a neutral gas), here we re-distribute the ionizing radiation
accounting for RT effects in a pre-ionized gas.
Meiksin & White (2003) also found that fluctuations required a
boost in the radiation field,
comparable to Gnedin & Hamilton; however, in a more recent
investigation, they found that the boost is
reduced to few percents at 4 when correlations in the
radiation field due to RT were included (Meiksin & White 2004). This
seems to suggest that the boost depends on the magnitude of the correlations
in the radiation field.
It is furthermore interesting to note that can be fitted with a power-law of the form:
with .
In the calculation of optical depth to the Lyscattering given by (e.g. Weinberg etal. 1999;
McDonald & Miralda-Escudé 2001)
| (9) |
it is thus possible to account for UVB spatial fluctuations adopting a corrected index , i.e. , i.e. in a variation of the apparent IGM equation of state. Even though at we found a negligible variation of (only few percents), we expect the above effect to be important at higher redshifts.


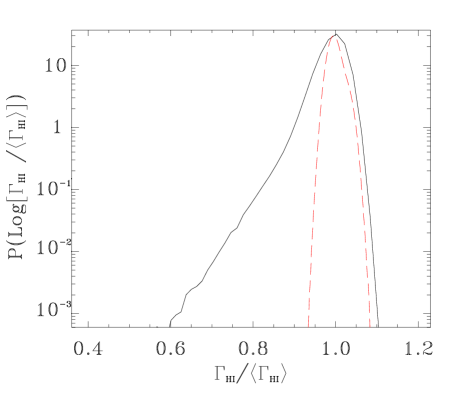
Fig. 7 shows the PDF of the hydrogen photo-ionization rates resulting from our simulations (normalized to the volume averaged mean value ): the solid curve refers to the full RT simulation, whereas the dashed one has been obtained from the OT simulation. The RT distribution is much wider than the OT one, showing an extended tail towards lower values of which is caused by shadowing and shielding due to gaseous structures. There is also a slight increase of cells seeing an ionizing flux above the mean, occurring as a result of the flux amplitude redistribution. Further interesting aspects can be inferred comparing the UVB fluctuations produced by RT effects and those induced by the inhomogeneous distribution of rare quasars, assumed to be the dominant UVB sources, derived by Croft (2004) and shown in Fig. 5 of that paper. Even in that case, the PDF of the ionizing flux appears to be asymmetric: however, the asymmetry is in the opposite direction. A similar result is obtained by Meiksin & White (2003) as shown in Fig.4 of that paper, where the effects of the sources stochastic distribution in space are studied. In fact, fluctuations originating from sources inhomogeneous distribution are characterized by considerable power in the high flux tail ( times the mean value), corresponding to the enhanced ionizing flux in the vicinity of the luminous ionizing sources. Hence, both RT and inhomogeneous distribution of ionizing sources, contribute to broaden the radiation field distribution, basically increasing the power on opposite sides of the flux mean value. It is important to realize though, that the spatial character of these fluctuations is very different. The signature of source inhomogeneities is seen on scales comparable to the typical separation of the sources, i.e. Mpc for quasars. RT-induced fluctuations are instead found on a few (comoving) Mpc scales.

To clarify this point we have studied the spatial correlation of RT-induced UVB fluctuations, computing the correlation function by using the following formula:
| (10) |
Here the index and span all the cells in the simulation grid, is the comoving
separation between the -th and -th cells and the number of pair cells whose
distance is the range .
We have similarly calculated a second correlation function, , obtained from a
random realization of , in the same volume and with the same mean as
. The difference,
is plotted in
Fig. 8 for H and He . The zero-point of these functions gives the characteristic
correlation comoving length of the RT induced fluctuations, which is found to be roughly
5.5 and 3.5 Mpc comoving for H and He respectively.
Although this results should be checked for convergency, by performing
analogous simulations in larger volumes with the same resolution
(Meiksin & White 2004), they seem to be plausible. The correlation
scales we have found, could be associated with the typical
size/separation of filaments (i.e. mildly overdense regions) of the
IGM which are clearly identified in the maps presented in
Fig. 2. These structures have optical depths both in hydrogen
and helium, and therefore can leave their imprint in the fluctuation field.
Meiksin & White (2003,2004) have shown that inhomogeneous sources
(assumed to be QSOs) distribution can produce correlations which are
significant even on small scales. Both the RT induced fluctuations and the
ones originating from disomogeneous sources distribution, should then
be treated at once, in order to derive a correlation function which is
reliable for the study of the pixel fluxes statistic in high- QSOs
spectra.
3.2 He /H ratio fluctuations
The parameter, defined as the ratio of He to H column density of an absorber in the Lyforest, gives informations on the intensity and on the spectral properties of the metagalactic ionizing radiation. Assuming photoionization equilibrium in highly ionized H/He gas, the following expression can be derived (Fardal etal. 1998):
| (11) |
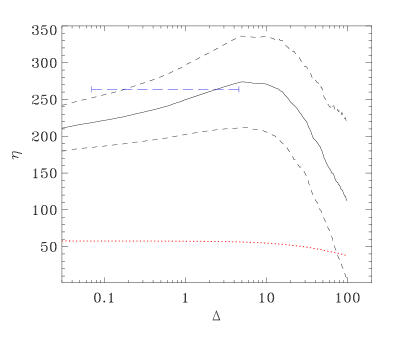
Here cm3 s-1 and cm3 s-1 are the case recombination rate coefficients, appropriate in the low density regime. We have derived the parameter, for each cell of the numerical grid, from eq. 11 with and taken from the RT simulation. The results are plotted in Fig. 9: the solid (dotted) line represents the mean value derived in the RT (OT) simulation and the dashed curves are the 1 r.m.s. deviations of the distribution.
In the OT case, as expected , shows little dependence on as a result of the fact that the three ratios in eq. 11 are roughly constant. The ratio between the recombination coefficients slowly evolves with temperature, ; the ratio does not vary by construction if the UVB is spatially uniform; finally for , the gas is fully ionized thus is roughly constant. At higher densities at the photoionization equilibrium starts to decrease because He recombines faster than H and is roughly one order of magnitude lower than . The mean value from our OT simulation is , consistent with the expected (from eq. 11) value, .
RT effects are crucial to detexrmine the actual values of in the IGM. This can be seen by comparing the previous results for the OT case with the ones from full RT calculations, shown in the same figure; the two cases differ from each other both in the mean value and in shape. The RT mean value is larger than the OT one by about a factor of four because of the different amount of attenuation suffered by H and He ionizing radiation. As we have seen in Sec. 3, the He ionizing flux is strongly suppressed with respect to the OT case, because even the most underdense voids in photoionization equilibrium with the UVB contains enough He to remove photons with energies above 4 Ryd from the background radiation; the higher values we find for in the RT simulation can be interpreted in terms of the ratios between the correction factors discussed in Sec 3. The parameter shows furthermore a strong dependence on overdensity: slowly grows with density, reaches a maximum around and then rapidly declines to values which are still well in excess of the OT ones. In fact, at low density is roughly constant, and density dependence is governed by . This ratio increases with density as the universe is more opaque in He than in H , as already discussed. When the density is high enough, decreases more rapidly than the growth of , due both to the latter effect and to He recombining faster than H . This results in the inverted trend of the dependence on .
We compare our results from RT simulations with observational data by Reimers etal. (2004) in
Fig. 9, using the relation (Madau, Ferrara & Rees 2001).
As the data released are still preliminary and could suffer from errors associated with the analysis
technique (Fechner etal. , 2004; private communication), we here consider the mean value for
, as at higher densities the uncertainties on the values inferred from observations
become very high and metal line contamination is a problem.
Although it is important to point out that the dispersion in the data is substantial.
The comparison in Fig. 9 clearly shows that the mean value from observations
is inconsistent with the OT results, i.e. the expected value for the case of a spatially uniform UVB.
The higher measured value can be explained when accounting for the radiative transfer of the
metagalactic ionizing radiation.
Furthermore at , the RT simulation output predicts an –
anti-correlation. This suggests that RT effects, such as shielding and
shadowing, can explain the systematically lower values observed in mildly/highly overdense
absorption systems.
According to our results, the lower values of associated with high density absorption systems
do not arise, as previously thought, from the hardening of UVB spectrum produced by the presence of
local hard-spectrum sources. Instead, we find that the metagalactic ionizing flux is softer in
filaments than in voids. Our preferred interpretation of the trend seen in Fig. 9
is that the – anti-correlation is a direct consequence of the fact that in high
density regions increases much faster than .
3.3 Effects on the IGM Temperature

Fluctuations in the photoionization rates could in principle affect the IGM temperature. In this paragraph we attempt to quantify such effect. The upper panel in Fig. 10 shows the ratio between the temperature in the RT simulations, , and the initial temperature, (estimated in the SPH simulation in the OT limit), along a random line of sight (los); the lower panel shows the overdensity, , along the same los. The temperature ratio is significantly different from unity only in regions corresponding to high density peaks, where the temperature shows deviations of the order of %. The temperature in low density regions is basically unchanged. This is not at odd with previous studies (Abel & Haehnelt 1999; Bolton etal. 2004) on the effect of radiative transfer on the temperature of the ionized gas, which indeed suggested that RT can be effective in boosting the IGM temperature by at least factor of two during the reionization process or in general when considering the photo-ionization of a neutral gas, with respect to the case in which a the gas is instantaneously photoionized and photo-heated by a uniform UVB. As discussed in the Introduction, such boost in temperature is due to the filtering of the ionizing radiation. The latter is significantly harder at the edge of the I-front, getting harder as the I-front moves further from the source; this is due to the fact that the large cross-section, low-energy photons are selectively absorbed inside the HII region where they compensate for recombinations. The harder spectrum at the I-front yields a higher heating power with respect to analogous one provided by the unfiltered spectrum and, due to the long characteristic cooling times, the low density IGM retains memory of the initial higher temperature phase. In the present study we focus on the transfer of ionizing radiation in a ionized IGM, thus the above filtering process is not efficient due to the low IGM opacity. In order to account properly for RT effects on the IGM temperature, a full and consistent simulation of the reionization process including RT is necessary.
4 Conclusions
In this study we have analyzed the effects of radiative transfer on the spatial and spectral properties of the ionizing metagalactic radiation at a fixed redshift, . So far, this is the first attempt to study the properties of the ultraviolet background radiation including full 3D RT calculations. Such investigation is motivated by the increasing number of observational evidences for a fluctuating UVB (Shull etal. 2004; Reimers etal. 2004). These observations reveal significant fluctuations on scales of few comoving Mpc, which could hardly be originated from the inhomogeneous spatial distribution of ionizing sources, whose mean separation is Mpc for QSOs at .
We here neglect the UVB inhomogeneities arising from source
clustering or non-uniform emissivity properties (which have been shown to be relevant
only on large scales and at high redshift, i.e. ), and focus on smaller scales.
Our approach consists in performing RT simulations, applying CRASH to a cosmological
density field exposed to an ionizing background characterized by a spatially constant emissivity.
Such radiation field, by interacting with the filaments of the cosmic web, is rapidly turned into a
fluctuating one.
We found that RT effects result in relevant
fluctuations in the photo-ionization rates,
whose structure is closely linked to the underlying density
fluctuations. The UVB mean intensity, and thus its ionizing power,
is progressively suppressed moving towards higher densities;
such effect is found to be more important for radiation above
4 Ryd, due the high He opacity of the universe.
The ultimate physical nature of the decreasing trend of photoionization rates
with density is a mixture of self-shielding and shadowing effects.
Interestingly, we found that the dispersion increases towards
higher (from 8% at to roughly 15% at ),
which is not the case for . The differences in H and He photo-ionization
rates originate from the fact that while the H optical depth of
the IGM is dominated by rare, overdense regions, the He optical depth is non-negligible
even in voids.
We further found that shielding in overdense regions
() from He ionizing radiation, produces a
decreasing trend of the parameter with overdensity;
this trend has already emerged from
observational data (Shull etal. 2004; Reimers etal. 2004).
According to our results, the lower values of associated
with high density absorption systems do not arise, as previously
thought, from the hardening of UVB spectrum produced by the
presence of local hard-spectrum sources. Instead, RT simulations suggest
that the – anti-correlation is a direct consequence of the
fact that in high density regions increases much
faster than .
A stronger support for the presence of RT induced UVB fluctuations comes
from the comparison of the mean value from Reimers etal. (2004) observations
and our numerical results. We find in fact, that the mean observed value is too high
to be consistent with a uniform UVB and that, accounting properly for the filtering of
the ionizing radiation trough the translucent IGM, it is possible to reconcile the
observational data with theoretical expectations.
The results of the present study have several implications. In fact, the wealth of information derived from the Ly forest has been so far extracted under the assumption of a uniform UVB, both from real and simulated data; the current results should thus be revised in order to account for the more realistic scenario of a fluctuating UVB. We give some examples. The matter power-spectrum inferred from the observed/simulated trasmissivity of the Lyforest (Croft etal. 1999) provides direct information on the primordial universe. UVB fluctuations could affect the power-spectrum shape derived in previous studies. Gnedin & Hamilton (2002) used RT simulations to study the effects of UVB fluctuations induced by quasars inhomogeneous distribution on the matter power-spectrum (however, they did not look directly at the RT effects on the spatial UVB fluctuations), not finding a significant variation. However, the question of whether small scale fluctuations in the UVB could be relevant in determining the shape of the matter power-spectrum needs further study.
The UVB fluctuations we have found could provide an alternative explanation, other than He reionization occurring at , for the observed fluctuations in the parameter as well as for the ones in the abundance ratio C /Si . As discussed in the Introduction, it has been shown that current data are not inconsistent with a scenario in which He is completely reionized as early as by thermal radiation produced in collapsing structures (Miniati etal. 2004); the observed fluctuating C /Si abundance ratio and the He patchy opacity could be then explained as direct consequences of UVB fluctuations arising from radiative transfer of the metagalactic ionizing radiation trough the filamentary IGM.
Although in the present study we have carried out our analysis at , we can infer that the UVB fluctuations become more important towards higher redshift due to the increasing mean opacity of the IGM. In a future work we plan to investigate accurately the redshift evolution of UVB fluctuations.
Finally, it is worth reminding that we have neglected the possible contribution
of local sources embedded in high density regions to the ionizing radiation.
The relative contribution of local sources embedded in quasar absorption line systems,
which are commonly identified as high density peaks in the IGM,
has been subject of recent debate.
Schaye (2004) argued that contribution from local source dominates the
UV metagalactic radiation in these absorption system, while
Miralda-Escudè (2004) has come to the opposite conclusion, deriving
an upper limit to the importance of local sources by a consequence
of the surface brightness conservation.
The problem seems still unsettled and it would be desiderable
to further investigate it via numerical RT simulations including
both the UVB and the local sources radiation.
Acknowledgments
We acknowledge T. Choudhury & F. Haardt for enlightening discussions, C. Fechner, J.Tumlinson and M. Shull for providing observational data. This work was partially supported by the Research and Training Network ‘The Physics of the Intergalactic Medium’ set up by the European Community under the contract HPRN-CT2000-00126 RG29185. The work has been completed at the Kavli Institute for Theoretical Physics Program “Galaxy-IGM Interactions”, whose hospitality is warmly acknowledged.
References
- [1] Abel, T. & Haehnelt, M. G., 1999, ApJ, 502, L13
- [2] Bardeen, J. M., Bond, J. R., Kaiser, N. & Szalay, A. S., 1986, ApJ, 304, 15
- [3] Bolton, J. S., Meiksin, A. & White, M., 2004, MNRAS,348,L43
- [4] Bianchi, S., Cristiani, S. & Kim, T. S., 2001, A&A, 376, 1B
- [5] Bruscoli, M., Ferrara, A., Marri, S., Schneider, R., Maselli, A., Rollinde, E. & Aracil, B. 2002, , MNRAS, 343, L45
- [6] Croft, R. A. C., Weinberg, D. H., Pettini, M., Hernquist, L. & Katz, N., 1999, ApJ, 520,1
- [7] Croft, R. A. C., 2004, ApJ, 610, 642
- [8] Fan, X., Narayanan, V. K., Strauss, M. S., White, R. L., Becker, R. H., Pentericci, L. & Rix, H. W., 2002, ApJ, 123, 1247
- [9] Fangano, A., Ferrara, A. & Richter, P., 2005, in preparation
- [10] Fardal, M. A., Giroux, M. L. & Shull, M. J., 1998, AJ, 115, 2206
- [11] Fechner, C. & Reimers, D., 2004, astro-ph/0410622
- [12] Giallongo, E., Fontana, A. & Madau, P., 1997, MNRAS, 289, 629
- [13] Gnedin, N. Y. & Hamilton, A. J. S., 2002, MNRAS, 334, 107
- [14] Haardt, F. & Madau, P., 1996, ApJ, 461, 20
- [15] Kim, T. S., Cristiani, S. & D’Odorico, S., 2001, A&A, 373, 757
- [16] Kriss, G. A. etal. , Science, 293, 1112
- [17] Madau, P., Ferrara, A. & Rees, M. J., 2001, ApJ, 555, 92
- [18] Marri, S. & White, S. D. M., 2003, MNRAS, 345,561
- [19] Maselli, A., Ferrara, A. & Ciardi, B. 2003, MNRAS, 345, 379
- [20] Maselli, A., Ferrara, A., Bruscoli, M., Marri, S., Schneider, R., 2004, MNRAS, 350L, 21
- [21] McDonald, P., Seljak, U., Cen, R., Bode, P. & Ostriker, J. P., 2004, astro-ph/0407378
- [22] McDonald, P., Miralda-Escud , J., 2001, ApJ, 549, 11
- [23] Meiksin, A. & White, M., 2003, MNRAS, 342, 1205
- [24] Meiksin, A. & White, M., 2004, MNRAS, 350, 1107
- [25] Meiksin, A., 2005, MNRAS, 356, 596
- [26] Miniati, F., Ferrara, A., White, S.D.M. & Bianchi, S., 2004, MNRAS, 348, 964
- [27] Miralda-Escudè, J., 2004, ApJ, 620, 91
- [28] Nakamoto, T., Umemura, M., Susa, H., 2001, MNRAS, 321, 593
- [29] Navarro, J. F., Frenk, C. S. & White, S. M., 1996, ApJ, 462, 563
- [30] Reimers, D., Fechner, C., Kriss, G., Shull, M., Baade, W.M., Songaila, A., Simcoe, R., 2004, astro-ph/0410588
- [31] Schaye, J., 2004, astro-ph/0409137
- [32] Shull, M. J., Tumlinson, J., Giroux, M. L., Kriss, G. A. & Reimers, D., 2004, ApJ 600, 570
- [33] Shull, M. J., Roberts, D., Giroux, M. L., Penton, S. V., & Fardal, M. A, 1999, AJ, 115, 2184
- [34] Springel V., Yoshida, N., White, S.D.M., 2001, New Astronomy, 6,79
- [35] Steidel, C. C., Pettini, M. & Adelberger, K. L., 2001, ApJ, 546, 665
- [36] Sokasian, A., Abel T. & Hernquist L., 2003, MNRAS, 340, 473
- [37] Telfer, R. C., Zheng, W., Kriss, G. A. & Davidsen, A. F., 2002, ApJ, 565,773
- [38] Weinberg, D., 1999, elss.conf, 346
- [39] Zuo, L., 1992a, MNRAS, 258, 36
- [40] Zuo, L., 1992b, MNRAS, 258, 45