HI Observations of Flat Galaxies
S. N. Mitronova1, W. K. Huchtmeier2, I. D. Karachentsev1, V. E. Karachentseva3, and Yu. N. Kudrya3
1 Special Astrophysical Observatory, Russian Academy of Sciences, Nizhnii Arkhyz, Karachai-Cherkessian Republic, 357147 Russia
2 Max Planck Institut für Radioastronomie, Auf dem Hügel 69, D-53121 Bonn, Germany
3 Astronomical Observatory, Kiev National University, Observatorna ul., Kiev, 304053 Ukraine
Abstract
We present the HI observations of 94 flat spiral galaxies from RFGC (the Revised Flat Galaxy Catalog) and 14 galaxies from 2MFGC (the 2MASS selected Flat Galaxy Catalog) performed with the 100-m radio telescope in Effelsberg (Germany). HI fluxes, heliocentric radial velocities, and HI line widths are given for 65 detected galaxies. We present a mosaic of HI profiles. We calculated some of the global parameters of the galaxies and analyzed the linear correlations between them. The ratios of the total (indicative) masses of the galaxies to their luminosities lie within the range 0.4 with a mean of 3.8 (), and the mean mass fraction of neutral hydrogen is 13%. Upper limits are given for the radio fluxes from 43 undetected galaxies.
Key words: galaxies, radio sources.
INTRODUCTION
One of the central problems in extragalactic astronomy is to study the collective motions of galaxies by analyzing their peculiar velocities . Here, is the measured radial velocity of the galaxy reduced to the frame of the microwave background radiation (Kogut et al. 1993), and is the distance to the galaxy (in km s-1 ) determined independently of its radial velocity. The main method of determining for spiral galaxies is based on the Tully–Fisher (1977) relation between the absolute parameters of the galaxy (its luminosity and linear diameter) and the width of the 21-cm HI line. Karachentsev (1989) showed that the late-type edge-on spiral galaxies are appropriate objects for investigating the large-scale streams for several reasons: (1) the flat, disklike galaxies have a simple structure; (2) applying the simple selection criterion based on the apparent axial ratio to them yields a morphologically homogeneous sample; (3) the detection probability of such galaxies in the 21-cm line is very high; and (4) since the flat galaxies are located mostly outside groups and clusters, their structure remains undistorted and they are not affected by large virial motions. To compile our catalog of flat edge-on galaxies, we conducted an all-sky survey using blue and red POSS-I and ESO/SERC maps. FGC (the Flat Galaxy Catalog; Karachentsev et al. 1993) includes galaxies with apparent axial ratios and angular diameters . The updated and supplemented version of this catalog, RFGC (the Revised Flat Galaxy Catalog; Karachentsev et al. 1999a), contains 4236 galaxies and is one of the best samples for studying the large-scale cosmic streams of galaxies (Karachentsev et al. 2000a; Kudrya et al. 2003), since it is highly homogeneous and has the required completeness (Kudrya et al. 1996, 1997; Feldman et al. 2003).
Extensive high-accuracy measurements of the radial velocities ( ) and HI-line widths ( ) are needed to use the Tully–Fisher (TF) relation. For this purpose, flat galaxies were observed with large radio telescopes: the 305-m radio telescope in Arecibo (Giovanelli et al. 1997) and the 100-m radio telescope in Effelsberg (Huchtmeier et al. 2005). Makarov et al. (2001) measured the rotation curves of 300 flat galaxies with the 6-m telescope at the Special Astrophysical Observatory of the Russian Academy of Sciences. Based on original observations and published data, Karachentsev et al. (2000b) compiled a list of peculiar velocities for 1327 RFGC galaxies. The published homogeneous and complete near infrared all-sky survey , 2MASS (the Two Micron All-Sky Survey; Skrutskie et al. 1997), opened up new opportunities for studying the collective motions of galaxies based on the near-infrared TF relation (Karachentsev et al. 2002; Kudrya et al. 2003). 2MASS J-, H-, and K-band photometry is available for 71% of the RFGC galaxies, but the radial velocities and HI-line widths were reliably measured only for 25% of them. A program of HI observations of RFGC galaxies with the 100-m radio telescope in Effelsberg was initiated in 2001. Huchtmeier et al. (2005) published the first results of observations of 268 galaxies.
Analyzing the properties of RFGC galaxies in the near infrared (2MASS) and comparing them with optical data allowed the selection criteria to be developed for compiling a new catalog of flat galaxies based on 2MASS. The 2MFGC all-sky catalog of disklike galaxies (Mitronova et al. 2004) contains IR photometry and LEDA and NED identifications for 18020 objects with XSC 2MASS axial ratios .
In this paper, we present the observations of 94 RFGC galaxies and the test observations of 14 2MFGC galaxies performed with the 100-m radio telescope in the fall of 2004.
HI OBSERVATIONS
The HI observations of RFGC galaxies have been performed with the 100-m radio telescope in Effelsberg (Germany) since October 2001. Using the optical and infrared parameters of flat galaxies, we estimated their expected radial velocities and selected objects in the working range of the telescope 9500 km s-1 for our observations. We also included in our observational application galaxies for which the radial velocities were known from optical observations with an accuracy lower than 30 km s-1 and no HI line width measurements were available. We also included in our list galaxies for which it was necessary to improve and (or) , since they deviated by more than 3 from the regression line in the TF relation or the magnitudes of their peculiar velocities were larger than 3000 km s-1 . The spectroscopic observations with the 100-m radio telescope were performed in full energy mode (ON-OFF), combining the measurements in the source’s field with those in the comparison field whose location was earlier than the galaxy’s location by 5 min in right ascension. The beam FWHM of the telescope at 21 cm is 9.3′. The temperature of the system consisting of two receivers is . The 1024-channel autocorrelator was divided into four 256-channel bands shifted in frequency by 11 MHz. To cover the entire velocity range from 250 to 9050 km s-1 , we used 12.5-MHz-wide bands. In this case, the resulting resolution per channel is 10.4 km s-1. For galaxies with known radial velocities, we used 6.25-MHz-wide bands, which provided a resolution of 5.2 km s-1 per channel. We used weighted (or equivalent) smoothing for most galaxies to improve the signal-to-noise ratio. From one to five scans were made for each galaxy; the total accumulation time was about per galaxy.
RESULTS OF THE OBSERVATIONS
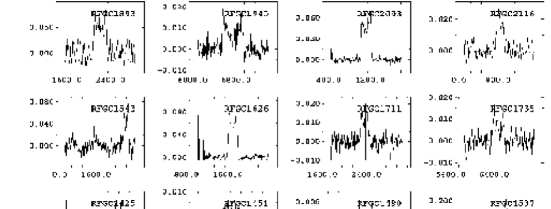
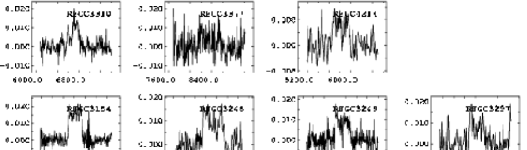
Figures 1 and 2 show the HI profiles for the detected RFGC and 2MFGC galaxies. No HI line profiles are shown for two RFGC galaxies (2553 and 4160) with complex spectra.
Table 1 contains the results of our radio observations of 94 RFGC galaxies as well as cataloged (optical) data. The columns of this table give the following: (1) the RFGC galaxy number; (2) the J2000.0 equatorial coordinates; (3) the major and minor diameters () in arcmin corresponding to the band 25 mag arcsec-2 isophote; (4) the total B -band magnitudes; (5) the morphological type in the Hubble system, where Sb = 3, Sc = 5, and Sd = 7; (6) the HI-line flux in Jy km s-1 corrected for the ratio of the galaxy’s angular diameter to the telescope’s aperture; (7) the maximum flux and the rms noise error in mJy; (8) the mean heliocentric radial velocity and its error in km s-1; (9–11) the HI line widths at 50%, 25%, and 20% of the peak flux level in km s-1 . The colons (:) in the table mark unreliable measurements with low signal-to-noise ratios and a complex structure of the HI profiles.
Table 2 gives data for 2MFGC galaxies. The content of its columns corresponds to Table 1 with the following differences: (1) the galaxy names in known catalogs taken from the NED electronic database; (3) the major and minor diameters () in arcmin taken from the LEDA electronic database; and (4) the total -band magnitudes taken from the LEDA database.
For 40 RFGC and three 2MFGC galaxies, we failed to find the HI line in the range of radial velocities under study. Tables 1 and 2 give only the rms noise errors for these galaxies. The undetected galaxies probably lie outside the working spectral range, although it may well be that the HI fluxes from some of the nearby early-type galaxies could be below the instrumental detection threshold.
GLOBAL OPTICAL AND HI PARAMETERS OF GALAXIES
We calculated the global characteristics of 54 detected RFGC galaxies using the radio observations and optical parameters from Table 1. As the distance indicator, we used the radial velocity of the galaxy reduced to the centroid of the Local Group,
| (1) |
where and are the Calactic coordinates, and is the measured heliocentric radial velocity; the apex parameters, = 316 km c-1, , , were taken from the paper by Karachentsev and Makarov (1996). We calculated the HI mass as
| (2) |
where the Hubble constant was assumed to be = 75 km s-1 Mpc-1, and is the detected 21-cm flux in Jy km s-1 corrected for the ratio of the galaxy’s angular diameter to the telescope’s aperture. We calculated the indicative mass of the galaxy within the standard optical diameter from the relation
| (3) |
where is the hydrogen line width corrected for turbulence (Tully and Fouq́ue 1985) and relativistic broadening, . The angular diameter was reduced to the 25 mag arcsec-2 isophote (Kudrya et al. 1997) and corrected for the Galactic absorption and the galaxy’s tilt (). To calculate the luminosity, we use the relation
| (4) |
where the total magnitude was corrected for the absorption (Schlegel et al. 1998) and the galaxy’s tilt .
Table 3 gives the calculated global parameters. Its columns contain the following: (1) the RFGC galaxy number; (2) the radial velocity reduced to the centroid of the Local Group; (3) the HI line width at 50% of the peak flux level corrected for turbulence and relativistic broadening; (4) the logarithm of the HI mass, ; (5) the logarithm of the galaxy’s indicative mass, ; (6) the logarithm of the galaxy’s total luminosity, ; (7) the HI mass-to-luminosity ratio, ; (8) the galaxy’s total mass-to-luminosity ratio, . (the values in columns 4–8 are in solar units); and (9) the mass fraction of neutral hydrogen, .
According to Table 3, the mean depth of the sample is 4823 km s-1 , which corresponds to 64 Mpc. The total mass-to-luminosity ratios of the galaxies lie within the range 0.4–8.2 with a mean of 3.8, and the mass fraction of neutral hydrogen is 13%.
Karachentsev et al. (1999b) performed a statistical analysis of the global parameters for 587 flat spiral galaxies using the observations performed by Giovanelli et al. (1997) with the Arecibo radio telescope. Huchtmeier et al. (2005) presented the statistics of global parameters for 121 detected RFGC galaxies.
Table 4 gives the statistical characteristics of the distribution of 50 flat galaxies in integrated parameters. Comparison of the mean values of all parameters with those for the sample of 121 flat galaxies shows that they are almost equal.
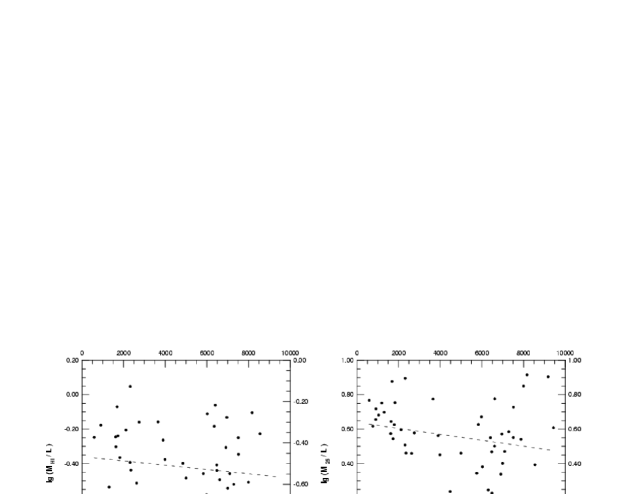
In Figs 3 and 4, the logarithm of the HI mass-to-luminosity ratio and the logarithm of the indicative mass-to-luminosity ratio are plotted against radial velocity for flat galaxies. Since the radial velocity is a distance indicator, it can be noted that and decrease with distance only slightly; i.e., there is virtually no distance selection effect. Arbitrarily oriented spiral galaxies are known to show no variation of with distance either (Roberts and Haynes 1994).
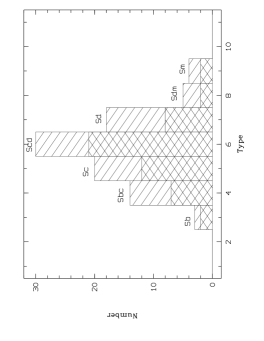
Figure 5 shows the distribution of galaxies in morphological type. All of the 94 RFGC galaxies under study are shown on the histogram, and the types of 54 detected galaxies of them are marked by double hatching. Most of the objects belong to the morphological types , where the detection level is higher.
The data in Table 5 agree with the conclusions of our previous paper (Huchtmeier et al. 2005) that the mean values of the global parameters under consideration do not change within the error limits for galaxies of various morphological types. This conclusion is consistent with the HI observations of edge-on spiral galaxies (Karachentsev et al. 1999b) and arbitrarily oriented spirals of various types (Haynes and Giovanelli 1984) from the catalog of isolated galaxies by Karachentseva (1973).
BIVARIATE DISTRIBUTIONS OF GLOBAL PARAMETERS
The correlations between global parameters lead us to important conclusions about the differences between the properties of the disk structures in giant and dwarf galaxies. The observed differences can characterize the different formation and equilibrium conditions for the gaseous disks and the inequality of the star formation rates and intensities in them. It is also assumed that the contribution of dark matter depends on the linear sizes of galaxies.
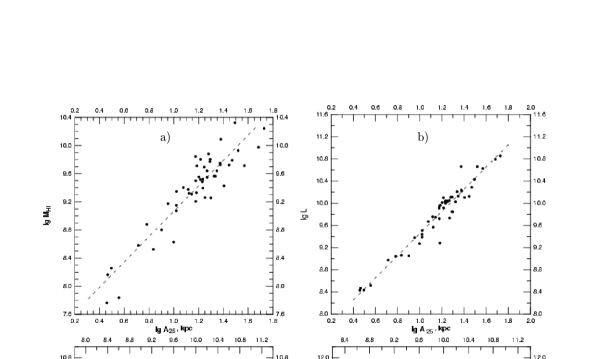
Figures 6 and 7 show the bivariate distributions of global parameters for 50 detected RFGC galaxies, and Table 6 lists the parameters of the linear regression for various relations. The logarithms of the various global parameters of flat galaxies are the variables and . Columns 4 and 5 give the correlation coefficients ) and the standard deviations ; columns 6 and 7 contain the regression parameters and and their standard errors, respectively. Figure 6a and the first row of Table 6 show the relation between the logarithm of the HI mass (in ) ) and the logarithm of the galaxy’s linear diameter (in kpc) calculated from the angular diameter ac using the formula
| (5) |
The linear relation suggests that the HI density in the disks of spiral galaxies is virtually constant and does not depend on the linear size. The conditions for star formation in them appear to have been approximately identical in them. The statistically insignificant decrease in log toward the massive galaxies (row 10 in Table 6) may be due to the internal absorption of the HI flux in the disks of the largest galaxies. Other parameters, the indicative mass and the total luminosity (see rows 2 and 3 in Table 6 and Fig. 6b), also correlate well with the linear diameter.
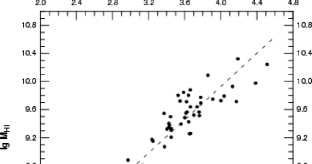
The dependences of the HI mass log and the indicative mass log on the luminosity log show a systematic decrease in from dwarf galaxies to giant spirals (see Figs. 6c and 6d and rows 4 and 5 in Table 6). This is to be expected if the relative abundance of the dark matter in giant galaxies is lower than that in dwarf galaxies.
Since the width of the 21-cm HI line does not depend on the distance to the galaxy, taken as the argument for the bivariate distributions of global parameters, it allows the morphology and luminosity selection effects to be reduced. Figure 6e (row 6 in Table 6) shows the linear relation between the galaxy’s size log (in kpc) and the amplitude of its internal rotation determined as the width of the 21-cm line. The slope of the linear regression in this Tully–Fisher (1977) relation is 1.28 with a standard deviation of 0.15. The correlations between log and log and the 21-cm line width are also well defined; their parameters are listed in rows 7 and 8 of Table 6. We see from Fig. 6f (row 9 in Table 6) that the relative hydrogen abundance increases from giant galaxies to dwarf galaxies in the same way as for arbitrarily oriented spiral galaxies whose luminosities are not affected strongly by internal absorption (Huchtmeier and Richter 1988, Stavely-Smith and Davies 1988).
The relation between the logarithm of the HI mass, log , and the specific angular momentum log ) (see Fig. 7 and row 11 in Table 6) has a high correlation coefficient; the slope of the linear regression is 1.19. Zasov (1974) pointed out that such a relation must hold in the gas-rich disks of spiral galaxies with active star formation. Karachentsev et al. (1999b) corroborated the linear relation between log and log ) for flat galaxies and Zasov’s conclusion that the gaseous disks of galaxies must be near the gravitational stability boundary irrespective of the linear sizes of the galaxies.
ACKNOWLEDGMENTS
We are grateful to Max Plank Institut für Radioastronomie (Effelsberg, Germany) for the observational data obtained with the 100-m radio telescope. This work was supported by the Russian Foundation for Basic Research and Deutsche Forschungsgemeinschaft (DFG) (grant no. 02–02–04012).
REFERENCES
1. H. Feldman, R. Yuszhkievicz, M. Davis, et al., Astrophys. J. 596, L131 (2003).
2. R. Giovanelli, E. Avera, and I. D. Karachentsev, Astron. J. 114, 122 (1997).
3. M. P. Haynes and R. Giovanelli, Astron. J. 89, 758 (1984).
4. W. K. Huchtmeier, Yu. N. Kudrya, I. D. Karachentsev, et al., Astron. Astrophys. (2005) (in press).
5. W. K. Huchtmeier and O. G. Richter, Astron. Astrophys. 203, 237 (1988).
6. I. D. Karachentsev, Astron. J. 97, 1566 (1989).
7. I. D. Karachentsev et al., Astron. Astrophys. (2004) (in press).
8. I. D. Karachentsev, V. E. Karachentseva, Yu. N. Kudrya, et al., Bull. Spec. Astron. Obs. Russ. Acad. Sci. 47, 5 (1999).
9. I. D. Karachentsev, V. E. Karachentseva, and Yu. N. Kudrya, Pis’ma Astron. Zh. 25, 3 (1999b) [Astron. Lett. 25, 1 (1999b)].
10. I. D. Karachentsev, V. E. Karachentseva, Yu. N. Kudrya, et al., Astron. Zh. 77, 175 (2000a) [Astron. Rep. 33, 150 (2000a)].
11. I. D. Karachentsev, V. E. Karachentseva, Yu. N. Kudrya, et al., Bull. Spec. Astron. Obs. Russ. Acad. Sci. 50, 5 (2000b).
12. I. D. Karachentsev, V. E. Karachentseva, and S. L. Parnovskii, Astron. Nachr. 314, 97 (1993).
13. I. D. Karachentsev and D. I. Makarov, Astron. J. 111, 535 (1996).
14. I. D. Karachentsev, S. N. Mitronova, V. E. Karachentseva, Astron. Astrophys. 396, 431 (2002).
15. V. E. Karachentseva, Soobshch. Spets. Astron. Obs. Akad. Nauk SSSR 8, 3 (1973).
16. A. Kogut, C. Lineweaver, G.F. Smoot, et al., Astrophys. J. 419, 1 (1993).
17. Yu. N. Kudrya, I. D. Karachentsev, V. E. Karachentseva, and S. L. Parnovskii, Pis’ma Astron. Zh. 22, 330 (1996) [Astron. Lett. 22, 295 (1996)].
18. Yu. N. Kudrya, I. D. Karachentsev, V. E. Karachentseva, and S. L. Parnovskii, Pis’ma Astron. Zh. 23, 730 (1997) [Astron. Lett. 23, 652 (1997)].
19. Yu. N. Kudrya, V. E. Karachentseva, I. D. Karachentsev, et al., Astron. Astrophys. 407, 889 (2003).
20. S. N. Mitronova, I. D. Karachentsev, V. E. Karachentseva, et al., Bull. Spec. Astron. Obs. Russ. Acad. Sci. 57, 5 (2004).
21. M. S. Roberts and M. P. Haynes, Ann. Rev. Astron. Astrophys. 32, 115 (1994).
22. D. J. Schlegel, D. P. Finkbeiner, and M. Davis, Astrophys. J. 500, 525 (1998).
23. M. F. Skrutzkie, S. E. Schneider, R. Stiening, et al., in The Impact of Large Scale Near-IR Sky Surveys Ed. by F. Garzon et al., (Kluwer, Dordrecht, 1997), Vol. 210, p. 25.
24. L. Stavely-Smith and R.D. Davies, Mon. Not. Roy. Astron. Soc. 231, 833 (1988).
25. R. B. Tully and J. R. Fisher, Astron. Astrophys. 54, 661 (1977).
26. R. B. Tully and P. Fouq́ue, Astrophys. J., Suppl. Ser. 58, 67 (1985).
27. A. V. Zasov, Astron. Zh. 51, 1225 (1974) [Sov. Astron. 18, 730 (1974)].
| RFGC | RA(2000)DEC | |||||||||
|---|---|---|---|---|---|---|---|---|---|---|
| 1 | 2 | 3 | 4 | 5 | 6 | 7 | 8 | 9 | 10 | 11 |
| 161 | 004215.1180940 | 3.36 .30 | 14.5 | 7 | 19.1 | 139 4 | 1553 2 | 192 | 205 | 208 |
| 208 | 005332.6025527 | 1.71 .21 | 15.4 | 6 | 4.2 | 4 | 4843 3 | 250 | ||
| 280 | 011406.7380723 | 1.16 .16 | 16.0 | 5 | 2 | |||||
| 329 | 012737.1510851 | 0.87 .11 | 18.1 | 6 | 2.1 | 23 2 | 6096 11 | 129 | ||
| 411 | 015616.1225404 | 2.23 .27 | 14.9 | 3 | 8.5 | 68 9 | 1828 1 | 229 | 240 | |
| 458 | 020715.4461520 | 1.12 .13 | 16.4 | 7 | 5 | |||||
| 492 | 021732.5113108 | 1.22 .17 | 15.8 | 8 | 3.6 | 32 4 | 3957 4 | 210 | ||
| 493 | 021735.9214554 | 0.95 .09 | 16.6 | 6 | 4.1 | 26 4 | 6423 4 | 264 | ||
| 544 | 023052.8432100 | 1.27 .11 | 16.2 | 4 | 0.5: | 3 | 6100: | |||
| 620 | 025426.6423900 | 2.43 .15 | 15.4 | 7 | 8.8 | 68 6 | 2167 2 | 203 | 213 | |
| 668 | 030854.8703349 | 1.68 .24 | 17.0 | 3 | 1.3 | 37 9 | 4330 5 | |||
| 734 | 032846.7363323 | 1.79 .20 | 16.5 | 4 | 5.4 | 41 6 | 4701 4 | 129 | 157 | |
| 860 | 043018.5884616 | 1.10 .13 | 16.3 | 6 | 4 | |||||
| 914 | 045213.2182335 | 1.53 .16 | 15.7 | 6 | 1.4 | 18 4 | 9573 5 | 415 | ||
| 974 | 052320.9854023 | 0.83 .09 | 16.9 | 5 | 6 | |||||
| 982 | 052644.4191236 | 1.39 .19 | 15.8 | 5 | 7.6 | 30 6 | 8336 3 | 512 | ||
| 987 | 053012.0555216 | 1.57 .21 | 18.0 | 9 | 9.5 | 60 3 | 2182 4 | 187 | 210 | 214 |
| 1053 | 061021.8504706 | 1.38 .17 | 15.8 | 4 | 3.3 | 27 4 | 7775 5 | 420 | ||
| 1063 | 061318.7530643 | 1.19 .16 | 16.2 | 7 | 4 | |||||
| 1064 | 061342.3810425 | 2.04 .24 | 15.6 | 4 | 3.2 | 28 4 | 4266 7 | 176 | ||
| 1119 | 063900.2572258 | 1.00 .12 | 16.4 | 5 | 5 | |||||
| 1185 | 071554.5675902 | 2.02 .22 | 15.3 | 5 | 4.7 | 40 3 | 1153 3 | 172 | 183 | |
| 1207 | 072225.0491642 | 0.84 .11 | 16.4 | 9 | 4 | |||||
| 1280 | 075507.0425728 | 0.78 .09 | 16.8 | 6 | 2.2 | 15 4 | 7490 5 | 280 | ||
| 1282 | 075524.7561002 | 0.96 .11 | 16.7 | 5 | 4 | |||||
| 1300 | 080009.6562154 | 2.33 .22 | 15.1 | 5 | 5.0 | 20 3 | 9095 5 | 629 | ||
| 1340 | 081359.5454434 | 5.17 .58 | 13.6 | 6 | 43.9 | 322 3 | 559 1 | 170 | 189 | 194 |
| 1351 | 081709.6560249 | 0.68 .09 | 16.9 | 6 | 4 | |||||
| 1405 | 083812.0455255 | 0.87 .10 | 16.5 | 6 | 1.7 | 16 3 | 7070 7 | 264 | ||
| 1425 | 084421.6093215 | 1.23 .10 | 16.4 | 6 | 4.0 | 26 6 | 4064 5 | 226 | ||
| 1451 | 085419.0542728 | 0.90 .11 | 16.5 | 6 | 2.1 | 10 3 | 7449 5 | 350 | ||
| 1490 | 090738.9283808 | 1.10 .10 | 16.4 | 7 | 1.0 | 9 2 | 6682 14 | 265 | ||
| 1524 | 091831.0493244 | 1.18 .15 | 16.0 | 6 | 11 | |||||
| 1537 | 092145.1641528 | 4.31 .53 | 13.9 | 5 | 49.8 | 209 4 | 1574 2 | 308 | 336 | 341 |
| 1543 | 092311.8265631 | 1.56 .17 | 15.8 | 5 | 8: | 7011 | 2410 3 | 193 | ||
| 1566 | 093140.8160231 | 1.84 .21 | 15.3 | 7 | 1 | |||||
| 1583 | 093555.0480848 | 1.57 .22 | 15.6 | 4 | 13 |
| 1 | 2 | 3 | 4 | 5 | 6 | 7 | 8 | 9 | 10 | 11 |
|---|---|---|---|---|---|---|---|---|---|---|
| 1612 | 094402.4682212 | 0.74 .09 | 16.8 | 6 | 5 | |||||
| 1626 | 094650.4794839 | 2.49 .22 | 15.1 | 6 | 11.3 | 86 3 | 15402 | 170 | 183 | 186 |
| 1711 | 100439.1602759 | 0.88 .10 | 16.6 | 6 | 1.7 | 16 2 | 221610 | 144 | ||
| 1735 | 101001.0715221 | 0.88 .10 | 16.6 | 6 | 1.8 | 19 3 | 63275 | 189 | ||
| 1893 | 105124.0195324 | 4.26 .48 | 14.0 | 6 | 13.4 | 8613 | 20671 | 229 | ||
| 1897 | 105236.0394814 | 0.68 .08 | 17.0 | 5 | 5 | |||||
| 1940 | 110157.1470540 | 1.88 .15 | 15.8 | 5 | 3.4 | 19 3 | 65835 | 378 | ||
| 1988 | 111327.8072553 | 0.73 .09 | 16.7 | 6 | 8 | |||||
| 2056 | 113057.6040507 | 0.92 .10 | 16.7 | 7 | 5 | |||||
| 2093 | 114227.4513551 | 3.70 .45 | 14.1 | 6 | 9.3 | 73 3 | 9752 | 178 | 190 | 193 |
| 2116 | 114836.0434316 | 1.87 .20 | 15.4 | 6 | 2.8 | 27 4 | 7355 | 115 | ||
| 2258 | 122016.6480811 | 1.20 .17 | 15.8 | 9 | 1.7 | 3 | 8394 | 122 | ||
| 2296 | 122859.3285143 | 1.12 .15 | 16.1 | 5 | 2.0 | 17 3 | 80249 | 435 | ||
| 2298 | 122908.6575454 | 1.34 .16 | 15.9 | 7 | 5.2 | 46 7 | 7994 | 126 | 139 | 143 |
| 2335 | 123621.1255906 | 15.901.85 | 10.6 | 4 | 161 | 420 5 | 12261 | 506 | 521 | 524 |
| 2354 | 124128.8031514 | 0.67 .09 | 17.1 | 8 | 1.3 | 15 3 | 18036 | 125 | ||
| 2390 | 125105.0082623 | 1.12 .16 | 16.1 | 6 | 6 | |||||
| 2437 | 130106.7032235 | 0.83 .11 | 16.8 | 7 | 2.4 | 23 5 | 29006 | 156 | 175 | |
| 2443 | 130207.9584159 | 3.92 .32 | 14.5 | 6 | 3 | |||||
| 2460 | 130514.9002230 | 1.09 .13 | 16.3 | 7 | 3 | |||||
| 2463 | 130548.0462743 | 1.37 .19 | 15.7 | 4 | 3 | |||||
| 2553 | 132409.6175407 | 1.25 .10 | 16.4 | 7 | 1.9 | 26 6 | 699415 | 200 | ||
| 2559 | 132525.7044600 | 1.01 .10 | 16.7 | 5 | 8 | |||||
| 2574 | 132820.2114703 | 1.85 .24 | 15.4 | 4 | 3 | |||||
| 2592 | 133341.5111418 | 0.99 .07 | 17.0 | 7 | 4 | |||||
| 2626 | 134043.3173314 | 0.65 .07 | 17.2 | 8 | 7 | |||||
| 2707 | 140425.4002725 | 0.90 .10 | 16.6 | 7 | 1.5 | 13 2 | 73806 | 301 | ||
| 2713 | 140621.6054313 | 1.28 .17 | 15.8 | 4 | 4 | |||||
| 2737 | 141312.0072648 | 0.67 .08 | 17.3 | 9 | 6 | |||||
| 2754 | 141741.0052748 | 1.29 .17 | 15.9 | 5 | 6.1 | 36 9 | 70575 | 308 | ||
| 2757 | 141833.6050913 | 1.15 .10 | 16.4 | 7 | 3.2 | 22 5 | 701011 | 229 | ||
| 2786 | 143007.2062543 | 1.46 .17 | 15.9 | 4 | 4 | |||||
| 2856 | 144457.6405234 | 1.12 .16 | 15.9 | 6 | 1.8 | 14 3 | 564012 | 216 | ||
| 2902 | 150032.6491027 | 0.76 .10 | 16.7 | 4 | 4 | |||||
| 2915 | 150438.9181337 | 0.84 .09 | 16.9 | 7 | 7 | |||||
| 2943 | 151543.2002524 | 0.67 .09 | 17.0 | 7 | 5 | |||||
| 2944 | 151543.2102750 | 0.83 .09 | 16.8 | 7 | 6 |
| 1 | 2 | 3 | 4 | 5 | 6 | 7 | 8 | 9 | 10 | 11 |
|---|---|---|---|---|---|---|---|---|---|---|
| 2955 | 151836.7011101 | 1.04 .11 | 16.8 | 6 | 6 | |||||
| 2978 | 152628.8411731 | 2.26 .24 | 15.1 | 5 | 5.6 | 37 5 | 2481 1 | 189 | ||
| 3001 | 153443.0082003 | 1.48 .12 | 16.3 | 6 | 2.6 | 20 3 | 5803 4 | 278 | ||
| 3007 | 153654.0511720 | 1.10 .11 | 16.4 | 5 | 4.2 | 30 4 | 5847 5 | 209 | ||
| 3154 | 163231.2674449 | 1.12 .12 | 16.4 | 4 | 4.0 | 21 3 | 3423 4 | 255 | ||
| 3202 | 165140.3532422 | 0.68 .09 | 16.8 | 8 | 4 | |||||
| 3210 | 165450.4702617 | 1.37 .19 | 15.7 | 5 | 3 | |||||
| 3228 | 170247.8444731 | 0.65 .08 | 17.3 | 8 | 4 | |||||
| 3230 | 170338.9454832 | 0.83 .10 | 16.9 | 7 | 5 | |||||
| 3248 | 171145.3254451 | 0.98 .10 | 16.7 | 5 | 3.4 | 17 4 | 6330 6 | 353 | ||
| 3249 | 171149.2473937 | 0.85 .10 | 16.7 | 6 | 2.5 | 15 2 | 8320 15 | 248 | ||
| 3297 | 173721.6602537 | 1.12 .11 | 16.4 | 5 | 2.5 | 2212 | 6220 6 | 254 | ||
| 3310 | 174810.8530908 | 0.95 .10 | 16.5 | 6 | 1.5 | 20 3 | 6744 9 | 241 | ||
| 3333 | 180645.1874835 | 1.77 .21 | 15.6 | 4 | 8 | |||||
| 3377 | 183312.7525655 | 1.34 .11 | 16.3 | 4 | 4.7 | 25 6 | 8418: | |||
| 3680 | 210236.0134753 | 1.68 .20 | 15.6 | 3 | 2 | |||||
| 3870 | 220604.3261107 | 1.27 .13 | 16.1 | 6 | 2 | |||||
| 4160 | 233900.0493531 | 0.83 .10 | 16.7 | 6 | 1.2 | 14 3 | 9319 10 | |||
| 4181 | 234438.4273936 | 1.14 .16 | 16.1 | 5 | 4 | |||||
| 4214 | 235321.6860141 | 0.96 .09 | 16.7 | 6 | 2.2 | 12 3 | 5739 10 | 361 |
| Name | RA(2000)DEC | |||||||||
|---|---|---|---|---|---|---|---|---|---|---|
| 1 | 2 | 3 | 4 | 5 | 6 | 7 | 8 | 9 | 10 | 11 |
| UGC256 | 002656.6500150.7 | 1.55 .29 | 15.28 | 4 | 1.5 | 113 | ||||
| UGC1928 | 022811.2435109.7 | 1.36 .30 | 16.47 | 5 | 2.6 | 163 | 65617 | 432 | ||
| UGC69A | 032702.2725038.3 | 2.10 .49 | 3 | 17.7 | 834 | 20743 | 243 | 257 | 262 | |
| UGC2736 | 032627.6403028.5 | 1.57 .31 | 14.64 | 2 | 5 | |||||
| MCG-03-13-016 | 045013.7171557.8 | 1.83 .53 | 14.25 | 4 | 5.2 | 223 | 92488 | 608 | ||
| UGC3127 | 044025.9020112.6 | 2.10 .42 | 14.94 | 7 | 11.0 | 745 | 33454 | 192 | 205 | 209 |
| UGC3342 | 054429.7691756.3 | 1.74 .39 | 14.99 | 5 | 4.4 | 314 | 38904 | 294 | ||
| IRAS05442+46 | 054809.6461531.0 | 0.77 .60 | 16.23 | 5 | 3.2 | 274 | 60837 | 190 | ||
| UGC4258 | 081047.6465445.7 | 1.43 .38 | 18.16 | 6 | 5.3 | 375 | 31244 | 208 | 222 | |
| UGC6390 | 112242.0640358.7 | 2.07 .30 | 19.22 | 6 | 9.3 | 914 | 9823 | 163 | 177 | 180 |
| UGC6575 | 113626.5581122.0 | 1.88 .44 | 14.57 | 5 | 14.6 | 893 | 12165 | 206 | 222 | |
| UGC6894 | 115524.4543926.3 | 1.45 .25 | 15.28 | 5 | 4.0 | 395 | 8504 | 128 | ||
| NGC6244 | 164803.9621201.6 | 1.54 .32 | 14.45 | 1 | 4 | |||||
| UGC10713 | 170433.9722647.5 | 1.83 .32 | 13.97 | 3 | 12.7 | 894 | 10722 | 230 | 242 | 244 |
| RFGC | ||||||||
|---|---|---|---|---|---|---|---|---|
| 1 | 2 | 3 | 4 | 5 | 6 | 7 | 8 | 9 |
| 161 | 1623 | 191 | 9.3 | 10.1 | 9.6 | 0.57 | 3.76 | 0.15 |
| 208 | 4998 | 246 | 9.6 | 10.6 | 10.1 | 0.33 | 2.89 | 0.11 |
| 329 | 6352 | 126 | 9.5 | 9.9 | 10.3 | 0.20 | 0.48 | 0.42 |
| 411 | 1824 | 228 | 9.1 | 10.2 | 9.4 | 0.43 | 5.68 | 0.08 |
| 492 | 3985 | 207 | 9.4 | 10.2 | 9.8 | 0.42 | 2.83 | 0.15 |
| 493 | 6407 | 258 | 9.8 | 10.5 | 9.9 | 0.87 | 3.55 | 0.25 |
| 620 | 2357 | 202 | 9.3 | 10.2 | 9.7 | 0.36 | 2.89 | 0.13 |
| 734 | 4850 | 127 | 9.7 | 10.1 | 10.5 | 0.16 | 0.39 | 0.41 |
| 914 | 9438 | 402 | 9.7 | 11.2 | 10.6 | 0.12 | 4.06 | 0.03 |
| 982 | 8170 | 498 | 10.3 | 11.3 | 10.4 | 0.79 | 8.23 | 0.10 |
| 987 | 2321 | 186 | 9.3 | 10.2 | 10.3 | 0.11 | 0.79 | 0.14 |
| 1053 | 7874 | 409 | 9.9 | 11.2 | 10.7 | 0.19 | 3.48 | 0.05 |
| 1064 | 4476 | 174 | 9.4 | 10.3 | 10.2 | 0.16 | 1.31 | 0.12 |
| 1185 | 1305 | 171 | 8.5 | 9.8 | 9.1 | 0.29 | 5.00 | 0.06 |
| 1280 | 7509 | 273 | 9.7 | 10.5 | 10.0 | 0.56 | 3.56 | 0.16 |
| 1300 | 9182 | 610 | 10.2 | 11.8 | 10.9 | 0.25 | 8.02 | 0.03 |
| 1340 | 588 | 170 | 8.8 | 9.8 | 9.0 | 0.57 | 5.85 | 0.10 |
| 1405 | 7095 | 258 | 9.6 | 10.5 | 10.0 | 0.35 | 2.96 | 0.12 |
| 1425 | 3898 | 223 | 9.4 | 10.2 | 9.7 | 0.55 | 3.65 | 0.15 |
| 1451 | 7517 | 342 | 9.7 | 10.8 | 10.0 | 0.45 | 5.35 | 0.08 |
| 1490 | 6608 | 259 | 9.3 | 10.5 | 10.0 | 0.17 | 3.17 | 0.05 |
| 1537 | 1692 | 306 | 9.8 | 10.7 | 9.8 | 0.85 | 7.54 | 0.11 |
| 1543 | 2114 | 191 | 9.2 | 10.0 | 9.4 | 0.62 | 3.95 | 0.16 |
| 1626 | 1732 | 169 | 9.2 | 9.9 | 9.4 | 0.58 | 3.50 | 0.16 |
| 1711 | 2314 | 143 | 8.6 | 9.5 | 9.0 | 0.40 | 3.22 | 0.13 |
| 1735 | 6483 | 185 | 9.5 | 10.2 | 9.9 | 0.36 | 1.69 | 0.21 |
| 1893 | 1796 | 227 | 9.3 | 10.5 | 9.8 | 0.26 | 4.23 | 0.06 |
| 1940 | 6617 | 370 | 9.8 | 11.1 | 10.3 | 0.32 | 5.97 | 0.05 |
| 2093 | 1043 | 177 | 8.6 | 10.0 | 9.3 | 0.23 | 4.81 | 0.05 |
| 2116 | 765 | 115 | 7.8 | 9.1 | 8.5 | 0.21 | 4.14 | 0.05 |
| 2258 | 903 | 122 | 7.8 | 9.1 | 8.4 | 0.22 | 4.53 | 0.05 |
| 2296 | 7997 | 424 | 9.7 | 11.1 | 10.2 | 0.31 | 7.09 | 0.04 |
| 2298 | 912 | 126 | 8.3 | 9.2 | 8.4 | 0.67 | 5.21 | 0.13 |
| 2335 | 1189 | 504 | 10.0 | 11.5 | 10.8 | 0.15 | 5.65 | 0.03 |
| 2354 | 1639 | 124 | 8.2 | 9.1 | 8.5 | 0.50 | 4.42 | 0.11 |
| 2437 | 2749 | 155 | 8.9 | 9.6 | 9.0 | 0.69 | 3.79 | 0.18 |
| 2553 | 6807 | 195 | 9.6 | 10.4 | 10.2 | 0.23 | 1.47 | 0.15 |
| RFGC | ||||||||
|---|---|---|---|---|---|---|---|---|
| 1 | 2 | 3 | 4 | 5 | 6 | 7 | 8 | 9 |
| 2707 | 7290 | 294 | 9.5 | 10.6 | 10.0 | 0.30 | 3.85 | 0.08 |
| 2754 | 6959 | 301 | 10.1 | 10.8 | 10.2 | 0.74 | 3.73 | 0.20 |
| 2757 | 6914 | 224 | 9.8 | 10.4 | 10.1 | 0.49 | 2.18 | 0.23 |
| 2856 | 5753 | 212 | 9.4 | 10.3 | 10.0 | 0.25 | 2.21 | 0.11 |
| 2978 | 2625 | 187 | 9.2 | 10.2 | 9.7 | 0.31 | 2.88 | 0.11 |
| 3001 | 5831 | 273 | 9.6 | 10.7 | 10.0 | 0.35 | 4.24 | 0.08 |
| 3007 | 6027 | 205 | 9.8 | 10.3 | 9.9 | 0.77 | 2.41 | 0.32 |
| 3154 | 3657 | 252 | 9.3 | 10.3 | 9.5 | 0.70 | 5.96 | 0.12 |
| 3248 | 6302 | 346 | 9.7 | 10.9 | 10.7 | 0.11 | 1.77 | 0.06 |
| 3249 | 8548 | 241 | 9.9 | 10.5 | 10.1 | 0.59 | 2.47 | 0.24 |
| 3297 | 6474 | 249 | 9.6 | 10.5 | 10.0 | 0.39 | 2.94 | 0.13 |
| 3310 | 6998 | 236 | 9.5 | 10.4 | 10.0 | 0.29 | 2.52 | 0.11 |
| 4214 | 5985 | 354 | 9.5 | 10.8 | 10.1 | 0.26 | 4.70 | 0.06 |
| Parameter | Mean | Standard | Skewness | Kurtosis |
|---|---|---|---|---|
| deviation | ||||
| log) | 2.36 | 0.17 | 0.33 | 0.40 |
| log) | 1.17 | 0.29 | 0.79 | 0.50 |
| log | 9.79 | 0.59 | 0.65 | 0.01 |
| log | 9.38 | 0.56 | 1.10 | 0.94 |
| log() | 10.35 | 0.59 | 0.11 | 0.10 |
| log() | 0.42 | 0.23 | 0.16 | 0.77 |
| log() | 7.03 | 0.23 | 0.20 | 0.82 |
| log( | 0.56 | 0.21 | 0.43 | 0.07 |
| log() | 0.98 | 0.28 | 0.07 | 0.42 |
| log() | 3.53 | 0.43 | 0.37 | 0.31 |
| N | Type | log) | log( | log( | log() |
|---|---|---|---|---|---|
| 18 | Sb,bc,c | 7.01 0.06 | 0.60 0.06 | 1.03 0.08 | 0.430.06 |
| 20 | Scd | 7.03 0.06 | 0.53 0.03 | 0.96 0.06 | 0.430.05 |
| 12 | Sd,dm,m | 7.07 0.05 | 0.55 0.05 | 0.93 0.06 | 0.380.07 |
| 1 | log | log | 0.92 | 0.22 | 1.80 0.11 | 7.26 0.13 |
| 2 | log | log | 0.93 | 0.22 | 1.92 0.11 | 8.10 0.13 |
| 3 | log | log | 0.97 | 0.15 | 2.00 0.08 | 7.45 0.09 |
| 4 | log | log | 0.92 | 0.22 | 0.87 0.05 | 0.81 0.52 |
| 5 | log | log | 0.94 | 0.20 | 0.94 0.05 | 1.14 0.48 |
| 6 | log | log | 0.77 | 0.19 | 1.28 0.15 | 1.86 0.37 |
| 7 | log | log | 0.39 | 0.19 | 0.47 0.16 | 0.54 0.38 |
| 8 | log | log | 0.24 | 0.23 | 0.32 0.19 | 0.34 0.45 |
| 9 | log | log | 0.49 | 0.24 | 0.79 0.20 | 0.88 0.48 |
| 10 | log) | log | 0.05 | 0.23 | 0.07 0.19 | 7.19 0.45 |
| 11 | log | log( | 0.91 | 0.23 | 1.19 0.08 | 5.19 0.27 |
| 12 | log | log( | 0.76 | 0.37 | 2.49 0.31 | 3.48 0.73 |
| 13 | log | log | 0.32 | 0.20 | 1.25 0.30 |