Polar Outflows in Six Broad Absorption Line Quasars
Abstract
Using the radio observations by FIRST and NVSS, we build a sample of 151 radio variable quasars selected from the Sloan Digital Sky Survey Data Release 3 (SDSS DR3). Six (probably another two) among them are classified as broad absorption line (BAL) quasars, with radio flux variations of a few 10 percent within 1.5-5 years. Such large amplitudes of the variations imply brightness temperatures much higher than the inverse Compton limits (1012 K) in all the BAL quasars, suggesting the presence of relativistic jets beaming toward the observer. The angle between the outflow and the jet is constrained to be less than . Such BAL quasars with polar outflows are beyond the simple unification models of BAL quasars and non-BAL quasars, which hypothesize that BAL quasars are normal quasars seen nearly edge-on.
1 Introduction
The broad absorption lines (BALs), which appear in the UV spectra of quasars (e.g., Tolea et al. 2002; Reichard et al. 2003a; Hewett & Foltz 2003), are characterized by prominent broad and blueshifted absorption troughs due to ions of a wide range species from FeII, MgII to OVI. It is now commonly accepted that BAL region is present in all quasars but with covering factor much less than unit. The dichotomy of BAL quasars and non-BAL quasars is interpreted as an orientation effect. For instance, Murray et al. (1995) suggested that BALs present themselves in a minority of the quasar population when the line of sight passes through the accretion disk wind nearly at the equatorial plane. A detail study shows that such a scenario is also consistent with the continuum polarization and X-ray absorption in BAL quasars (Wang, Wang & Wang 2005). Elvis (2000) appealed to a funnel-shaped thin shell outflow that arises from the accretion disk to explain various observational properties of quasars, including BALs which are interpreted as “normal” quasars when the wind is viewed end-on. Both orientation models require a rather large incline angle of for BAL quasars.
The determination of the inclination of the accretion disk in BAL quasars is vital to understand the geometry of the BAL outflow. The axis defined by relativistic radio jets, which is likely aligned with that of the accretion disk (Wills et al. 1999), can be used to infer the inclination angle of the accretion disk. Becker et al. (2000) found that the 29 BAL quasars discovered in the FIRST Bright Quasar Survey (FBQS) exhibit compact radio morphologies ( unresolved at resolution) and show wide scatter in the radio spectral index ( and for sources, ). According to the unification model of radio-loud AGNs (cf. Urry & Padovani 1995), core-dominated flat-spectrum radio sources are those viewed close to the radio jet axis, while lobe-dominated steep-spectrum radio sources appear to be present at larger viewing angles. The radio morphology and spectra of FBQS BAL quasars indicate that the orientation of BAL quasars can be both face-on and edge-on, contrary to the simple unification model introduced above. However, their radio spectral indexes, derived from non-simultaneous observations, might be biased by radio variations. In addition, most FIRST detected BAL QSOs are only radio-intermediate, for which it is unknown if the unification model based on radio-loud AGN (i.e., core-dominated flat-spectrum radio sources are face-on) still applies. Also the size of radio-intermediate sources might be much smaller, such as the radio intermediate quasar III ZW 2 (Brunthaler et al. 2005), thus observations with much higher spatial resolution is required to confirm its compactness. Jiang & Wang (2003) acquired high resolution VLBI images of three BAL quasars at 1.6 GHz. They found one source is resolved into asymmetric two-sided structure and a bright central component at mas resolution. This morphology mimics a Compact Steep Spectral (CSS) source, but its size is much smaller than the typical value for a CSS source. The other two sources remain unresolved at this resolution, indicating that they are viewed face-on.
The radio flux variability, which is sometimes a better indicator of jet orientation than the radio morphology (at a limited resolution and sensitivity) and the spectral slope (often based on non-simultaneous observations), has not hitherto been adequately explored. Becker et al. (2000) commented that 5 BAL quasars in their sample appear to be variable at 1.4 GHz, but no further concern was given. In this paper we use two-epoch observations at the same frequency of 1.4 GHz by FIRST (the Faint Images of the Radio Sky at Twenty centimeters survey, Becker et al. 1995) and NVSS (the NRAO VLA Sky Survey, Condon et al. 1998) to study the radio variability of the BAL quasars observed by SDSS (the Sloan Digital Sky Survey, York et al. 2000). We identify 6 (probably another two) BAL quasars with radio variation with a few 10 percent. Calculations based on the radio variations imply that these sources should be viewed face-on with inclination angles less than 20∘. This confirms the existence of polar BAL outflows, opposite to the unification model for BAL quasars. Throughout the paper, we assume a cosmology with = 70 km s-1 Mpc-1, , and .
2 Data and Analysis
2.1 The SDSS Quasar Catalog and the Radio Data
Our jumping-off point is the SDSS Quasar Catalog (the 3rd edition, Schneider et al. 2005, hereafter S05C for the catalog). Its sky coverage is , which accounts for more than 2/5 of planed by SDSS. S05C consists of the 46,420 quasars with band absolute magnitudes and positional uncertainties . In particular, optically unresolved objects brighter than with FIRST counterpart within are observed, which we are more interested in.
Using the NARO Very Large Array in its B configuration, the FIRST survey began in 1993 was designed to explore the faint radio sky down to a limit of mJy with a resolution of FWHM. Its sky coverage is mostly superposed with that of SDSS. The FIRST radio catalog was presented in White et al. (1997) with a positional accuracy of (with 90% confidence level). By matching the SC05 and the FIRST catalog, we find 3,757 quasars in S05C with FIRST counterparts within . Considering the average source density of in the FIRST survey, we expect only of these matches to be spurious. We note that the above cutoff is biased against quasars with extended radio morphologies, e.g., lobe-dominated quasars. However, missing this kind of radio variable sources based on the data presently available (see §2.2) and this does not influence our main results. After all, only lobe-dominated radio sources will be lost (Ivezic et al. 2002; Lu et al. in preparation), and such sources only accounts for in a well-defined variable sample of de Vries et al. (2004).
NVSS, using the VLA in its more compact D and DnC configurations, was carried out between at the same frequency as FIRST. NVSS covers all the sky area of FIRST, but with a higher survey limit of mJy and a lower resolution of . The positional uncertainties are estimated to be varying from for bright sources with flux density 15 mJy to at the survey limit. With a typical background noise of 0.45 mJy (about 3 times higher than that of FIRST), we expect that the NVSS survey be able to detect all of the FIRST sources with flux density mJy, provided that the radio sources do not variate.
2.2 The Selection of Radio Variable Quasars
We first select quasars in S05C with redshift 0.5 so that the MgII absorption trough (or other bluer troughs), if presents, falls within the wavelength coverage of the SDSS spectrograph (). Out of these quasars, 1,877 have FIRST counterparts within and peak flux density 5 mJy as measured by FIRST. Then the FIRST images of all these 1,877 objects are visually inspected and classified into three categories: 1) compact radio sources, 2) marginally resolved radio sources, and 3) radio sources with complex morphology. The first category includes 1,482 radio point sources unresolved at the FIRST resolution (79.0%). The second category includes 200 radio sources (10.7%), which often show core plus elongated (jet-like) structure, or a core embedded in weak diffuse emission. The third category includes 193 radio sources (10.7%), out of which 168 sources exhibit Fanaroff-Riley II morphology (FR-II, Fanaroff & Riley 1974).
We search for NVSS counterparts for the quasars in all of the three categories within a matching radius ( of the NVSS positional error at the survey limit). NVSS counterparts are found for 1,838 of the 1,877 quasars within a with a false rate of less than 1%. Two possibilities may lead unfindable of the 39 quasars as NVSS counterparts within such a matching radius: 1) the flux falls below the NVSS limit resulting from variability; 2) the apparent centroid of the source is largely shifted due to contamination either by bright lobe(s) or by nearby unrelated bright source(s). We compare the NVSS and FIRST images to distinguish between the two and find that all of the 39 cases are due to confusion effects. In fact, 21 of the 39 quasars show FR-II morphology. These 39 quasars are excluded in our further analysis. This result indicates that care must be taken to compare the fluxes obtained during the two surveys.
As noted by de Vries et al. (2004), the flux densities between FIRST and NVSS are not directly comparable since the radio sources that are not resolved by NVSS may be resolved by FIRST. In this case, the peak flux is smaller than the integrated flux density. We define the variability ratio (VR) for each quasar as
| (1) |
where and denote the peak flux density measured by FIRST and the integrated flux density measured by NVSS. Our variability ratio is conservative for selecting variable sources which are brighter in the FIRST images. We estimate the significance of radio flux variability as
| (2) |
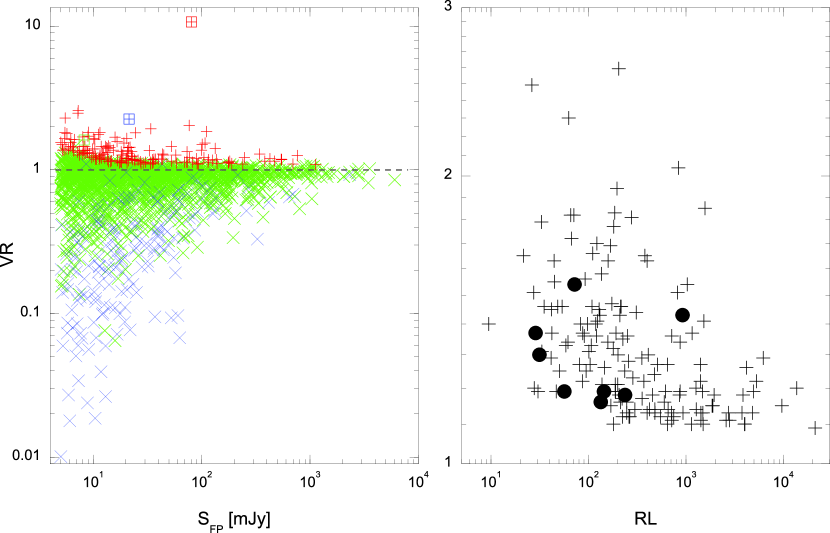
where is the NVSS integrated flux uncertainty, and the FIRST peak flux uncertainty. Objects with and are taken as candidates radio variable quasars. This yields 154 candidate variable sources. We plot in Figure 1 (left panel) variability ratio VR against the peak flux density measured by FIRST . The apparent dependence of VR on is due to the combination of two facts, the dependence of measurement error on flux density and the confusion effects in the NVSS. The latter complication also induces the obvious asymmetric distribute of these sources around . In fact, all but three (SDSS J160953.42+433411.5, SDSS J101754.85+470529.3, and SDSS J164928.87+304652.4) of radio sources that are well resolved by FIRST have . A more symmetric distribution can be found if only point radio sources and marginally resolved radio sources (symbols in blue and red color) are considered. Isolated compact sources located well below are likely radio variable quasars. But new observations with higher resolution are needed to confirm this. Out of the three quasars with complex radio morphology and (all are FR-II quasars), SDSS J160953.42+433411.5 has and , fulfilling our selection criteria. After careful examination of its FIRST and NVSS image, we find confusion effects in NVSS are serious in this source and exclude it from our sample. Out of rest 153 candidates, 151 are point radio sources and 2 are marginally resolved. Their NVSS and FIRST images are all visually examined for possible contamination by unrelated nearby bright sources, and one of them, SDSS J111344.84-004411.6, is removed for this reason. In addition, SDSS J094420.44+613550.1 is eliminated from the sample because the NVSS pipeline gives a wrong flux density for this object. At last, we end up with a sample of 151 candidate radio variable quasars111Considering the systematic uncertainty of radio flux observed by FIRST and NVSS does not significantly alter the results of this paper.. Using the FIRST integrated flux density and the SDSS PSF magnitudes, we calculate the radio-loudness (RL) of these quasars, defined as the k-corrected ratio of the 5 GHz radio flux to the near ultraviolet flux at 2 500 Å, . A power law slope of () is assumed for radio emission since their radio spectra are likely flat (Wang et al. 2005), and the SDSS colors are used for the optical-UV emission. The radio properties of a sub-sample of the BAL quasars (see §2.3 for detailed description) selected from these objects are listed in Table 1. In Figure 1 (right panel), we plot the radio-loudness against radio variability ratio for the 151 quasars. We see that most radio sources with large variability amplitude () have the radio-loudness .
2.3 The Optical Spectral Analysis and the Sample of Radio Variable BAL Quasars
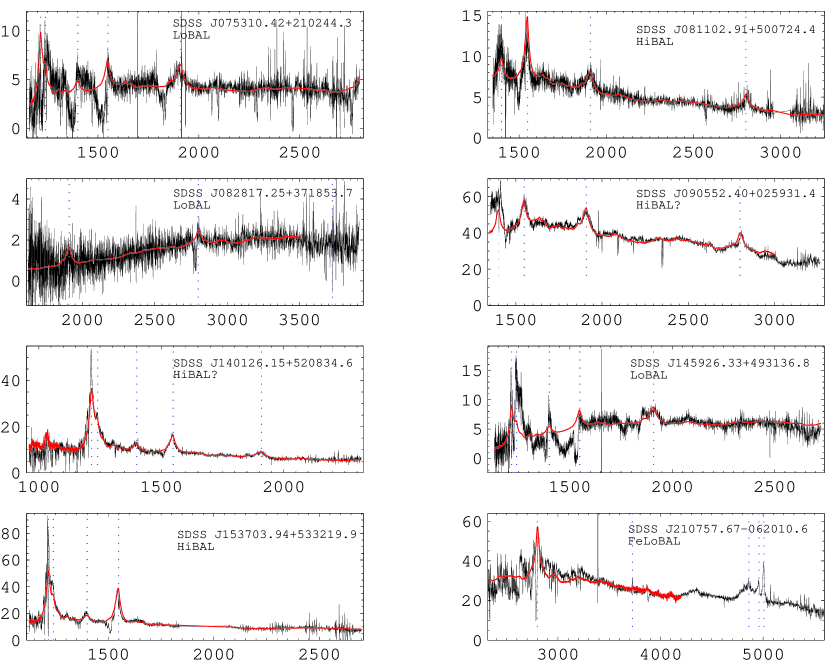
Eight BAL candidates were identified by visually inspecting the SDSS spectra of the 151 radio variable quasars. These candidate spectra were corrected for Galactic extinction using the extinction curve of Schlegel et al. (1998) and brought to their rest frame before further analysis. We use the “Balnicity” Index (BI) defined by Weymann et al. (1991) and Reichard (2003b) to quantitatively classify the absorption troughs. Following the procedures described by Reichard et al. (2003b), we calculated the BIs for the broad absorption troughs by comparing the observed spectra of our BAL candidates with the composite quasar spectrum created by Vanden Berk et al. (2001) from the SDSS Early Data Release (EDR). In brief, the EDR composite spectrum was reddened using the Pei (1992) SMC extinction curve to match each observed spectrum of our BAL candidates. The fit is done through minimization of with proper weights given to the wavelength regions that are obviously affected by prominent emission lines and absorption troughs. The results are displayed in Figure 2. Then we calculated the balnicity index of high ionization line BI(CIV) using the definition of Weymann et al. (1991), and the balnicity index of low ionization line BI(MgII) and BI(AlIII) using the definition of Reichard (2003b):
| (3) |
where and are the observed and fitted fluxes as a function of velocity in km s-1 from the systemic redshift within the range of each absorption trough, and
| (4) |
The integral in Equation 3 begins at for CIV and at for MgII and AlIII. The given continuous interval in Equation 4 is for CIV and for MgII and AlIII. The results are listed in Table 1 and described individually below:
- SDSS J075310.42210244.3
-
Apart from the deep high-ionization BAL troughs of CIV, SiIV, NV with 0-13,500 km s-1, the low-ionization AlIII trough, covering a similar velocity range, is also obvious. At the red end of the spectrum, the MgII BAL trough is apparently present. With (CIV)=3,633 km s-1 and (AlIII)=1,420 km s-1, we are certainly observing a LoBAL quasar in this object.
- SDSS J081102.91500724.4
-
Based on the Balnicity Index of and the velocity range of , this object can be safely classified as a HiBAL quasar. Much shallower low-ionization BAL troughs of AlIII and MgII with similar velocity range may also be present. However, high S/N spectrum is needed to confirm this.
- SDSS J082817.25371853.7
-
Though its SDSS spectrum is rather noisy, the low-ionization BAL troughs of AlIII and MgII are securely identified. Classification of this object as LoBAL quasar should be safe based on our conservatively calculated BI of for AlIII and for MgII.
- SDSS J090552.40025931.4
-
A BAL trough detached from the CIV peak is recognizable. However, the fit with the composite quasar spectrum yields . A marginal value of BI(CIV)=228 km s-1 is obtained if using a power law to fit the continuum. We tentatively classified this object as a candidate HiBAL quasar.
- SDSS J140126.15520834.6
-
This object shows rather shallow BAL trough bluewards of CIV emission line. We label it as a candidate.
- SDSS J145926.33493136.8
-
This object show two sets of BAL troughs, SiIV, CIV, and AlIII, around velocities 4,000 km s-1 and 15,000 km s-1. We classified it as a LoBAL solely by the presence of AlIII BAL troughs, since MgII is redshifted out of the wavelength coverage of the SDSS spectrograph. Broad emission line is completely absorbed and only narrow emission line appears in the spectrum. Broad NV emission line is extremely strong perhaps due to scattering the emission line (Wang, Wang, & Wang, in preparation).
- SDSS J153703.94533219.9
-
We classified this object as a HiBAL quasar based on the presence of detached CIV BAL trough with . AlIII falls in the wavelength range of bad pixel and MgII is redshifted out of spectroscopic coverage.
- SDSS J210757.67062010.6
-
This object belong to the rare class of FeLoBAL quasars (e.g., Becker et al. 1997) characterized by the metastable FeII BAL troughs centered at 2,575 Å and MgII BAL troughs. Many FeII absorption features are also detected redward of MgII, as well as neutral helium absorption triplet, , which can be used as powerful diagnostics of HI column density (Arav et al. 2001 and references therein). Only a few quasars have been found to show HeI absorption lines (e.g., Anderson 1974; Arav et al. 2001; Hall et al. 2002).
3 Discussion and Conclusion
The origin of radio variability can be either extrinsic or intrinsic. The most familiar mechanism of extrinsic variability of radio sources is refractive InterStellar Scintillation (ISS, e.g., Blandford, Narayan, & Romani 1986). However, the variability amplitudes induced by ISS is seldom larger than . Considering the fact that all the 6 BAL quasars and the two BAL candidates we selected show radio variation with amplitude (Figure 1 and Table 1), it is reasonable to believe that the radio variabilities of these BAL quasars are intrinsic to the radio sources. Marscher & Gear (1985) suggested that shocks propagating along the radio jets can induce flux variability. Amplitude of variability can be largely amplified by relativistic beaming effect if the radio jets are viewed nearly face-on.
A lower limit of the brightness temperature can be inferred as follows (Krolik 1999),
| (5) |
where is the variable part of the radio power computed from the difference between the FIRST and NVSS fluxes, the time interval in the source rest frame between two observations, and the Boltzmann constant. We present for the 6 BAL quasars and the 2 candidates in Table 1. We find that the brightness temperatures of all 8 radio sources are much larger than the inverse Compton limit of K (Kellermann & Pauliny-Toth 1969). Such extremely large brightness temperatures strongly suggest the presence of relativistic jet beaming toward the observer. If the intrinsic brightness temperature of the radio sources is less than the inverse Compton limit, we can set a lower limit on their Doppler factor, , and hence an upper limit of the inclination angle,
| (6) |
where is the Lorentz factor of the jets. We find that all these radio variable BAL quasars/candidates must be viewed within , except SDSS J210757.67062010.6, for which . If the equipartition value of K (e.g., Readhead 1994; Lähteenmäki et al. 1999) instead of the inverse Compton value of K is adopted as the maximum intrinsic brightness temperature, the inclination angle of our sample of BAL quasars should all be less than . Therefore polar BAL outflows must be present in these radio variable quasars, contrary to the simple unification models of BAL and non-BAL quasars, which hypothesize BAL quasars are normal quasars seen nearly edge-on.
Similar to most FIRST detected SDSS BAL quasars (Menou et al. 2001), All but one of our radio variable BAL quasars are all radio-intermediate with . With , SDSS J082817.25+371853.7 is the only exceptionally very radio-loud BAL quasar in our sample. We note, however, its spectrum is significantly reddened with . Correcting for this intrinsic extinction would place the quasar in the radio-intermediate range with . Since the radio emission is likely boosted greatly by the relativistic motion of the jet as indicated by its large brightness temperature, most of these sources would be intrinsically radio-weak or at most radio-intermediate. The properties of jets in radio-intermediate quasars are not well understood, but at least in one of such object III ZW 2, super-luminal motion of knots at parsec scale has been detected (Brunthaler et al. 2005). Recurrent radio flares was observed in the same object. Miller et al (1993) speculated that radio-intermediate quasars are actually relativistically boosted radio-quiet quasars based on the correlation between [OIII] luminosity and radio power. It is possible that the BAL gas in these objects associated with the expansion of radio plasma. The origin of BAL in these objects may be different from the majority of BAL QSOs, in which a disk-wind is responsible for the absorption.
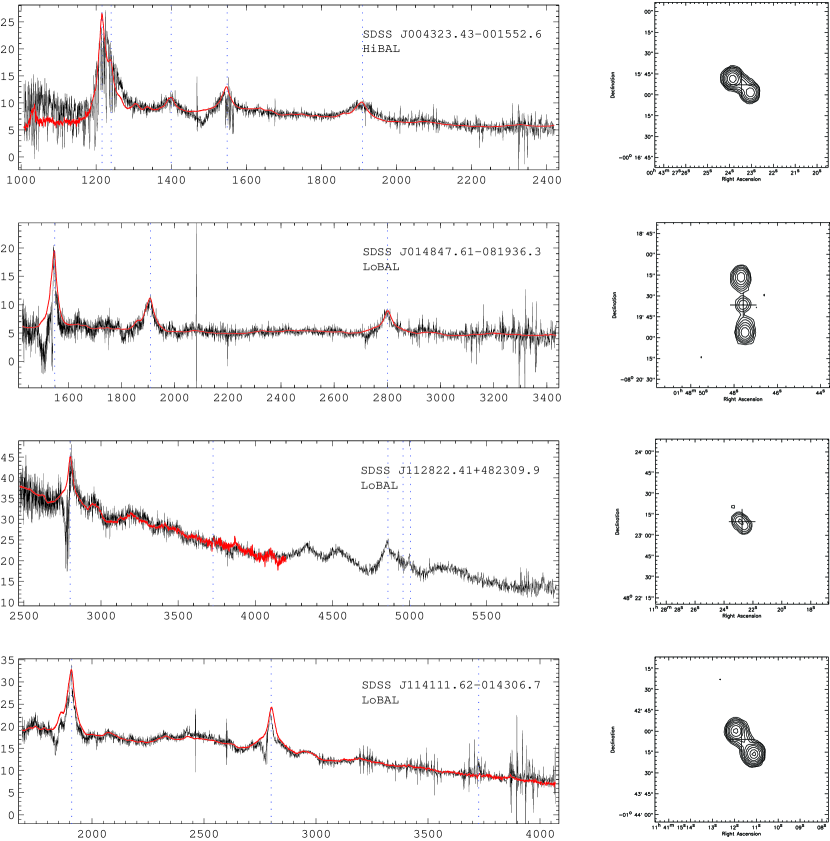
Reichard et al. (2003a) found an uncorrected fraction of 14.01.0% of BAL quasars in SDSS EDR within the redshift ranges , whereas Menou et al. (2001) found this fraction falls to 3.31.1% amongst those quasars with FIRST detection. Among the 82 radio variable QSOs within the same redshift range in our sample, we identify 4-6 BAL quasars. The overall fraction ( 4%) of BAL quasars in our radio variable sample is similar to the fraction of the SDSS quasars detected by FIRST, but much lower (significant at 1-2 level) than the fraction of the whole SDSS quasars, the majority of which are selected according to optical color. As a comparison, out of quasars with in the SDSS DR3 that are resolved by FIRST image, we only identified four BAL quasars. Their SDSS spectra with our model fits are displayed in Figure 3, and their FIRST images as contour maps. Three show FR-II morphology, out of which one object, SDSS J114111.62-014306.7 (also known as LBQS 1138-0126), was previously known as such (Brotherton et al. 2002). Apart from LBQS 1138-0126, the only other known FR-II BAL quasar is FIRST J101614.3+520916, which was also discovered from the FIRST survey (Gregg et al. 2000). At the sensitivity of the FIRST image, the majority of the resolved high redshift quasars are classical radio loud sources. The occurrence of BALs in such radio powerful quasars is extremely small (0.7%).
References
- Abazajian et al. (2005) Abazajian, K., et al. 2005, AJ, 129, 1755
- Anderson (1974) Anderson, K. S. 1974, ApJ, 189, 195
- Arav et al. (2001) Arav, N., Brotherton, M. S., Becker, R. H., Gregg, M. D., White, R. L., Price, T., & Hack, W. 2001, ApJ, 546, 140
- Becker et al. (1995) Becker, R. H., White, R. L., & Helfand, D. J. 1995, ApJ, 450, 559
- Becker et al. (1997) Becker, R. H., Gregg, M. D., Hook, I. M., McMahon, R. G., White, R. L., & Helfand, D. J. 1997, ApJ, 479, L93
- Becker et al. (2000) Becker, R. H., White, R. L., Gregg, M. D., Brotherton, M. S., Laurent-Muehleisen, S. A., & Arav, N. 2000, ApJ, 538, 72
- Blandford et al. (1986) Blandford, R., Narayan, R., & Romani, R. W. 1986, ApJ, 301, L53
- Briggs et al. (1984) Briggs, F. H., Turnshek, D. A., & Wolfe, A. M. 1984, ApJ, 287, 549
- Brotherton et al. (2002) Brotherton, M. S., Croom, S. M., De Breuck, C., Becker, R. H., & Gregg, M. D. 2002, AJ, 124, 2575
- Condon et al. (1998) Condon, J. J., Cotton, W. D., Greisen, E. W., Yin, Q. F., Perley, R. A., Taylor, G. B., & Broderick, J. J. 1998, AJ, 115, 1693
- de Vries et al. (2004) de Vries, W. H., Becker, R. H., White, R. L., & Helfand, D. J. 2004, AJ, 127, 2565
- Elvis (2000) Elvis, M. 2000, ApJ, 545, 63
- Fanaroff & Riley (1974) Fanaroff, B. L., & Riley, J. M. 1974, MNRAS, 167, 31P
- Gregg et al. (2000) Gregg, M. D., Becker, R. H., Brotherton, M. S., Laurent-Muehleisen, S. A., Lacy, M., & White, R. L. 2000, ApJ, 544, 142
- Hall et al. (2002) Hall, P. B., et al. 2002, ApJS, 141, 267
- Hewett & Foltz (2003) Hewett, P. C., & Foltz, C. B. 2003, AJ, 125, 1784
- Ivezić et al. (2002) Ivezić, Ž., et al. 2002, AJ, 124, 2364
- Kellermann & Pauliny-Toth (1969) Kellermann, K. I., & Pauliny-Toth, I. I. K. 1969, ApJ, 155, L71
- Krolik (1999) Krolik, J. H. 1999, Active galactic nuclei : from the central black hole to the galactic environment /Julian H. Krolik. Princeton, N. J. : Princeton University Press
- Jiang & Wang (2003) Jiang, D. R., & Wang, T. G. 2003, A&A, 397, L13
- Lähteenmäki et al. (1999) Lähteenmäki, A., Valtaoja, E., & Wiik, K. 1999, ApJ, 511, 112
- Lynds (1967) Lynds, C. R. 1967, ApJ, 147, 396
- Marscher & Gear (1985) Marscher, A. P., & Gear, W. K. 1985, ApJ, 298, 114
- Menou et al. (2001) Menou, K., et al. 2001, ApJ, 561, 645
- Murray et al. (1995) Murray, N., Chiang, J., Grossman, S. A., & Voit, G. M. 1995, ApJ, 451, 498
- Pei (1992) Pei, Y. C. 1992, ApJ, 395, 130
- Readhead (1994) Readhead, A. C. S. 1994, ApJ, 426, 51
- Reichard et al. (2003) Reichard, T. A., et al. 2003a, AJ, 126, 2594
- Reichard et al. (2003) Reichard, T. A., et al. 2003b, AJ, 125, 1711
- Schlegel et al. (1998) Schlegel, D. J., Finkbeiner, D. P., & Davis, M. 1998, ApJ, 500, 525
- Schneider et al. (2005) Schneider, D. P. 2005, AJ, in press; astro-ph/0503679; S05
- Tolea et al. (2002) Tolea, A., Krolik, J. H., & Tsvetanov, Z. 2002, ApJ, 578, L31
- Urry & Padovani (1995) Urry, C. M., & Padovani, P. 1995, PASP, 107, 803
- Vanden Berk et al. (2001) Vanden Berk, D. E., et al. 2001, AJ, 122, 549
- Wang et al. (2005) Wang, T., Zhou, H., Wang, J., Lu, Y. & Lu, Y. 2005, ApJ submitted
- Wang, Wang, & Wang (2005) Wang, H., Wang, T., & Wang, J. 2005, ApJ, in press
- Weymann et al. (1991) Weymann, R. J., Morris, S. L., Foltz, C. B., & Hewett, P. C. 1991, ApJ, 373, 23
- White et al. (1997) White, R. L., Becker, R. H., Helfand, D. J., & Gregg, M. D. 1997, ApJ, 475, 479
- Wills et al. (1999) Wills, B. J., Brandt, W. N., & Laor, A. 1999, ApJ, 520, L91
- York et al. (2000) York, D. G., et al. 2000, AJ, 120, 1579
| Coordinates (J2000) | Redshift | Date-Obs (F) | Date-Obs (N) | Sig | R | BAL Type | ||||||||
|---|---|---|---|---|---|---|---|---|---|---|---|---|---|---|
| hhmmss.ssddmmss.s | mJy | mJy | yy-mm-dd | mJy | mJy | yy-mm-dd | Kelvin | CIV | AlIII | MgII | ||||
| (1) | (2) | (3) | (4) | (5) | (6) | (7) | (8) | (9) | (10) | (11) | (12) | (13) | (14) | (15) |
| 075310.42+210244.3 | 2.2918 | 16.78 | 17.52 | 1998-09 | 14.08 | 14.40 | 1993-11-01 | 3.64 | 133 | 3633 | 1420 | aaAbsorption trough falls out of the wavelength coverage of the SDSS spectrograph. | LoBAL | |
| 081102.91+500724.5 | 1.8376 | 23.07 | 24.93 | 1997-05-23 | 18.82 | 19.50 | 1993-11-15 | 4.59 | 237 | 617 | 0 | 25 | HiBAL | |
| 082817.25+371853.7 | 1.3530 | 21.18 | 21.42 | 1994-07-23 | 14.53 | 14.80 | 1993-12-15 | 9.67 | 923 | aaAbsorption trough falls out of the wavelength coverage of the SDSS spectrograph. | 1890 | 626 | LoBAL | |
| 090552.40+025931.4 | 1.8183 | 43.54 | 43.84 | 1998-07 | 35.57 | 36.40 | 1993-11-15 | 5.53 | 56 | 0bb if calculated using a power law fit to the continuum. | 0 | 0 | HiBAL? | |
| 140126.15+520834.6 | 2.9724 | 36.18 | 37.13 | 1997-05-04 | 29.94 | 30.40 | 1993-11-15 | 5.35 | 145 | 85 | 0 | aaAbsorption trough falls out of the wavelength coverage of the SDSS spectrograph. | HiBAL? | |
| 145926.33+493136.8 | 2.3700 | 5.22 | 4.74 | 1997-04-17 | 3.61 | 3.80 | 1995-03-12 | 3.16 | 29 | 9039 | 329 | aaAbsorption trough falls out of the wavelength coverage of the SDSS spectrograph. | LoBAL | |
| 153703.94+533219.9 | 2.4035 | 9.28 | 9.58 | 1997-05 | 6.91 | 7.10 | 1993-11-15 | 4.81 | 31 | 2060 | aaAbsorption trough falls out of the wavelength coverage of the SDSS spectrograph. | aaAbsorption trough falls out of the wavelength coverage of the SDSS spectrograph. | HiBAL | |
| 210757.67062010.6 | 0.6456 | 19.21 | 19.61 | 1997-02 | 12.07 | 12.40 | 1993-09-20 | 10.37 | 72 | aaAbsorption trough falls out of the wavelength coverage of the SDSS spectrograph. | aaAbsorption trough falls out of the wavelength coverage of the SDSS spectrograph. | FeLoBAL |
Note. — Col.3: FIRST Peak flux density, Col.4: FIRST Integrated flux density, Col.5: FIRST observation time, Col.6: NVSS Peak flux density, Col.7: NVSS Integrated flux density, Col.8: NVSS observation time, Col. 9: Significance of radio variability as defined in §2.2, Col. 10: lower limits of brightness temperature estimated as in §3, Col. 11: Radio-Loudness calculated in §2.2, Col. 12 to Col. 14: Balnicity Index values of CIV, AlIII and MgII, respectively, Col 15: our final classifications, question marked ones denote candidates.