Detection of Large Grains in the Coma of Comet C/2001 A2 (LINEAR) from Arecibo Radar Observations
Proposed Running Head: Radar Detection of Large Coma Grains
Contact Address:
Michael C. Nolan
Arecibo Observatory
HC 3 Box 53995
Arecibo PR 00612 USA
Phone: (787) 878 2612 x 334
Fax: (787) 878 1861
nolan@naic.edu
Abstract
Arecibo S-band (cm) radar observations of Comet C/2001 A2 (LINEAR) on 2001 July 7–9 showed a strong echo from large coma grains. This echo was significantly depolarized. This is the first firm detection of depolarization in a grain-coma radar echo and indicates that the largest grains are at least or 2 cm in radius. The grains are moving at tens of with respect to the nucleus. The non-detection of the nucleus places an upper limit of 3 km on its diameter. The broad, asymmetric echo power spectrum suggests a fan of grains that have a steep (differential number ) size distribution at cm-scales, though the observed fragmentation of this comet complicates that picture.
Keywords: radar, comets
1 Introduction
When comets enter the inner solar system, we get a close look at material that is relatively pristine, closely resembling the volatile-rich material that formed the outer planets and their satellites. Comets may also have contributed significant volatiles to the early terrestrial planets during accretion, although the relative contribution of cometary impactors and more rocky asteroidal bodies is still debated. Comets also present an impact hazard for the Earth. Understanding the physical structure of cometary nuclei and how they fragment is important for learning about their formation and evaluating the impact hazard. The break-up of Comet D/1993 F2 (Shoemaker-Levy 9) has reinforced the idea that comets may be aggregates of icy grains that easily fragment into similar-sized pieces (e.g., Asphaug and Benz, 1996).
The existence of large icy grains in cometary comae has long been inferred. Solar radiation pressure affects the orbital motion of small particles (Burns et al., 1979). By examining the orbital evolution of grains, it is possible to determine their size, based on the extent to which solar radiation affects their orbits. The observed motions of particles in comet tails are consistent with sizes of mm to cm in a number of cases. Modeling of comet tails suggests large particles in some cases (summarized in Fulle, 2004). The orbital motion of some of dust bands also require that the particles be mm to cm in size (e.g., Sykes et al., 1986, Reach et al., 2000).
Submillimeter observations of C/1996 B2 (Hyakutake) showed evidence of emission from mm-scale particles (Jewitt and Matthews, 1997). The distributions of CO and formaldehyde are often found to be inconsistent with a purely nuclear source, and sublimation of grains is inferred (e.g., Eberhardt, 1999, Gunnarson, 2003). However, it is not known whether these grains are an important source of other gas species or dust. Radar observations have indicated the presence of large grains in comet Halley (Campbell et al., 1983) and Iras-Araki-Alcock (Harmon et al., 1983), though the grains were not directly detected. Radar observation of large (cm-sized) grains near the nucleus determines their velocity distribution, improving our understanding of how grains leave the nucleus, which in turn helps determine the relative contributions of the nucleus and the grains to the gas coma.
This paper will give a brief description of earlier radar results (Section 2), present our observations of C/2001 A2, and use those observations to constrain the size of the nucleus and the population of coma grains (Section 3). We then interpret the grain population both in the context of a simple gas-drag ejection model, yielding a size distribution of the coma grains that contribute to the radar echo (Section 4), and as the outcome of earlier fragmentation of the nucleus (Section 5). We compare the results to those from other comets and using other methods (Section 6). We then conclude (Section 7) that the grain size distribution determined in the modeling is likely to be correct even if the model is oversimplified.
2 Background
If a comet nucleus comes close enough to the Earth, we may have the opportunity to obtain 2-dimensional radar delay-Doppler images, which can provide a wealth of information about the comet’s shape, size, and surface characteristics. However, because the signal-to-noise ratio (SNR) of radar observations is very sensitive to the distance to the target (), radar imaging of comets requires an approach distance of 0.1 AU or less. Over the last twenty years, only comets C/1983 H1 (IRAS-Araki-Alcock) and C/1983 J1 (Sugano-Saigusa-Fujikawa) in 1983 and comet C/1996 B2 (Hyakutake) in 1996 have approached within this distance from the Earth, but radar imaging was not technically feasible for any of those objects.
Even if imaging is not possible, we can measure the basic cm-wavelength scattering properties and estimate the size of the nucleus of any comet that comes within about 0.5 AU of the Earth. Altogether, nine comets have been observed with radar, all at Arecibo except for IRAS-Araki-Alcock, which was observed at both Arecibo and Goldstone, and Hyakutake, which was observed only at Goldstone. All of these objects were observed by transmitting a monochromatic signal and measuring the Doppler shift and broadening of the return echoes. This broadening can yield rotational information for the nucleus and particle velocities for coma grains. We measure both circular polarizations of the returned echo, because the polarization properties of the echo can yield surface roughness information for the nucleus and information on coma grain sizes. Of the nine comets successfully observed, the nucleus was detected in six (all but Halley, C/2001 A2, and C/2002 O6) and coma grains were detected in five (Harmon et al., 2004).
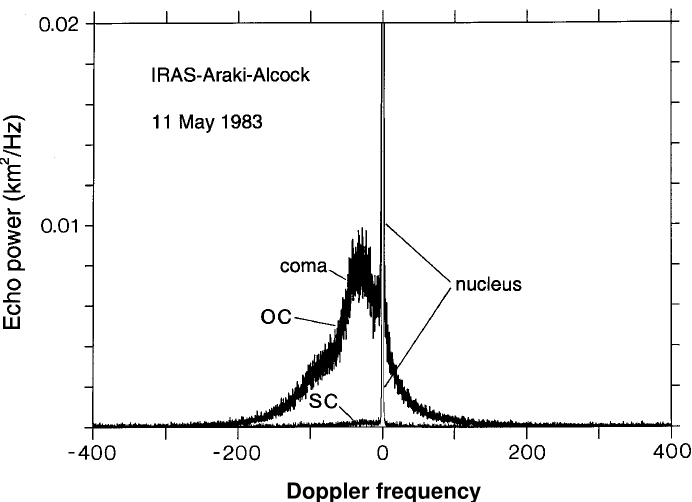
For a cometary echo, two different mechanisms introduce Doppler broadening. These are illustrated in Fig. 1, which shows the echo power spectrum of IRAS-Araki-Alcock taken at Arecibo in 1983 (Harmon et al., 1989). The central spike is an echo from the solid comet nucleus. Its frequency width is proportional to the rotation rate and diameter of the nucleus:
| (1) |
where is the velocity difference, with respect to the observer, between the approaching and receding edges, is the rotation period, is the nucleus equatorial diameter in the plane of the sky, is the angle between the comet’s spin axis and the line of sight, is the observing frequency, is the observing wavelength, and is the speed of light. The broader echo component from grains in the coma and its frequency width is due to the velocity dispersion (projected along the line of sight) of all coma particles within the beam that contribute to this part of the radar echo.
For IRAS-Araki-Alcock, the reflected power from the coma was almost entirely (%) in the opposite circular polarization (OC) from that transmitted (see Fig. 1), suggesting single scattering from small (Rayleigh) scatterers no larger than about 2 cm in size, but not much smaller, either (Harmon et al., 1989). The echo from the nucleus still shows most (90%) of the echo in the OC, with the other 10% in the same sense of circular polarization (SC) as that transmitted. Multiple scattering or reflection from a surface that is rough at wavelength scales has “depolarized” a portion of the echo power. The IRAS-Araki-Alcock observations were made when the comet was very close (0.033 AU) to the Earth, resulting in extremely strong echoes. No comparable opportunity has presented itself since.
3 Observations of C/2001 A2 (LINEAR)
Comet C/2001 A2 (LINEAR) was discovered on 2001 January 3 by the LINEAR near-Earth asteroid discovery program (Stokes et al., 2000). We observed the comet on 2001 July 7–10 with the Arecibo S-band radar. The observing circumstances are summarized in Table 1.
We transmitted a left-circularly-polarized, monochromatic 2380-MHz radio wave at a power of 900 kW, and observed the echo power spectrum in both left (SC) and right (OC) circular polarizations. We report the radar cross section , defined as the cross sectional area of a metal sphere that would reflect the same power as we measure. The radar albedo is then the ratio of the radar cross section to the physical cross section of the target. The polarization ratio is the ratio .
At the time of observations, the Arecibo telescope had a forward gain of 73 dB. The receiving system had an effective collecting area of 9 K/Jy (25000 m2) and a system noise temperature of about 25K. The gain, effective area, and system temperature vary by about 20% with telescope pointing, and we used values based on the actual pointing in data reduction. Every 10 s, we changed the transmitter frequency by 10 kHz, with a corresponding change applied in the data processing, in order to obtain a measurement of the background so that it could be accurately subtracted.
It is not feasible to simultaneously transmit and receive with the same antenna, so we transmitted for the round-trip light time to the comet and then, shortly before the reflected light arrived back at the antenna, turned off the transmitter and received the returned echo for the round-trip light time to the comet. The radial component of the overall (ephemeris) velocity of the comet was removed in the datataking process by introducing small offsets in the frequency of the transmitted signal to compensate for the Doppler shift of the center of mass of the target as predicted by an ephemeris based on previous optical observations.
C/2001 A2 fragmented several times before (and perhaps after) our observations. For these observations, the pointing and Doppler ephemerides were for the “B” fragment, at that time apparently the only visible fragment (Sekanina et al., 2002), though other fragments and their remnants may have been in the beam, particularly fragments D, E, and F (see Section 5).
Echo power spectra of C/2001 A2 on 2001 July 7–9 are shown in Fig. 2, and their parameters are summarized in Table 1. The relatively broad OC echo power spectrum peaked near the predicted ephemeris Doppler shift, and had a width of at least 900 Hz (57 ) on each date. The echo is asymmetric, with more power in the receding (negative Doppler shift) direction. Asymmetry was also clear in the coma echoes from IRAS-Araki-Alcock (Fig. 1) and Hyakutake (Harmon et al., 1997).
The SC echo power is about 25% that of the OC power. Its spectrum appears to have a somewhat narrower bandwidth than that of the OC echo, although this apparent difference may be due to the lower SNR.
3.1 Measurement Uncertainty
The uncertainties in the reported values are dominated by calibration errors, not random noise: The thermal noise is % for on each day. The systematic errors in the cross sections include calibration uncertainties for the transmitter power, the antenna performance, and the receiver thermal noise, and total to about 30%. In the polarization ratio , all but the receiver noise calibration uncertainties cancel, and the systematic uncertainty is only about 5%. The day-to-day variations in these systematic calibration errors are also smaller, about 5–10%. The day-to-day variation in the OC and total cross section is %, and thus statistically significant, but the other parameters are not.
3.2 Nucleus or Coma?
Our conclusion depends on the observed SC echo being reflection from coma grains, so we first examine the hypothesis that the echo could come from the nucleus instead. These spectra do not show the “spike plus skirt” pattern that distinguished the coma from the nucleus echo in (for example) the IRAS-Araki-Alcock spectra. The SC echo appears to be at least 300 Hz wide. The rotation period of the nucleus has been estimated at either 6 or 3 hours by Woodney et al. (2001). Assuming the same radar albedo as IRAS-Araki-Alcock (4%, the lowest well-determined comet radar albedo (Harmon et al., 1999)), a nucleus larger than 3 km diameter with rotation period of at least three hours would have been detectable with a few Hz bandwidth at on July 7, The strongest narrow features that could be from the nucleus are present only at the 3- significance level, so we consider 3 km to be an upper limit to the nucleus diameter. In order to have a bandwidth of 300 Hz, the nucleus would have to be at least 30 km in diameter, which would have been visible optically about 5 magnitudes brighter than was actually observed in January and February 2001. Thus, from the large bandwidth and overall echo spectrum shape we conclude that the echo power was dominated by reflections from coma grains. The nucleus may contribute to the peak of the echo, but it cannot be distinguished.
3.3 Coma Echo
The spectra in Fig. 2 show that there is a substantial SC echo. Although this degree of depolarization is typical of comet nuclei, we have shown that the SC echoes cannot have come from the nucleus. Hence, we conclude that significant depolarization () was introduced in the radar backscatter from large-grain coma. This is in stark contrast to the coma echo from IRAS-Araki-Alcock (Fig. 1), which had only 1.4%. Cometary grain comae are too sparsely populated to give significant depolarization from multiple scattering (Harmon et al., 1989, 2004), so any detectable depolarization must arise from the single scattering off individual irregular grains. Depolarization from irregular grains is small ( 0.1–3%) for sizes in the Rayleigh () regime and increases rapidly to large values ( 10–50%) as the radius increases beyond the threshold (Harmon et al., 1989). The precise depolarization behavior depends on the grain density and degree of irregularity. For example, the transition size can be somewhat larger than for low-density grains. If the differential grain size distribution is described by a power law with a cutoff radius , then the strong Rayleigh dependence for the grain backscatter efficiency will tend to make the echo depolarization be dominated by the larger grains unless the size distribution is incredibly steep (), so that can be quite sensitive to whether is larger or smaller than . For IRAS-Araki-Alcock, the case was made, based on total-mass arguments and the low depolarization, that must have been of the order of, but not much smaller than, , which is 2 cm for the 13 cm wavelength used (Harmon et al., 1989), and that a cutoff size of this order was consistent with the gravity-limit against gas-drag (see Section 4). A comet with a smaller nucleus size or higher gas flux than IRAS-Araki-Alcock could have larger than , and hence show significant depolarization. Both Halley (Campbell et al., 1989) and Hyakutake (Harmon et al., 1997) did, in fact, show hints of non-negligible depolarization, although in both cases the SNR was too low to be certain. Thus, the new depolarization results for C/2001 A2 provide the first unambiguous radar evidence for large grains with sizes of several centimeters or more.
If the SC spectrum really is narrower than the OC spectrum, it may be due to a dispersion in ejection velocity as a function of grain size, because only large particles ( 2 cm) give substantial SC echo, and larger particles are likely slower moving (see Section 4). Note that, unlike the case of a rotating solid body, there is no direct spatial information in the Doppler spectrum of the coma: The coma is assumed to fill the radar beam, and we observe the echo of the entire population of grains.
The radar cross-section shows day-to-day variations at the 20% level. These variations probably represent real differences in the grain population. There is also a hint of a “shoulder” on the low-frequency tail of the spectrum. Since small grains are more easily accelerated to higher velocities than large ones, it is possible that this shoulder appears where the grain size approaches the Rayleigh scattering limit (2 cm for these observations), reducing the scattering efficiency, and thus the cross section at high velocity. The spectrum of C/2002 O6 (SWAN) shows a similar shoulder (Harmon et al., 2004), but in both cases, the data are too noisy to address this idea in detail.
4 Grain-Coma Modeling
4.1 Grain Ejection
We have modeled the grain coma in order to estimate the characteristic grain velocity, place constraints on the grain ejection direction, and estimate the nucleus mass-loss rate in grains. We adopt the approach taken in modeling the coma radar echoes from comets IRAS-Araki-Alcock (Harmon et al., 1989) and Hyakutake (Harmon et al., 1997). The starting point is the canonical gas-drag model for dust release originally proposed by Whipple (1951) and adapted later by others (see Harmon et al., 1989, Harmon et al., 2004, and references therein).
According to this theory, the radial gas drag from an outgassing nucleus of radius accelerates a grain of radius from the surface to a terminal velocity given by
| (2) |
where
| (3) |
is a velocity scale factor and
| (4) |
is the radius of the largest grain that can be lifted off the surface against nucleus gravity. Here, is a drag coefficient, is the gas velocity, assumed to be the thermal expansion velocity at temperature , is the gas mass flux at the surface, is the gravitational constant, is the mean density of the nucleus, and is the density of a grain.
Since grains are presumably accelerated in jets, where the gas velocity is considerably higher than the simple thermal expansion velocity, the scale factor will tend to be larger for comets with more violent jetting.
We assume simple forms for the grain ejection directions and grain size distributions. The grains are ejected in a conical fan, and the grain radii are assumed to be power-law distributed as . Again, the grains are presumably ejected from illuminated jets, not a uniform cone. We compute the Doppler spectrum from the radial components of the terminal velocities of the entire ensemble of grains within the radar beam, assuming a stable fan of continuously ejected grains, and accounting for their orbital motion. We then adjust and fan direction to match the width and asymmetry of the observed spectrum.
In broad terms, the size distribution of the particles determines the shape of the spectrum: a steep distribution will have many small grains, which can be accelerated to a high velocity, and give a broad “skirt” to the spectrum. The velocity scale factor determines the actual width of the spectrum, as long as the size distribution is steep enough that the small particles dominate the echo. A fan (as opposed to isotropic) shape is required to give an asymmetric spectrum. Changing the cone angle of the fan affects the spectrum width, with a narrower cone angle tending to reduce the breadth of the spectrum. However, we find that we need a broad cone angle (120∘), a steep size distribution and a large to model the rather broad observed spectrum, so that the effects of adjusting the cone angle will be minor, and cannot be easily distinguished from those of adjusting the jet orientation.
The numerical results that follow assume that the grain density and the nucleus density , surface temperature and radius km.
Assuming a conical ejection fan of width 120∘ and a power-law index , we get good fits for certain fan directions by using . An example of a model spectrum giving a good fit is shown in Fig. 3. This example corresponds to an Earth-comet-fan direction of (165∘, 0∘). The coordinate pair represents cometocentric azimuth and elevation relative to the comet orbit plane, with azimuth given relative to the Sun direction, so that an antisolar tail would be in the (180∘, 0∘) direction. The most sunward fan direction giving a good fit is (, ). A precisely sunward (0∘, 0∘) fan does not fit the data because of its positive Doppler offset, as shown in Fig. 3. The relationships between the Sun, the comet fan direction and the viewing geometry are illustrated in Fig. 4, which shows the geometry for the three fan directions discussed.
While we have discussed only two examples, there is a locus of fan directions that give a good fit corresponding to Sun-comet-fan angles varying from 50 to 165∘, depending on the plane-of-sky position angle. The radar observes the radial component of velocity of the grains with respect to the Earth. This radial component depends on the plane-of-sky direction because of the Keplerian motion of the grain particles. However, good fits are obtained for all directions with the same Earth-comet-jet angle, 100∘ from the Earth-comet direction (as shown in Fig. 4).
The velocity scale factor corresponds to for an cm grain (neglecting gravity). Changing the size distribution to an power law reduces the spectrum width to half that for the steeper power law because it weights the larger, slower grains more heavily. For this shallower power law, simply increasing is ineffectual at widening the spectrum, as increases at the same time. Hence, a simple gas-drag model suggests a steep () size distribution near the cm size scale in order to match the observations. Although the overall dust size spectral index averaged about 3.5 or 3.6 for Hyakutake and Halley, it can be closer to 4 at the largest grain sizes or when the grains are undergoing fragmentation (Fulle et al., 1995, Fulle et al., 1997).
The 36 cm1/2 scaling factor (for ) is similar to that estimated for the coma echo from Comet Hyakutake and significantly larger than that estimated for IRAS-Araki-Alcock and Halley, as shown in Table 2. This high implies that the gas drag effect for C/2001 A2 is strong and capable of lifting off large grains of the size needed to account for the observed depolarization. For example, if one assumes km and , then using this value in Eq. 4 gives m, which is more than enough to accommodate a significant population of large, depolarizing grains. One can see why IRAS-Araki-Alcock would have a much smaller comparable with the Rayleigh transition size , since the smaller and larger radius for that comet ( km) would make the factor in Eq. 4 about a factor of 100 smaller than for C/2001 A2. Radio observations of OH molecules give line widths suggesting that C/2001 A2 has a comparable gas outflow velocity (about 600 ) to Halley and Hyakutake (Lovell et al., 2005, Crovisier et al., 2002). Thus, nucleus size may be the most important contributor to large-grain ejection.
If one inserts into Eq. 3 and assumes , , and a grain temperature of 250K (implying a gas velocity of 270 ), then solving for gives a value of for the gas flux, which is similar to that obtained for Hyakutake (Harmon et al., 1997) and an order of magnitude larger than the nominal sublimation rate for clean water ice at 1 AU. Such high apparent gas fluxes might be possible if the grain ejection were explosive or jet-like, also consistent with the observed OH line width velocity of 600 Lovell et al. (2005). A high would also give a more reasonable surface active fraction than the extremely high values obtained when one combines the nucleus size upper limit and measured gas production rates for this comet with the canonical value for sublimating ice. On the other hand, the observed velocities could be achieved with a smaller if the grains were extremely fluffy (with a higher drag coefficient and lower grain density). Also, the gas flux at the nucleus would be irrelevant if rocket forces from their own outgassing accelerated the grains (as discussed later).
4.2 Mass Loss
Our basic model of stable and continuous grain ejection can also be used to estimate the rate of mass loss from the central (nuclear) source. This involves calculation of the grain production rate required to replenish the population of grains traversing and ultimately exiting the radar beam. One approach is to calculate as a function of the gravity-limited size assuming to be an implicit function of via Eq. 3, as was done for IRAS-Araki-Alcock (Harmon et al., 1989). Alternatively, one can estimate from the spectrum width and then estimate as a function of some non-gravitational size cutoff (), as done for Hyakutake (Harmon et al., 1997, 1999). For C/2001 A2 we take the latter approach, given that our estimated gravitational cutoff from Eq. 3 is much larger than and therefore uninteresting as a constraint on . In this case, assuming isotropic grain ejection, the mass-loss rate required to give an observed radar cross section is given by
| (5) |
where
| (6) |
Here is the half-width of the radar beam at the comet and is the grain backscatter efficiency computed from Mie theory assuming spherical grains. In Fig. 5 we show the calculated curve for and m. We also plot a curve for mm in order to show the contribution from the largest grains. The steep slope at low reflects the strong Rayleigh dependence for . However, since we know that cm from the depolarization, then must actually lie somewhere on the flat part of the curve. This means that the large-grain was 1–3. For comparison, mass-loss rates in (1–10m) dust from this comet were estimated from optical spectra to be between late June and mid-July, 2001 (Schleicher and Greer, 2001; Rosenbush et al., 2002), while gas production rates during this same period varied between 1–2 during quiescent conditions (Schleicher and Greer, 2001; Lecacheux et al., 2001) to 6–9 during outburst (Feldman et al., 2002). Thus, we find that the mass in large grains is about 10 times the mass in 1–10 m dust, and comparable with the quiescent gas production. Table 2 shows that all of the comets with observable grain coma show . It is important to note that our estimated mass-loss rates assume that the grains remain intact from the time they leave the nucleus to the time they exit the radar beam. If the grains were, in fact, disintegrating or evaporating during this time, then the beam would not be filled and our curves could underestimate the true mass loss and large grain production. Conversely, if there is a continuous resupply of grains from the breakup of larger boulders or nucleus fragments, then the calculated is an overestimate. The beam diameter was about 16000 km for these observations (see Table 1). For comparison, the IRAS-Araki-Alcock radar echo was apparently contained within 2000 km (Campbell et al., 1983, Harmon et al., 1989), but as that comet showed no depolarized echo, it presumably had smaller grains that could evaporate more quickly.
5 Fragmentation and Grain Production
The comet was observed to fragment several times before and after we observed it (Sekanina et al., 2002). Although our assumption so far has been that the large grains were gas-drag ejecta from the surface of nucleus B, the fact that C/2001 A2 was a fragmenting object raises other possibilities. An interesting alternative is that the large grains were produced by, or were secondary products of, one or more of the observed episodes of nucleus fragmentation or splitting. Six fragments (A, G, C, D, E, F) were observed to separate from the main object (B) between late March and mid-June, 2001, and three visual-magnitude outbursts (presumed to be associated with some of the fragmentation events) were seen on March 28, May 10, and June 5 (Sekanina et al., 2002). A fourth outburst with no identifiable fragment association was observed on July 11, two days after the last radar observation. The possibility that the radar-reflecting grains were related in some way to the last (D-E-F) fragmentations of June 7–11 is consistent with the antisolar motion of these fragments. In fact, the observed 210–240∘ position angles observed for these separating fragments (relative to the main nucleus B) between mid and late June (Sekanina et al., 2002) also fit the radar-observed velocity, projected from its most antisolar possible direction, 165∘ from the Sun. Grains accelerated to the observed velocities during these fragmentations would have cleared out of the antenna beam by the time of the radar observations: Extrapolating the model of Sekanina et al. (2002) to our observation dates, fragment D should have left the beam, but fragments E and F may have remained within it. Fragments D-E-F had disappeared more than a week before these observations, but there may have been remnants. Moreover, grains and boulders produced in secondary breakups of fragments might tend to remain moving at the same slow () velocities as their parents. However, if grains produced in secondary fragmentation contained volatiles, then the rocket force produced by outgassing from their sunward sides could easily accelerate the grains down the antisolar tail to the observed velocities (Harris et al., 1997; Hughes, 2000; Bockelée-Morvan et al., 2001). The grain velocity from the rocket force after a time is given by . Hence, grains can accelerate to the velocities shown in Fig. 2 in as little as an hour, depending on the grain volatile content, though it is not clear whether the acceleration is directional enough to produce the observed velocities without simply pinwheeling the grains. Even this pinwheeling could affect the resulting spectrum, by increasing the apparent velocity dispersion of the grains: a 10 cm radius grain rotating at 10 revolutions per second would give an echo bandwidth of up to 100 Hz. Pinwheeling would not explain the asymmetry in the spectrum, however. It is possible that a train of icy debris left over from the D-E-F fragmentation event, and undergoing continuous secondary fragmentation, could account for the radar-reflecting grain population observed long after the major fragmentation event itself. The gas produced in such secondary fragmentation could also account for the coma wings or “arclets” that were observed symmetric about the tail axis of this comet. Jehin et al. (2002) reported arclets from observations on May 16 and July 13. In addition, Woodney et al. (2002) observed CN arcs on June 29-30 that were symmetric about a 250∘ position angle axis. Such arcs, which were also observed with comets Hyakutake and C/1999 S4 (LINEAR), may be produced when gas from a tailward debris train interacts with gas from the main nucleus (Harris et al., 1997; Rodionov et al., 1998; Boehnhardt, 2002). The possible analogy with Hyakutake is particularly relevant here, as Harmon et al. (1997) suggested that the radar coma echo from that comet may have come from the condensation of large grains invoked by Harris et al. (1997) to explain the gas arcs and other features.
It is possible that the radar coma grains were not products of the D-E-F fragmentation but rather of some lesser fragmentation event that occurred sometime between the D-E-F event and July 7 and which did not produce any large visible fragments. For example, the CN arcs during June 29-30 (Woodney et al., 2002) could be an indicator of a late-June fragmentation event, although they may also have been a delayed response to the D-E-F fragmentations. Another interesting possibility is that the radar grains were produced in some unobserved fragmentation event just preceding and triggering the July 11 outburst (labeled “outburst IV” by Sekanina et al., 2002). This seems plausible given that outbursts I, II, and III (which Sekanina et al. attribute to secondary disintegration of fragmentation debris into fine dust) all peaked a few days after their associated fragmentation events. Hence, fresh fragmentation debris may have been present during the radar observations and before the outburst itself. The arclet and narrow tailward dust spike observed by Jehin et al. (2002) on July 13 might have been gas and dust products of the fragmentation of the same large grains responsible for the radar coma echoes. Since it would have taken at least four days for a 1-cm grain to clear out of the radar beam (at the maximum observed velocity of 50 ), some of the radar coma grains associated with an outburst-IV fragmentation could also have come directly from the nucleus rather than from secondary fragmentation. The fact that the days up to and including outburst IV were likely to have been a time of chaotic activity suggests that one might have expected to see some day-to-day changes in the radar echoes. This may, in fact, explain some of the echo shape variations that were seen. Finally, it is worth noting that the observation of the Hyakutake coma echo (Harmon et al., 1997) was made only four days after a major outburst from that comet (Schleicher and Osip, 2002). Hence, it is possible that the coma echoes for both C/2001 A2 and Hyakutake reflected enhanced grain injection associated with outbursts, although the time sequence for the radar observations and the outbursts was reversed between the two comets.
6 Comparison with Other Comets
Table 3 shows the model results from Section 3, along with total water production rates and velocities estimated using other observations. The required gas flux per unit surface area and particle acceleration parameter are similar to that observed in Hyakutake, and quite different from that of Halley and IRAS-Araki-Alcock. For this purpose, C/2001 A2 and Hyakutake have high grain velocities (HGV) and Halley and IRAS-Araki-Alcock have low grain velocities (LGV). The model parameter is about a factor of 6 higher and the parameter about a factor of 100 higher in the HGV pair. We can also compare the total gas production from other observations.
The observed gas velocities are all within a factor of 2 of 1 , and do not correlate with the parameter. Unfortunately, the estimate of gas velocity for IRAS-Araki-Alcock is very uncertain. The velocities should be considered further with data on more objects.
The model uses estimates of the gas flux per unit surface area . We compare these to the observed gas production rate from passive observations of the OH radical at 1667 MHz. We use the estimated surface area of the comets and compute for comparison. We expect to be smaller than , because the comet is not active over its entire surface. We can then further compute an active fraction .
Table 3 shows that the HGV objects have areal gas fluxes that are larger than the LGV objects. The difference is perhaps not conclusive for C/2001 A2, but recall that we only have an upper limit on the size of its nucleus. Since the area goes as , the areal flux may easily be substantially larger.
The correlation between gas production (per unit area) and large-grain velocity seems significant. They may both be related to the fact that both C/2001 A2 and Hyakutake suffered breakup events (Sekanina et al., 2002, Schleicher and Woodney, 2003), which likely produced a lot of gas and dust. C/2001 A2 and Hyakutake were also both much smaller than Halley and IRAS-Araki-Alcock, which may have influenced dust production as well.
7 Conclusions
The radar observations of C/2001 A2 (LINEAR) place an upper limit of only 3 km for diameter of the nucleus and yet yield a grain-coma echo with a cross section second only to that from Comet Halley. These results, combined with other (non-radar) observations, establish C/2001 A2 as a small but active comet similar to Hyakutake. Like Hyakutake, this comet showed characteristic grain velocities of several tens of meters per second, substantially higher than for the grain-coma echoes from IRAS-Araki-Alcock and Halley.
Perhaps the most important new result from these observations is the detection of significant depolarization in the coma echo. The earlier radar observations of comets Halley and Hyakutake showed hints of depolarization, and mass-loss arguments had always implied the dominance of cm-size or larger grains in the radar coma echoes. Nevertheless, this solid detection of substantial echo depolarization provides the first unambiguous radar evidence for coma grains larger than the Rayleigh transition size = 2 cm. The marked contrast with the IRAS-Araki-Alcock coma echo, which showed only 1.4% depolarization, is explainable with the simple gas-drag theory. The higher gas flux (inferred from the high grain velocities) and smaller nucleus size for C/2001 A2 would be expected to give a gravitational grain size limit much larger than the Rayleigh transition size. The fact that C/2001 A2 was a fragmenting and outbursting object suggests that a simple gas-drag model with a nucleus-centered source may not tell the whole story for this comet. The observation of antisolar fragmentation, gas arcs, and dust trains suggest that secondary grain fragmentation and tailward self-acceleration could have been important processes. These processes are at least consistent with the negative Doppler offset of the echo and could also explain the high grain velocities. We note that these same comments could apply just as well to Comet Hyakutake, another fragmenting and outbursting comet showing similar radar characteristics. Thus, while it is not clear that the simple gas-drag model adequately describes C/2001 A2, it provides a framework in which we can determine that the radar data require a reasonably compact fan of ejected grains in a direction no closer than 45∘ to sunward, and also a steep (radius exponent ) size distribution of particles at cm-scales. Significant mass loss for this comet occurs in the form of cm-size grains, suggesting that large grains may also be present in other small, active comets. Future comet radar observations and comparisons with optical and other measurements should shed more light on large-grain production processes in active comets.
References
- Asphaug and Benz (1996) Asphaug, E., Benz, W., 1996. Size, density, and structure of comet Shoemaker-Levy 9 inferred from the physics of tidal breakup. Icarus 121, 225–248.
- Biver et al. (2002) Biver, N., Bockelée-Morvan, D., Colom, P., Crovisier, J., Henry, F., Lellouch, E., Winnberg, A., Johansson, L. E. B., Gunnarsson, M., Rickman, H., Rantakyrö, F., Davies, J. K., Dent, W. R. F., Paubert, G., Moreno, R., Wink, J., Despois, D., Benford, D. J., Gardner, M., Lis, D. C., Mehringer, D., Phillips, T. G., Rauer, H., 2002. The 1995-2002 long-term monitoring of comet C/1995 O1 (Hale-Bopp) at radio wavelength. Earth Moon and Planets 90, 5–14.
- Biver et al. (1999) Biver, N., Bockelée-Morvan, D., Crovisier, J., Davies, J. K., Matthews, H. E., Wink, J. E., Rauer, H., Colom, P., Dent, W. R. F., Despois, D., Moreno, R., Paubert, G., Jewitt, D., Senay, M., 1999. Spectroscopic monitoring of comet C/1996 B2 (Hyakutake) with the JCMT and IRAM radio telescopes. Astron. J. 118, 1850–1872.
- Bockelée-Morvan et al. (2001) Bockelée-Morvan, D., Biver, N., Moreno, R., Colom, P., Crovisier, J., Gérard, E., Henry, F., Lis, D. C., Matthews, H., Weaver, H. A., Womack, M., Festou, M. C., 2001. Outgassing behavior and composition of comet C/1999 S4 (LINEAR) during its disruption. Science 292, 1339–1343.
- Boehnhardt (2002) Boehnhardt, H., 2002. Comet splitting — Observations and model scenarios. Earth Moon and Planets 89, 91–115.
- Burns et al. (1979) Burns, J. A., Lamy, P. L., Soter, S., 1979. Radiation forces on small particles in the solar system. Icarus 40, 1–48.
- Campbell et al. (1983) Campbell, D. B., Harmon, J. K., Hine, A. A., Shapiro, I. I., Marsden, B. G., Pettengill, G. H., 1983. Arecibo radar observations of comets IRAS-Araki-Alcock and Sugano-Saigusa-Fujiwara. Bull. Am. Astron. Soc. 15, 800.
- Campbell et al. (1989) Campbell, D. B., Harmon, J. K., Shapiro, I. I., 1989. Radar observations of comet Halley. Astrophys. J. 338, 1094–1105.
- Crovisier et al. (2002) Crovisier, J., Colom, P., Gérard, E., Bockelée-Morvan, D., Bourgois, G., 2002. Observations at Nançay of the OH 18-cm lines in comets: The data base. Observations made from 1982 to 1999. Astron. Astrophys. 393, 1053–1064.
- Eberhardt (1999) Eberhardt, P., 1999. Comet Halley’s Gas Composition and Extended Sources: Results from the Neutral Mass Spectrometer on Giotto. Space Science Reviews 90, 45–52.
- Feldman et al. (2002) Feldman, P. D., Weaver, H. A., Burgh, E. B., 2002. Far Ultraviolet Spectroscopic Explorer observations of CO and H2 emission in comet C/2001 A2 (LINEAR). Astrophys. J. 576, L91–L94.
- Fulle (2004) Fulle, M., 2004. Motion of cometary dust. In: Festou, M. C., Keller, H. U., Weaver, H. A. (Eds.), Comets II, U. of Arizona Press, pp. 565–575.
- Fulle et al. (1995) Fulle, M., Colangeli, L., Mennella, V., Rotundi, A., Bussoletti, E., 1995. The sensitivity of the size distribution to the grain dynamics: Simulation of the dust flux measured by GIOTTO at P/Halley. Astron. Astropys. 304, 622–630.
- Fulle et al. (1997) Fulle, M., Mikuz, H., Bosio, S., 1997. Dust environment of comet Hyakutake 1996 B2. Astron. Astropys. 324, 1197–1205.
- Gèrard et al. (1987) Gèrard, E., Bockelée-Morvan, D., Bourgois, G., Colom, P., Crovisier, J., 1987. 18-cm wavelength radio monitoring of the OH radical in comet P/Halley 1982i. Astron. Astrophys 187, 455–461.
- Gèrard et al. (1998) Gèrard, E., Crovisier, J., Colom, P., Biver, N., Bockelée-Morvan, D., Rauer, H., 1998. Observations of the OH radical in comet C/1996 B2 Hyakutake with the Nançay radio telescope. Planet. Space Sci. 46, 569–577.
- Gunnarsson (2003) Gunnarsson, M., 2003. Icy grains as a source of CO in comet 29P/Schwassmann-Wachmann 1. Astron. Astrophys. 398, 353–361.
- Harmon et al. (1989) Harmon, J. K., Campbell, D. B., Hine, A. A., Shapiro, I. I., Marsden, B. G., 1989. Radar observations of comet IRAS-Araki-Alcock 1983d. Astrophys. J. 338, 1071–1093.
- Harmon et al. (1999) Harmon, J. K., Campbell, D. B., Ostro, S. J., Nolan, M. C., 1999. Radar observations of comets. Planetary and Space Science 47, 1409–1422.
- Harmon et al. (2004) Harmon, J. K., Nolan, M. C., Ostro, S. J., Campbell, D. B., 2004. Radar studies of comet nuclei and grain comae. In: Festou, M. C., Keller, H. U., Weaver, H. A. (Eds.), Comets II, U. of Arizona Press, pp. 265–279.
- Harmon et al. (1997) Harmon, J. K., Ostro, S. J., Benner, L. A. M., Rosema, K. D., Jurgens, R. F., Winkler, R., Yeomans, D. K., Choate, D., Cormier, R., Giorgini, J. D., Mitchell, D. L., Chodas, P. W., Rose, R., Kelley, D., Slade, M. A., Thomas, M. L., 1997. Radar detection of the nucleus and coma of comet Hyakutake (C/1996 B2). Science 278, 1921–1924.
- Harris et al. (1997) Harris, W. M., Combi, M. R., Honeycutt, R. K., Mueller, B. E. A., 1997. Evidence for interacting gas flows and an extended volatile source distribution in the coma of comet C/1996 B2 (Hyakutake). Science 277, 676–681.
- Hughes (2000) Hughes, D. W., 2000. On the velocity of large cometary dust particles. Planet. Space Sci. 48, 1–7.
- Irvine et al. (1984) Irvine, W. M., Abraham, Z., A’Hearn, M., Altenhoff, W., Andersson, C., Bally, J., Batrla, W., Baudry, A., Bockelée-Morvan, D., Chin, G., Crovisier, J., de Pater, I., Despois, D., Ekelund, L., Gèrard, E., Hasegawa, T., Heiles, C., Hollis, J. M., Huchtmeier, W., Kaifu, N., Levreault, R., Masson, C. R., Palmer, P., Perault, M., Rickard, L. J., Sargent, A. I., Scalise, E., Schloerb, F. P., Schmidt, J., Stark, A. A., Stevens, M., Stumpff, P., Sutton, E. C., Swade, D., Sykes, M., Turner, B., Wade, C., Walmsley, M., Webber, J., Winnberg, A., Wootten, A., 1984. Radioastronomical observations of comets IRAS-Araki-Alcock (1983d) and Sugano-Saigusa-Fujikawa (1983e). Icarus 60, 215–220.
- Jehin et al. (2002) Jehin, E., Boehnhardt, H., Sekanina, Z., Bonfils, X., Schütz, O., Beuzit, J., Billeres, M., Garradd, G. J., Leisy, P., Marchis, F., Más, A., Origlia, L., Scarpa, D., Thomas, D., Tozzi, G. P., 2002. Split comet C/2001 A2 (LINEAR). Earth Moon and Planets 90, 147–151.
- Jewitt and Matthews (1997) Jewitt, D. C., Matthews, H. E., 1997. Submillimeter continuum observations of comet Hyakutake (1996 B2). Astrophys. J. 113, 1145–1151.
- Lecacheux (2001) Lecacheux, A., 2001. Comet C/2001 A2 (LINEAR). IAU Circ. 7706, 2.
- Lovell (1999) Lovell, A. J., 1999. Millimeter-Wave Molecular Mapping of Comets Hyakutake and Hale-Bopp. Ph.D. thesis, Univ. Massachusetts, Amherst.
- Lovell et al. (2005) Lovell, A. J., Howell, E. S., Schloerb, F. P., 2005. Observations and modeling of 18cm OH lines in eight comets, to Be Submitted.
- McDonnell et al. (1991) McDonnell, J. A. M., Lamy, P. L., Pankiewicz, G. S., 1991. Physical properties of cometary dust. In: IAU Colloq. 116: Comets in the post-Halley era, ASSL Vol. 167, pp. 1043–1073.
- Reach et al. (2000) Reach, W. T., Sykes, M. V., Lien, D., Davies, J. K., 2000. The formation of Encke meteoroids and dust trail. Icarus 148, 80–94.
- Rodionov et al. (1998) Rodionov, A. V., Jorda, L., Jones, G. H., Crifo, J. F., Colas, F., Lecacheux, J., 1998. Comet Hyakutake gas arcs: First observational evidence of standing shock waves in a cometary coma. Icarus 136, 232–267.
- Rosenbush et al. (2002) Rosenbush, V., Kiselev, N., Velichko, S., 2002. Polarimetric and photometric observations of split comet C/2001 A2 (LINEAR). Earth Moon and Planets 90, 423–433.
- Schleicher and Greer (2001) Schleicher, D., Greer, R., 2001. Comet C/2001 A2 (LINEAR). IAU Circ. 7653, 1.
- Schleicher and Osip (2002) Schleicher, D. G., Osip, D. J., 2002. Long- and short-term photometric behavior of comet Hyakutake (1996 B2). Icarus 159, 210–233.
- Schleicher and Woodney (2003) Schleicher, D. G., Woodney, L. M., 2003. Analyses of dust coma morphology of comet Hyakutake (1996 B2) near perigee: Outburst behavior, jet motion, source region locations, and nucleus pole orientation. Icarus 162, 190–213.
- Sekanina et al. (2002) Sekanina, Z., Jehin, E., Boehnhardt, H., Bonfils, X., Schuetz, O., Thomas, D., 2002. Recurring outbursts and nuclear fragmentation of comet C/2001 A2 (LINEAR). Astrophys. J. 572, 679–684.
- Stokes et al. (2000) Stokes, G. H., Evans, J. B., Viggh, H. E. M., Shelly, F. C., Pearce, E. C., 2000. Lincoln near-Earth asteroid program (LINEAR). Icarus 148, 21–28.
- Sykes et al. (1986) Sykes, M. V., Lebofsky, L. A., Hunten, D. M., Low, F., 1986. The discovery of dust trails in the orbits of periodic comets. Science 232, 1115–1117.
- Whipple (1951) Whipple, F. L., 1951. A comet model. II. Physical relations for comets and meteors. Astrophys. J. 113, 464–474.
- Woodney et al. (2002) Woodney, L. M., Barkume, K. M., Schleicher, D. G., 2002. Modeling the morphology of comet LINEAR (2001 A2). Bull. Am. Astron. Soc. 34, 868.
- Woodney et al. (2001) Woodney, L. M., Schleicher, D. G., Greer, R., 2001. Activity and morphology of comet LINEAR (2001 A2). Bull. Am. Astron. Soc. 33, 1121.
| UTC Mid-Time | RTT | Runs | R | Beam | Angle | Integration | Total | |||||
|---|---|---|---|---|---|---|---|---|---|---|---|---|
| (s) | (AU) | (AU) | (km) | (s) | (km2) | (km2) | (km2) | |||||
| 2001 July 7 08:53:44 | 262 | 13 | 0.262 | 1.132 | 16155 | 58∘ | 3210 | 4.10 | 1.20 | 5.30 | 0.27 | |
| 2001 July 8 09:29:53 | 268 | 4 | 0.268 | 1.145 | 16497 | 55∘ | 920 | 3.36 | 0.82 | 4.18 | 0.24 | |
| 2001 July 9 08:12:14 | 274 | 8 | 0.274 | 1.158 | 16878 | 53∘ | 1920 | 4.98 | 1.47 | 6.45 | 0.30 | |
| Sum | 6050 |
Note. — Echo power results are given for each day of observations and the variance-weighted sum of all days. RTT is the round-trip light time to the object. “Runs” is the number of transmit-receive cycles. Each cycle is 2 RTTs long. is the Earth-comet distance. is the comet-Sun distance. “Beam” is the diameter to the -power points of the telescope beam at the distance of the comet, or half-power considering the two-way path. “Angle” is the Sun-comet-Earth angle. and are the OC and SC radar cross-sections. is the circular polarization ratio . The random errors (due to thermal noise in the telescope and detector) for the cross-sections are a few percent. However, we estimate the systematic calibration uncertainties to be 30%, as reported for the summed results. The uncertainties in the individual values are discussed in the text. The day-to-day variations in are %, and probably reflect real changes in the comet.
| Comet | Date | |||||||||
|---|---|---|---|---|---|---|---|---|---|---|
| (AU) | (km2) | (km) | () | () | () | |||||
| C/2001 A2 | 2001-07-08 | 0.27 | 4.43 | 2 | 3.9 | m | 36 | 1–3 | ||
| HalleyaaCampbell et al. (1989). The low SNR prevented a reliable SC detection. | 1985-11-29 | 0.63 | 32 | 10 | 3.5 | cm | 5ccHarmon et al. (1999) | 0.5– | ||
| IRAS-Araki-AlcockccHarmon et al. (1999) | 1983-05-11 | 0.03 | 0.80 | 8.8 | 3.5 | 3 cm | 8 | 0.3– | ||
| HyakutakeddHarmon et al. (1997) | 1996-03-24 | 0.11 | 1.33 | 2.5 | 3.5 | cm | 40 | |||
| C/2002 O6eeHarmon et al. (2004). No modeling has been done for C/2002 O6. Its spectrum is qualitatively similar to the spectrum of C/2001 A2, with a similar bandwidth, but the SNR is lower. | 2002-08-09 | 1.1 |
Note. — The dates are approximate mid-times. is the Earth-comet distance at the approximate mid-times. The coma cross sections all have systematic calibration uncertainties of 30%. 2 is the comet diameter assumed in the modeling. is the power-law exponent for the grain size distribution. is the velocity scale factor, either from a model fit or from Eqs. 3 and 4. is the gas flux at the surface required to lift particles of size off the surface. is the estimated mass in grains required to match the observed radar cross section using the model size distribution. Campbell et al. (1989) suggested for Halley may actually be larger than 2 cm, giving a proportionately larger . The same argument applies to Hyakutake.
| Comet | f | ||||||
|---|---|---|---|---|---|---|---|
| (AU) | (cm) | (cms-1) | (s-1) | (cms-1) | |||
| C/2001 A2 | 1.14 | 36 | 0.9 | 0.03aaSince we only have an upper limit to the diameter, this is a lower limit to the areal flux and active fraction. If the diameter is really 1 km, then this flux is 0.30 and the active fraction is 0.05. | 0.005aaSince we only have an upper limit to the diameter, this is a lower limit to the areal flux and active fraction. If the diameter is really 1 km, then this flux is 0.30 and the active fraction is 0.05. | 0.6bbLovell et al. (2005). | |
| Halley | 1.50 | 5 | 4–5ccGèrard et al. (1987). | 0.016 | 0.060 | 1.2 | |
| IRAS-Araki-Alcock | 1.004 | 8 | 2.5 | 0.01 | 0.025 | 1-2.5ddIrvine et al. (1984). The reported detections were very low SNR. | |
| Hyakutake | 1.08 | 40 | 30eeGèrard et al. (1998). The observations were from 1996 March 24. | 1.52 | 0.113 | 1ffLovell (1999). |
Note. — The gas flux is from Table 3, converted to molecules per second of H2O. The total gas production rates are measured values from the literature as indicated. is converted to an areal flux using the size estimate in Table 2, assuming all gas is from the nucleus. The active fraction is estimated as (.