11email: mario@head.cfa.harvard.edu 22institutetext: Instituto de Ciencias Nucleares, Ciudad Universitaria, Apartado Postal 70-543, CP 04510, México D.F., México.
22email: pablo,raga@nucleares.unam.mx 33institutetext: Instituto de Astronomía, Universidad Nacional Autónoma de México, Ciudad Universitaria, Apartado Postal 70–248, CP 04510, México D.F., México
33email: binette@astroscu.unam.mx
Precessing jets from a moving source and bright X-ray filaments in galaxy clusters
We present hydrodynamical calculations carried out with the 3D yguazú-a code of a precessing jet model, which interacts with a plane parallel wind. This scenario describes an extragalactic jet, in which the jet source is in motion with respect to the surrounding intra-cluster medium. From the numerical results, synthetic emission maps and spectra in X-ray band were obtained. We compare these predictions with observations of the radio jets emanating from the radio-galaxy 4C 26.42 (in the Abell 1795 galaxy cluster). We find that the general morphology of the radio jets can be described by a point-symmetric precessing jet system interacting with a plane parallel wind (i. e., the intra-cluster medium flowing past the galaxy). We also find that our synthetic X-ray emission maps reproduce the observed large scale structures (with sizes of the order of tens of kpc).
Key Words.:
Hydrodynamics – Methods: numerical– Galaxies: jets – X-rays: galaxies clusters1 Introduction
Extragalactic jets basically show three types of morphological structures (observed in radio-continuum, Zaninetti & Van Horn (1988)) : the linear shape, the tail or “C” shape and the “Z” (or “S”) shape. The “C” and “Z” shapes are generally interpreted as being caused by either the relative motion of the radio galaxy with respect to the ambient medium (“C-shape”) or by the precession of the jet direction (“Z”), respectively. A combination of both effects is probably present in most objects but one of them is usually starkly dominant. The orientation of the observer relative to the jet direction also plays an important role.
Several authors have studied extragalactic jets by means of numerical simulations. We can mention the MHD model developed by Pietrini & Torricelli-Ciamponi (1992) and Torricelli-Ciamponi & Pietrini (1993), where they analyze the formation of structures along the jet axis. Cox, Gull & Scheuer (1991) carried out 3D numerical simulations of precessing jets in order to explain the formation of hot-spots and the general morphology observed in extragalactic radio sources. Ferrari (1998) gives a thorough review about the modeling of extragalactic jets. Interestingly, in the arena of stellar jets, the “S-shape” has likewise been observed and modeled by invoking precession, such as in HH 34 (Masciadri et al. 2002, and references therein) or in the proto-planetary nebula Hen 3-1475 (Velázquez, Riera & Raga 2004 and references therein).
As examples of extragalactic jet with “S” shapes, we can mention the jet system from the radio source 4C 26.42 (in the Abell 1795 galaxy cluster, van Breugel et al. 1984 and Ge & Owen 1993), the radio galaxies 3C294 (Crawford et al. 2003), 3C 334 (Kellermann & Owen 1988) and 4C29.47 (Condon & Mitchell 1984). These jets are immersed in an intra-cluster medium (ICM) and their radio lobes can be asymmetric due to the motion of the jet source. This fact was reported by Hill et al. (1988) for the case of the radio source 4C 26.42, which is is in motion within the gravitational potential of the Abell 1795 cluster, having a peculiar radial velocity of 365 km s-1. However, Oegerle & Hill (1994) later revised this measurement and favored a lower value of 150 km s-1.
While the properties of extragalactic jets can be studied with radio-continuum observations, the ICM in which these objects are propagating can be detected in H or X-ray emission. Recently, a new generation of X-ray satellites (with the Advanced Camera for Imaging and Spectroscopy of Chandra, and XMM-Newton) have obtained images and spectra with good spatial and spectral resolution (respectively) of galaxy clusters containing radio jets.
X-ray and radio observations provide evidence of jet-ICM or ISM interactions. Zanni et al. (2003) and Reynolds, Heinz & Begelman (2001) (Rizza et al. 2000) carried out 2D (axisymmetric) and 3D numerical simulations, respectively, in order to analyze this interaction and its observational consequences. They report two main regimes for the jet-ICM interaction. In the first one, the jet cocoon expands into the ICM supersonically giving a shell-like morphology in the X-ray emission which surrounds the radio-jets. The second regime is characterized by a subsonic cocoon expansion. In this case, the X-ray emission is strong at the head of the jet, while the sides of the cocoon practically disappear. Zanni et al. (2003) found that the main parameter determining the appropriate regime is the jet kinetic power (or ram pressure).
The models listed in the last paragraph predict shell-like or partial shell-like morphology for the X-ray emission from jet-ICM interaction. However, several authors have reported that the X-ray emission of some galaxy clusters has bright filamentary structures embedded into diffuse emission (Fabian et al. 2001 for the Abell 1795 case; Crawford et al. 2003 for 3C294).
In this paper we explore the possibility that the jet-ambient gas interaction would lead to a filamentary morphology in X-ray, as a result of two processes: the precession of the point-symmetric jets and the displacement of the central galaxy with respect to the intra-cluster medium. We present numerical simulations carried out with the 3D yguazú-a code (Raga et al. 2000) which include these two effects.
This work is organized in the following way. In section 2 we present the model employed in our simulations, giving the initial conditions and describing the assumptions that have been made. We also explain how the derived X-ray emission is obtained from our numerical results. In Section 3, we present both the hydrodynamical simulations and the predicted X-ray emission maps. In Section 4 we analyze our numerical results and compare with observations and finally in section 5 we give our final discussion.
2 Description of the model
In order to model the interaction of an extragalactic radio-jet with the surrounding environment, we consider a model consisting of a point-symmetric, precessing jet system interacting with a plane-parallel wind.
We consider a point-symmetric, precessing jet system of fixed jet velocity, where the precession is characterized by a semi-opening angle and a precession period . The adopted parameters are listed in Table 1. An important aspect to consider is that, for example, the “S” morphology of some radio-jets exhibits some degree of asymmetry between the two radio lobes. This asymmetry can be produced by the motion of the cD galaxy with respect to the surrounding intra-cluster medium. Velocities in the range [150, 350] km s-1 have been observationally reported by Oergerle & Hill (1994) and Hill et al. (1988), for the case of the 4C 26.42 radio-jet. This effect has been explicitly taken into account in our models although, for computational purposes, the galaxy is deemed stationary within the 3D grid and it is the intra-cluster medium which is moving at a velocity of 300 km s-1.
2.1 Initial conditions and assumptions
In order to determine physical parameters of the extragalactic jets and the ICM, we have considered the observational results of van Breugel et al.(1984), Fabian et al.(2001) and Ettori et al.(2002).
3D numerical simulations were carried out with the yguazú-a code (Raga, Navarro-González & Villagrán-Muniz 2000), which integrates the gas-dynamical equations with a second order accurate technique (in time and space) employing the flux-vector splitting method of van Leer (1982). Our numerical simulations use a 5-level, binary adaptive grid, with a maximum resolution of 5.861020 cm, in a computational domain of (1.5, 1.5, 3.0)1023 cm, along the , and axis, respectively. The jets are injected at cm and cm (i.e. at the centre of the computational domain). An injection jet velocity cm s-1 a precession angle , and a precession period s were considered. The jet precession cone axis is aligned with the axis.
For the intra-cluster medium the temperature and the density were fixed at K and 0.1 cm-3 ( g cm), respectively (based on Chandra X-ray observations, Ettori et al. 2002). Also, the intra-cluster wind has a velocity of cm s-1, forming an angle of 60 with respect to the axis. For the jets we adopted a temperature and density of K and cm-3 ( g cm-3), respectively. The initial diameter and length of the jet were of cm (or 10 pixels) and cm (or 7 pixels), respectively. The jet and environmental parameters are summarized in Table 1.
The version of the yguazú-a code that we have used does not include radiative losses. This simplification is certainly acceptable since we find that the typical dynamical time Myr which characterizes our calculations is much shorter than the cooling time scale of 127 Myr.
| Parameter | Value |
|---|---|
| size | cm |
| size | cm |
| size | cm |
| ambient density, | 0.1 cm-3 |
| ambient temperature, | K |
| wind velocity, | cm s-1 |
| wind entrance angle, | |
| jet density, | cm-3 |
| jet temperature, | K |
| jet velocity, | cm s-1 |
| precession period, | s |
| half precession angle, |
Hereafter, we will call the model described in this subsection “model I”.
We note that our jet has a Mach number of , and at such a high Mach number that the jet pressure does not play an important role. Also, the ram pressure of the jet material is an order of magnitude higher than the environmental pressure, so that the jet is not “chocked”, and propagates supersonically (see Figure 12 of Zanni et al. 2003).
2.2 Other parameter values
In order to check how sensible our model I is with respect to changes of input parameters, we explored two other models. In model II, we have chosen a precession period five times shorter ( s) than in model I, keeping constant the other input parameters.
In model III, we have instead changed the incidence angle of the plane-parallel wind. We set its value at 90, i.e. the plane-parallel wind is actually moving in the direction.
2.3 Simulated X-ray maps and spectra
From our numerical results it is possible to obtain (through line-of-sight integrations) X-ray emission maps and also X-ray spectra. In this way, the numerical results can be directly compared with X-ray observations from satellites such as Chandra. Such comparisons have recently been made for other flows by Raga et al. (2001, for the case of the Arches cluster) and Velázquez et al. (2004, for the X-ray emission of the supernova remnants W44 and G296.5+10.0).
To calculate the emission coefficient, , we have used the chianti 111The chianti database and its associated idl procedures are freely available at: http://wwwsolar.nrl.navy.mil/chianti.html, http://www.arcetri.astro.it/science/chianti/chianti.html, http://www.damtp.cam.ac.uk/users/astro/chianti/chianti.html atomic database and its associated idl software (Dere et al. 2001, Young et al. 2003). We then generated the synthetic X-ray emission coefficient (integrated over the energy range of interest) as a function of temperature (at a reference density of 1 cm-3) and then scale it using the low density regime density dependence.
We assumed that the gas is in coronal ionization equilibrium. For the calculation of the X-ray emission we used the Mazzota et al. (1998) coronal ionization equilibrium and the Anders & Grevesse (1989) solar abundances.
From our numerical models, we obtained synthetic emission maps corresponding to the soft ([0.3–1.8] keV) and hard ([1.8–7] keV) energy bands of the Chandra satellite. For the simulated spectra, which cover the whole energy band ([0.3–7] keV), we considered the effects of interstellar absorption using the absorption curve of Morrison & McCammon (1983) and integrated the emission coefficient along either the axis ( projection) or the axis ( projection).
3 Results
3.1 Hydrodynamical results
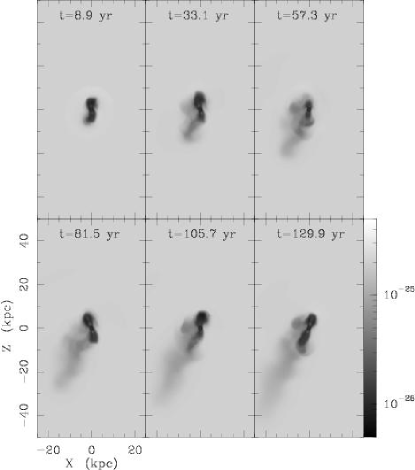
For analyzing the characteristics of the interacting jet-wind model, the temporal evolution of the density distribution is shown in Fig.1. These maps are cuts and correspond to the density distribution in the plane. The density scale is given in units of g cm-3. A time interval Myr separates the sequence of panels displayed in Fig.1, spanning a total temporal evolution of 130 Myr. A long wake can be observed in Fig.1, as a result of the interaction between the precessing jets and the plane-parallel ICM wind. This wake has low-density gas, which is swept up by the ICM wind. The density of the wake is of g cm-3, i.e. five times lower than its surrounding environment due to the mixing between the shocked jet gas (by the Mach disk) and the more dense ICM gas, which has been shocked by the jet bow shock. The jet axis is continously varying its inclination with respect to the velocity of the incident ICM wind. At smaller incident ICM wind-jet axis angles the collision becomes stronger than in the case with larger ICM wind-jet axis angles (i.e. the ICM wind is actually hitting the cocoon side). This produces small differences in the density of the shocked ICM gas, which is given by:
| (1) |
where is the specific heat ratio, is the shock Mach number, and are the shocked and unshocked ICM densities, respectively. For strong shocks we have and the density ratio (see Eq.1) is approximately equal to 4 (in the monoatomic gas case), while it is slightly smaller than this value, when the shocks have . Because of this and after the mixing with the low density shocked jet gas, the wake has a knotty structure and its width is variable, when this shocked ICM-jet gas is swept up and pushed behind by the incident flow.
On the other hand, from Fig.1 and Fig.2, the jet lobes look like as cavities of low density and high temperature gas.
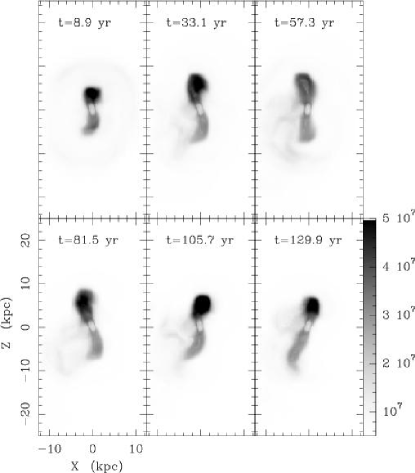
In order to make a direct comparison of the numerical results with the observations, one can generate synthetic emission maps at the desired wavelength or energy band (the X-ray emission maps will be discussed later in Section 3.2). In the case of radio emission maps, we could not calculate these because the magnetic field is not included in our description. Anyhow, it is possible to use other tracers for the jet structure. Radio emission from extragalactic jets is due to synchrotron emission (i.e., of non-thermal origin), which is enhanced in sites of strong shock waves. These sites have high temperatures. Based on this fact, maps of the temperature integrated along lines-of-sight are expected to be good tracers of the radio-jet structure. Figure 2 shows the time evolution of the average integrated temperature from time Myr to Myr. High-temperature sites reveal the jet morphology. In this figure we notice an asymmetry between the upper and lower lobe, which is due to the wind-jet interaction. The characteristic sizes of these lobes are 104 kpc (or 5020 pixels).
3.2 Synthetic X-ray emission maps
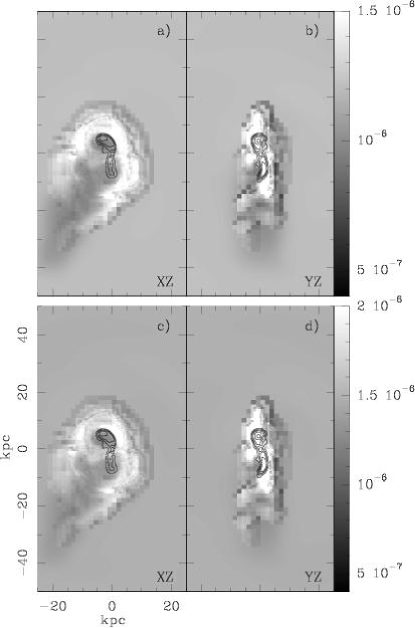
Following the procedure described in subsection 2.3, we derive X-ray emission maps by integrating the X-ray emission coefficient along the selected line-of-sight. In Fig.3 we display the simulated X-ray maps for model I for two different projections on the plane of the sky. The upper left panel shows the X-ray map obtained integrating the emission coefficient along the axis ( projection), while the upper right panel displays the map obtained when the integration is carried out along the axis ( projection). The top two panels correspond to the X-ray emission in the soft energy band (0.3–1.8 Kev), for an evolution time of 121 Myr. The same is time-frame is shown in the bottom two panels (i.e. for the two projections), but for the hard energy band (1.8–7 Kev) X-ray emission. In order to compare the X-ray emission with the morphology of the jets, all gray-scale X-ray maps are overlayed with contours of the corresponding temperature maps (averaged along the same lines-of-sight).
From the simulated X-ray maps, we see in both Figs. 3a and 3c (the projection) that the maps show a bright X-ray filament characterized by an overall bow-shock shape. The wake, observed in the density distribution maps, presents X-ray emission which is lower than the one of the intra-cluster medium emission. It is also low the X-ray emission from the lobe jets. In contrast, in Figs. 3b and 3d (the projection), the bright bow shock filament is now observed as a more linear structure superposed on the jets rather than to one side. This fact shows that the orientation of the flow with respect to the observer has a strong effect on the predicted X-ray emission maps. In other astrophysical scenarios, such as in stellar winds and supernova remnants, the importance of projection effects was pointed out by Hnatyk & Petruk (1999), Petruk (2001) and Velázquez et al. (2004) . In our case, we show that in the projection the cavities (at the lobe jet positions) and wake (observed in the projection) practically disappear because they are hidden by the bright emission from the bow shock structure, which is located along the same lines of sight.
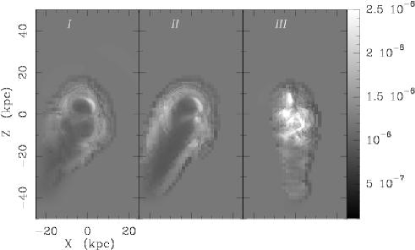
We have verified how sensitive model I is with respect to the adopted parameters. Fig.4 shows the X-ray emission for models I, II and III, in the soft energy band (0.3-1.8 keV). The X-ray emissions from models I and II are very similar even though the precession period is five times faster in model II. However, in model III the morphology of the X-ray emission changes drastically as a result of having the plane-parallel wind moving exclusively in the direction. The X-ray emission of model III can be described as being made of several centrally positioned filaments, surrounded by a lower X-ray emission gas. The morphology shown in model III looks similar to that observed in radio galaxy jets such as 3C 294 (Crawford et al. 2003).
For each map of models I, II and III, we have derived the corresponding energy distribution, or synthetic spectrum, in the 0.3–7.0 keV interval, which are plotted in Fig.5. These take into account the absorption by an interstellar absorption corresponding to a cm-2 hydrogen column density. The three spectra are identical and show spectral features that were reported by others, such as the presence of some Fe lines close to 1 keV (see Peterson 2003).

4 Analysis of results and comparison with observations
4.1 Radio jet in Abell 1795 galaxy cluster
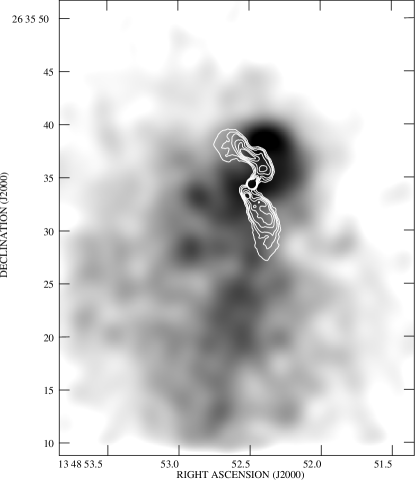
As a prototype of filamentary structure in X-ray emission, we have the Abell 1795 cluster case. Abell 1795 (hereafter A 1795) is a rich cluster of galaxies, which has been studied at optical, radio and X-ray wavelengths. Fig.6 shows an overlay of the X-ray emission (in greys) from this cluster (obtained with Chandra satellite, Fabian et al. 2001), and radio-continuum, at 8.3GHz, of the central region (white contours, Ge & Owen 1993).
Radio observations of the central region of A 1795 show a jet-like emission from the bipolar radio source 4C 26.42 with a “S” shape (see white contours in Fig.6). The projected combined size 222we used H0=70 km s-1 Mpc-1 finding that =1.31 kpc. is of kpc (van Breugel et al. 1984 and Ge & Owen 1993). In X-rays, high resolution images from Chandra, show the presence of a long ( kpc) knotty filament in North-South direction (see Fig.6). This filament is formed by hot gas, with temperatures of the order of 2.7 keV (by a three ray colour analysis, Fabian et al. 2001). This large scale filament positionally coincides rather well with an elongated optical H + [NII] emission line feature previously observed by Cowie et al. (1983). Ettori et al. (2002) carried out a similar study by focusing on the characteristics of the ICM of A 1795. From spectral analyses, they found that the temperature of the ICM is in the [3.5-4.5] keV range, being higher than the X-ray filament temperature reported by Fabian et al.(2001).
4.2 Comparison between observations and main numerical results
The main results obtained from our numerical simulations are:
-
•
by means of integrated temperature maps (Fig.2), our model describe quite well the shape of the radio-jets emanating from the central galaxy of A 1795, giving physical dimensions for the lobes of kpc, which is in quantitative agreement with the radio image obtained by van Breugel et al. (1984).
-
•
the wake left behind by the interaction of the jets with the plane-parallel wind, as observed in the density maps (Fig.1), resembles the morphology of the observed X-ray filament of A 1795 (Fig.6). However, this “wake” cannot be the origin for the bright filament in A1795 due to the fact that its X-ray emission is lower than the ICM emission.
-
•
bright X-ray emission filaments have been obtained from our three models (specially in the soft X-ray band). Simulated X-ray emission maps show a “bow shock” feature (in the projection), which is a consequence of the jet-plane parallel wind interaction (see the left panels of Fig. 3 and panels I and II of Fig.4). This “bow shock” feature is seen as a long, straight filament in the projection maps (Fig.3). By direct comparison with the observational results of Fabian et al. (2001) and Ettori et al. (2002), models I and II better describe the X-ray emission of A 1795 because the simulated X-ray emission maps exhibit a single bright filament (compare projection of Fig.3 with Fig.6). The simulated maps from model III can be employed for explaining the X-ray morphology in 3C 294 (Crawford et al. 2003).
-
•
the simulated, bright X-ray filaments correspond to emission from gas with temperatures of a factor higher than the ICM temperature. This result differs from the observational result obtained from Fabian et al. (2001) and Ettori et al. (2002). A discussion about this discrepancy will be given in the following section.
-
•
synthetic spectra from three models are very similar to each other, and also are in good qualitative agreement with the observations.
5 Discussion
We have computed models of a precessing, bipolar jet ejected by a radio galaxy in motion with respect to the surrounding intra-cluster environment. Our models have been computed for parameters relevant for the jets and X-ray filament associated with the 4C 26.42 galaxy in the A 1795 cluster. Previous works (Reynolds et al. 2001 and Zanni et al. 2003) which have studied jet-ICM interaction, predict a shell-like morphology (for supersonic cocoon expansion regime) or partial shell-like shape (for subsonic cocoon expansion regime) in X-ray emission. Furthermore the predicted X-ray emission is symmetric. The main difference between these models and our work is that the jet source is moving into the ICM, generating an enhancement in the part of cocoon located in the direction of the incoming ICM wind.
From an analysis of our numerical results, we conclude that a precessing jet interacting with a plane-parallel ambient wind qualitatively explains many of the morphological features observed in A 1795. A jet ejected from a source moving within the intra-cluster environment with the velocity of 4C 26.42 leaves behind a wake with a morphology similar to the one of the X-ray filament associated with this object (Fabian et al. 2001). The jet precession, at the same time, produces lobes with a radio morphology similar to the one of the radio jets ejected by 4C 26.42 (van Breugel et al. 1984, Ge & Owen 1993). Besides, the jet precession has a secondary effect producing a knotty wake structure. To this extent, our numerical models are successful at reproducing the characteristics of the jet+X ray filament system associated with this galaxy.
However, Ettori et al. (2002) and Fabian et al. (2001) found that the X-ray spectrum of the A 1795 filament and its surrounding intra-cluster medium implies two different temperature. Fabian et al. (2001) found the temperature of the filament might be lower than 2.7 keV, while Ettori et al. 2002 give a temperature between 3.5 and 4.5 keV. Rodríguez-Martínez et al. 2005 are performing a new analysis using all archived Chandra data of A 1795.
Our non-radiative models clearly do not reproduce this effect, as the temperatures obtained for the gas within the wake are always higher than the temperature of the surrounding, unperturbed intra-cluster medium. This failure at obtaining the right temperature is a clear feature of our present models. However, it might be possible to reconcile our model with the X-ray observations of A 1795 by including thermal conduction and/or turbulent mixing of the hot, post-bow shock gas with material in a cold phase (of K) belonging in the past to the interstellar medium of the central galaxy. In order to include such effects, much higher resolution simulations would be necessary, and radiative cooling and thermal/turbulent mixing terms would have to be included.
Notwithstanding this discrepancy, it is interesting that such a simple model reproduces the morphology of bright X-ray filaments similar to the one observed in A 1795 and other clusters. Structures with sizes similar to the observed X-ray filament can be generated in our model. Furthermore, observed spectral features such as the emission by very high ionization Fe lines are present in our synthetic spectra. Of the three models presented in this work, we consider as acceptable both models I and II, with model III used only to explore the impact of varying the incidence angle of the wind.
Acknowledgements.
The authors acknowledge support from CONACyT grants 36572-E, 40096-F, 41320-E, 43103-F and DGAPA-UNAM grants IN112602, IN113605 and IN118601. We thank the anonymous referee for valuable comments that helped improve our work. We are grateful with Andy C. Fabian and Gregory B. Taylor for the kind help on provided us their radio and X-rays images of A1795. Finally, we thank Israel Díaz for maintaining our Linux servers, where all the numerical simulations have been carried out.References
- Anders & Grevesse (1989) Anders, E. & Grevesse, N. 1989, Geochimica et Cosmochimica Acta, 53, 197.
- Condon & Mitchell (1984) Condon, J.J. & Mitchell, K.J. 1984, ApJ, 176, 472.
- Cox et al. (1991) Cox, C.I., Gull, S.F. & Scheuer, P.A.G. 1991, MNRAS, 252, 558.
- Cowie et al. (1983) Cowie L. L., Hu E. M., Jenkins E. B., York D. G., 1983, ApJ, 272, 29.
- Crawford et al. (2003) Crawford. C. S., Fabian, A. C., Sanders, J. S., Ettori, S., 2003, NewAR, 47, 239-242.
- Dere et al. (2001) Dere, K. P., Landi, E., Young, P.R., Del Zanna, G. 2001, ApJS, 134, 331.
- Ettori et al. (2002) Ettori, S., Fabian, A.C., Allen, A.W. Johnstone, R.M. 2002, MNRAS, 331, 635.
- Fabian et al. (2001) Fabian A. C., Sanders J. S., Ettori S., Taylor G. B., Allen S. W., Crawford C. S., Iwasawa K., Johnstone R. M., 2001, MNRAS, 321, L-33.
- Ferrari (1998) Ferrari, A. 1998, Annu. Rev. Astron. Astrophys., 36, 539.
- Ge & Owen (1993) Ge, J. P. & Owen, F. N. 1993, AJ, 105, 778.
- Hill et al. (1988) Hill J. M., Hintzen P., Oegerle W. R., Romanishin W., Lesser M. P., Eisenhamer J. D., Batuski D. J., 1988, ApJ, 332, L23.
- Hnatyk & Petruk (1999) Hnatyk, B., & Petruk, O. 1999, A& A, 344, 295.
- Kellerman & Owen (1988) Kellerman, K & Owen, F 1988, in “Galactic and extragalactic radio astronomy (2nd edition)”, Berlin and New York, Springer-Verlag, p. 563-602.
- Masciadri et al. (2002) Masciadri, E., de Gouveia Dal Pino, E. M., Raga, A. C., Noriega-Crespo, A., 2002, ApJ, 580, 950-958.
- Morrison & McCammon (1983) Morrison, R. & McCammon, D. 1983, ApJ, 270, 119.
- Mazzotta et al. (1998) Mazzotta, P., Mazzitelli, G., Colafranscesco, S. & Vittorio, N. 1998, A& As, 133, 403.
- Oegerle & Hill (1994) Oegerle W. R., Hill J. M., 1994, AJ, 107, 857.
- Peterson et al. (2003) Peterson, J.R., Kahn, S.M., Paerels, F.B.S., Kaastra, J. S., Tamura, T., Bleeker, J. A. M., Ferrigno, C., Jernigan, J. G. 2003, ApJ, 590, 207.
- Petruk (2001) Petruk, O. 2001, A& A, 371, 267
- Pietrini & Torricelli (1992) Pietrini, P. & Torricelli-Ciamponi, G. 1992, ApJ, 401, 60.
- Raga, Navarro-González & Villagrán-Muniz (2000) Raga, A. C., Navarro-González, R., Villagrán-Muniz, M., 2000, RevMexAA, 36, 67.
- Raga et al. (2001) Raga, A. C., Velázquez, P. F., Cantó, J., Masciadri, E., Rodríguez, L. F. 2001, ApJ, 559L, 33.
- Reynolds et al. (2001) Reynolds, C.S., Heinz, S. & Begelman, M. C. 2001, ApJ, 549, 179.
- Rizza et al. (2000) Rizza, E., Loken, C., Bliton, M., Roettiger, K., Burns, J. O. & Owen F. N. 2000, ApJ, 119, 21.
- Rodríguez-Martínez et al. (2005) Rodríguez-Martínez,. M., Binette, L., Velázquez, P.F., Krongold, Y., Nicastro, F., Raga, A., Haro-Corzo, S. 2005, (in preparation).
- Torricelli-Campioni & Pietrini (1993) Torricelli-Ciamponi, G. & Pietrini, P. 1993, ApJ, 406, 36.
- van Breugel et al. (1984) van Breugel W., Heckman T., Miley G.,1984, ApJ, 276, 79.
- van Leer (1982) van Leer, B. 1982, ICASE Rep, 82-30.
- Velázquez, Riera & Raga (2004) Velázquez, P. F., Riera, A., Raga, A. C., 2004, A&A, 419, 991.
- Velázquez et al. (2004) Velázquez, P. F., Martinell, J., Raga, A.C. & Giacani, E.B. 2004, ApJ, 601, 885.
- Young et al. (2003) Young, P. R., Del Zanna, G., Landi, E., Dere, K. P., Mason, H. E., Landini, M. 2003, ApJS, 144, 135.
- Zaninetti & Van Horn (1988) Zaninetti, L. & van Horne, H. M. 1988, A&A 189, 45.
- Zanni et al. (2003) Zanni, C., Bodo, G., Rossi, P., Massaglia, S., Durbala, A. & Ferrari, A. 2003, A& A, 402, 949.