An Initial Look at the Far Infrared-Radio Correlation within Nearby Star-forming Galaxies using the Spitzer Space Telescope
Abstract
We present an initial look at the far infrared-radio correlation within the star-forming disks of four nearby, nearly face-on galaxies (NGC 2403, NGC 3031, NGC 5194, and NGC 6946). Using Spitzer MIPS imaging, observed as part of the Spitzer Infrared Nearby Galaxies Survey (SINGS), and Westerbork Synthesis Radio Telescope (WSRT) radio continuum data, taken for the WSRT SINGS radio continuum survey, we are able to probe variations in the logarithmic 24 /22 cm () and 70 /22 cm () surface brightness ratios across each disk at sub-kpc scales. We find general trends of decreasing and with declining surface brightness and with increasing radius. We also find that the dispersion in is generally a bit larger than what is found for within galaxies, and both are comparable to what is measured globally among galaxies at around 0.2 dex. The residual dispersion around the trend of and versus surface brightness is smaller than the residual dispersion around the trend of and versus radius, on average by 0.1 dex, indicating that the distribution of star formation sites is more important in determining the infrared/radio disk appearance than the exponential profiles of disks. We have also performed preliminary phenomenological modeling of cosmic ray electron (CR) diffusion using an image-smearing technique, and find that smoothing the infrared maps improves their correlation with the radio maps. We find that exponential smoothing kernels work marginally better than Gaussian kernels, independent of projection for these nearly face-on galaxies. This result suggests that additional processes besides simple random-walk diffusion in three dimensions must affect the evolution of CRs. The best fit smoothing kernels for the two less active star-forming galaxies (NGC 2403 and NGC 3031) have much larger scale-lengths than those of the more active star-forming galaxies (NGC 5194 and NGC 6946). This difference may be due to the relative deficit of recent CR injection into the interstellar medium (ISM) for the galaxies having largely quiescent disks.
1 Introduction
A major result of the Infrared Astronomical Satellite (IRAS; Neugebauer, et al (1984)) all-sky survey was the discovery of a correlation between the globally measured far infrared (42-122 , FIR) dust emission and the optically thin radio continuum emission of normal late-type star-forming galaxies without an active galactic nucleus (AGN) (de Jong et al. , 1985; Helou, Soifer, & Rowan-Robinson , 1985). The most remarkable feature of this correlation is that it displays such little scatter, 0.2 dex, among galaxies spanning 5 orders of magnitude in luminosity. While the FIR emission is due to the thermal re-radiation of interstellar starlight by dust grains, the radio emission is primarily non-thermal synchrotron emission from cosmic ray electrons (CRs) that propagate in a galaxy’s magnetic field after initially being accelerated by supernova shocks or other processes. The physics which maintains a strong correlation between these two quantities over such a wide range of galaxies remains unclear.
The connection between radio and infrared emission from galaxies is that they are both powered by massive stars, as pointed out originally for starbursts by Harwit & Pacini (1975). Young massive stars, which heat up dust to provide the bulk of the FIR emission, are thought to be the same stars which end as supernovae (SNe) and bring about the synchrotron emission. Such a simplified picture, however, cannot fully explain the small dispersion measured among galaxies spanning ranges in magnetic field strength, metallicity, interstellar medium (ISM) mass, dust grain chemistry and distributions, and star formation rates (SFRs), which all contribute to the observed FIR/radio ratio of galaxies. In fact, some of these parameters individually have a larger dispersion among galaxies than what is measured for the FIR-radio correlation.
Various physical models for the global FIR-radio correlation have been introduced (e.g. Völk (1989); Helou & Bicay (1993); Niklas & Beck (1997); Hoernes, Berkhuijsen, & Xu (1998); Bressan, Silva, & Granato (2002)), though progress on the theoretical front has been limited. Observations of the FIR-radio correlation within galaxies, using both IRAS and ISO (Beck & Golla , 1988; Xu et al. , 1992; Marsh & Helou , 1995, 1998; Hoernes, Berkhuijsen, & Xu , 1998) and early Spitzer data (Gordon et al. , 2004; Hinz et al. , 2004), has provided tantalizing hints of the variations in the correlation, motivating this detailed Spitzer follow-up. Prior to Spitzer, the physical scale below which the FIR-radio correlation breaks down, a few hundred parsecs, has only been possible to study by looking at star-forming regions within our own Milky Way galaxy (Boulanger & Pérault , 1988), and the nearest galaxies (e.g. M31, Hoernes, Berkhuijsen, & Xu (1998)). Due to the limited spatial resolution and/or sensitivity of previous instruments compared to Spitzer, the measurement of detailed variations within other galaxies had not been possible.
If the general picture of the FIR-radio correlation is correct, and massive stars are largely responsible for both the infrared and radio emission from galaxies, the fact that the mean free path of UV photons (100 pc) which heat the dust is much less than the diffusion length for a CR (1-2 kpc) suggests that the radio image should resemble a smeared version of the infrared image. This idea was first introduced by Bicay & Helou (1990), who attempted to model the propagation of CRs by smearing IRAS scan data of galaxies using parameterized kernels containing the physics of the CR propagation and diffusion, to better match the morphology of the corresponding radio data. Later work by Marsh & Helou (1998) further tested this model using IRAS HiRes images and found that this prescription worked on large scales across galaxy disks.
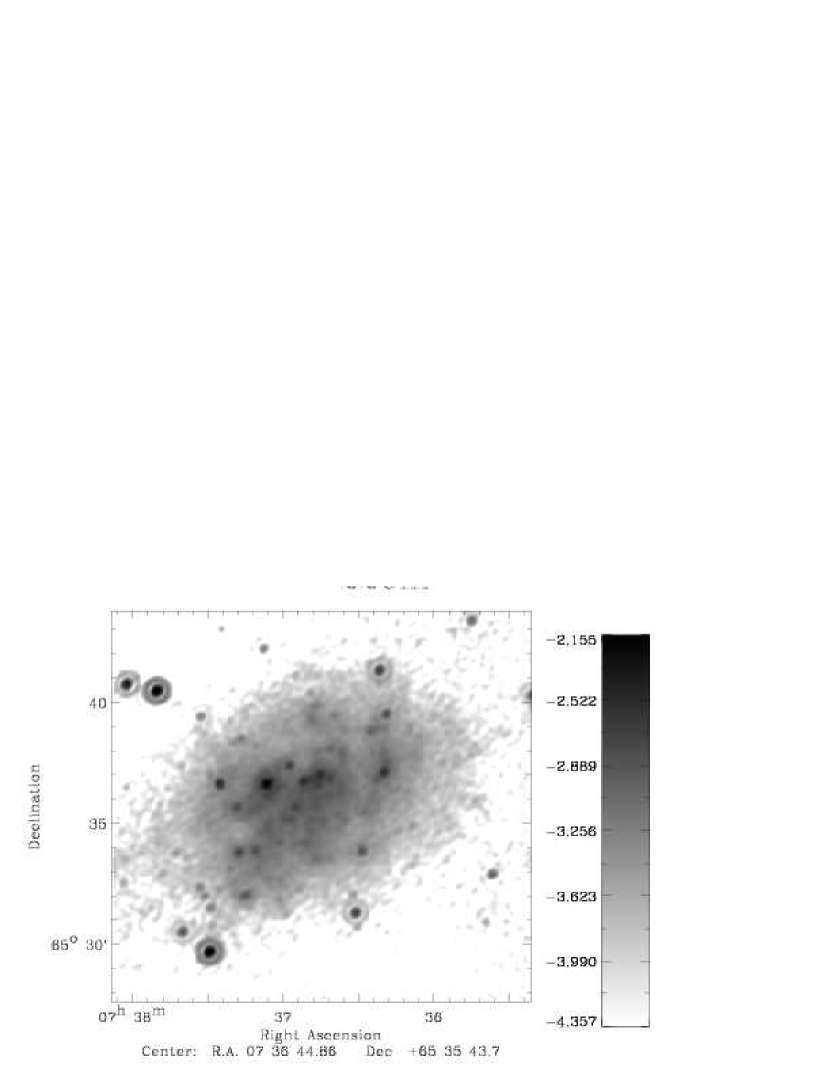
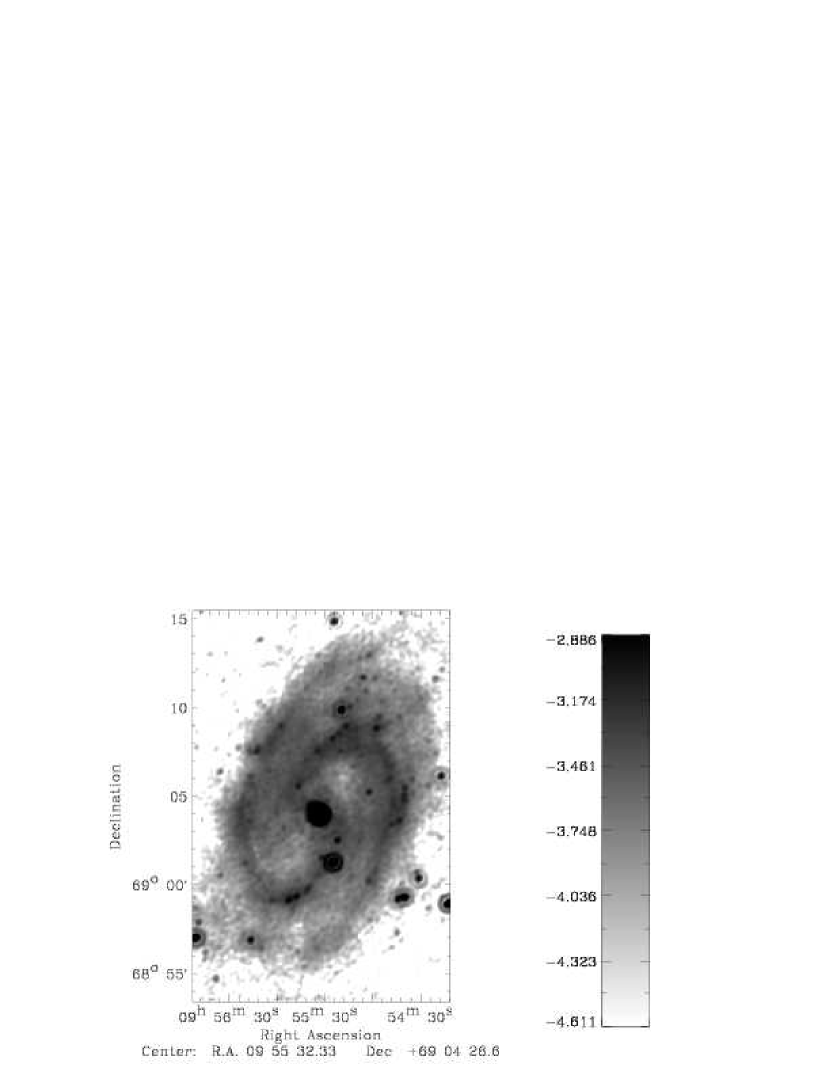
In an attempt to better understand the FIR-radio correlation, we are using infrared data from Spitzer observations obtained as part of the Spitzer Infrared Nearby Galaxies Survey (SINGS) legacy science project (Kennicutt et al. , 2003). These data allow us to probe galaxies with dramatically increased angular resolution and sensitivity compared to past infrared missions, especially at 24 and 70 . Using high resolution Spitzer imaging, we are also able to test the smearing model of Bicay & Helou (1990) with greater accuracy, at higher spatial resolution, and in more galaxies, with the aim of gaining better insight into CR diffusion and confinement within galaxy disks. In this paper we examine the FIR-radio correlation within four of the nearest face-on galaxies in the SINGS sample for which we have acquired both Spitzer MIPS and WSRT radio continuum data: NGC 2403, NGC 3031 (M81), NGC 5194 (M51a), and NGC 6946. These galaxies are quite diverse in their Hubble type and star formation activity, but their distances allow us to probe the correlation on the scale of a few hundred parsecs within each of their respective star-forming disks (see Table 1).
The paper is organized as follows: In we describe the observations and data analysis procedures. Then, in , we present the empirical results of our work. In we compare our results within disks to previous results on the global FIR-radio correlation, and explore the role of cosmic ray propagation in the local FIR-radio correlation. Finally, in , we provide a brief summary of the paper.
2 Observations and Data Reduction
2.1 Spitzer Images
Spitzer imaging was carried out for each galaxy using the Multiband Imaging Photometer for Spitzer (MIPS; Rieke, et al. (2004)) as part of the SINGS legacy science program. Accordingly, a detailed description of the basic observation strategy can be found in Kennicutt et al. (2003), although a few modifications have been made after receiving SINGS validation data on NGC 7331 (e.g. Regan et al. (2004)). Note that each target is mapped (or visited) twice so that asteroids and other transient phenomena can be removed from the data if necessary. The MIPS data were processed using the MIPS Data Analysis Tools (DAT) versions 2.80-2.92 (Gordon et al. , 2005). Due to residual artifacts such as latent images and background curvature in the 24 data, as well as short term drifts in the 70 and 160 signals, additional processing beyond that of the standard MIPS DAT was necessary. These exceptions in the standard data processing are listed below.
For the 24 m data, a few additional steps were performed on the data. First, the flatfielding was performed in two steps. Scan-mirror-position dependent flats, created from off-target data in the scan maps from all SINGS MIPS campaign data, were first applied to the data. Following this, scan-mirror-position independent flats, made from off-target frames in each visit’s scan map, were applied. Latent images from bright sources, erroneously high or low pixel values, and unusually noisy frames were also masked out before the data were mosaicked together. For the NGC 5194 and NGC 6946 data, mosaics of the data from each visit were made, then linear backgrounds determined from sky regions outside of the optical disks were subtracted. The two mosaics were then averaged together to produce the final maps. For the NGC 2403 and NGC 3031 data, backgrounds were measured as a function of time in each scan leg and subtracted before mosaicking. After this background subtraction, the data from both visits were mosaicked to form a single image. The final pixel scale and full-width at half-max (FWHM) of the point spread function (PSF) are 075 and 57, respectively. The calibration factor applied to the final mosaic has an uncertainty of 10% and the RMS noise for the raw map is listed in Table 2 for each galaxy.
For the 70 and 160 data, the major addition to the processing beyond the standard MIPS DAT steps was the subtraction of short term variations from a residual detector background drift. This step also removes the sky background emission. The region that includes the galaxy is excluded from the drift determination, so no extended emission is subtracted. The data from both visits were then used to make one mosaic, and a residual offset measured in regions around the target was subtracted from the maps. Some bright sources in the 70 data created negative latent images that appeared as dark streaks in the data. As an artifact of the background subtraction, bright and dark streaks appeared on opposite sides of these bright sources. These streaks, while visible in the images, are at a relatively low signal level and should not significantly affect the analysis. The final pixel scales are 30 and 60, and the FWHM of the PSFs are 17 and 38 at 70 and 160 , respectively. The calibration factors applied to the final mosaics have uncertainties of 20% for each band and the RMS noise for the raw 70 and 160 maps is listed in Table 2 for each galaxy.
While the calibration uncertainties will have a systematic effect on the measured flux ratios, they will not cause artificial trends as a function of signal strength. In contrast, the RMS noise will contribute to uncertainties in flux ratios as a function of surface brightness, possibly causing low-level artificial trends in the data. Accordingly, we only use pixels having a signal at least 3 times above the RMS noise in our analysis to minimize these types of effects.
2.2 Radio Continuum Images
Radio continuum images at 22 and 18 cm were obtained using the Westerbork Synthesis Radio Telescope (WSRT). Each target was observed for a twelve hour integration in the "maxi-short" array configuration, which has particularly good sampling of short baselines (East-West baselines of 36, 54, 72 and 90 meters are all measured simultaneously) as well as a longest baseline of about 2700 m. The target observations were bracketed by observations of the primary total intensity and polarization calibration sources 3C147 and 3C286, yielding an absolute flux density calibration accuracy of better than 5%. The observing frequency was switched every five minutes between two settings (1366 and 1697 MHz). Each frequency setting was covered with eight sub-bands of 20 MHz nominal width, but spaced by 16 MHz to provide contiguous, non-attenuated coverage with a total bandwidth of 132 MHz. An effective integration time of 6 hours was realized at each frequency setting. All four polarization products and 64 spectral channels were obtained in each sub-band. After careful editing of incidental radio frequency interference, external total intensity and polarization calibration of the data was performed in the AIPS package. Subsequently, each field was self-calibrated using an imaging pipeline based on the Miriad package. Each of the eight sub-bands for a given frequency setting was first processed and imaged independently; and these were subsequently combined with an inverse variance weighting. Deconvolution of each sub-band image was performed iteratively within a threshold mask based on a spatial smoothing of the previous iteration. The individual frequency channels (of 312.5 kHz width) were gridded during imaging, so that band-width smearing effects were negligible. In this way, a moderately good reconstruction of the brightness distribution was obtained for each target. The total detected flux density (scaled to a common reference frequency of 1365 MHz) was 460, 610, 1410 and 1690 mJy for NGC 2403, 3031, 5194 and 6946 respectively. Although all of these values either agree with, or slightly exceed, current estimates in the literature (387, 624, 1310 and 1432 mJy, White & Becker (1992)) they must still be regarded as lower limits, since the brightness distribution declines so smoothly into the noise floor. A more complete description of the processing steps will appear in Braun et al. (2005, in preparation).
Each final sub-band image was reprocessed to obtain a new output point spread function, by first dividing the image FFT with the FFT of the Gaussian CLEAN restoring beam and then convolving the result with a model of the MIPS 70 beam to permit an accurate joint analysis with the MIPS data. The intrinsic FWHM of the radio beams is about 11″East-West by 11/sin()″North-South at 1400 MHz and scales as 1/frequency. This was in all cases smaller than the MIPS 70 beam. Accordingly, the MIPS 70 beam sets the spatial resolution for the present study.
As the frequency difference between the 22 and 18 cm emission is rather small, with both wavelengths dominated by synchrotron emission, we consider only the 22 cm data for the infrared-radio analysis presented in this paper since the signal-to-noise ratio at 22 cm was generally higher than at 18 cm. The only exception is NGC 3031, for which a 20 cm map was created via a variance weighted average of both the 22 and 18 cm data. This was done in order to obtain good image quality for this very challenging field, which has complications due to the low extended surface brightness disk of NGC 3031, as well as calibration and confusion problems due to the nearby starburst galaxy NGC 3034 (M82). To allow for proper comparison with the 22 cm data, we scaled the 20 cm flux density to what is expected at 22 cm assuming a mean spectral index of -0.7. The RMS noise is given in Table 2 for each galaxy.
The expected number density of background radio sources, detectable at the 5 level in our radio maps, is 0.17 arcminute-2 (Hopkins et al. , 2002). This number translates into 15 over the average area of a galaxy disk studied in this paper. These background radio sources fall into two categories; galaxies which are primarily star-forming, and those which are dominated by an AGN. At flux densities 3 mJy, AGN dominate the radio source counts at 20 cm and are expected to be found at a frequency of 1 per the average area of the sample galaxies (Becker, White, & Helfand , 1995). Such sources can often be distinguished by their characteristic (double or triple) morphologies and much higher surface brightnesses compared to a galaxy’s diffuse radio disk. At lower flux densities, star-forming galaxies will dominate the counts. As such, they may introduce some additional scatter into our flux ratios, but are unlikely to lead to a systematic bias since they will affect 4% of the total area analyzed within each galaxy. Accordingly, we do not expect significant contamination of our analysis by background sources, but in general, very deep, high resolution radio or FIR imaging would be required to determine if any particular deviation from a constant FIR/radio ratio were due to a confusing background source.
2.3 Image Registration and Resolution Matching
In the following analysis, we focus on the 24 and 70 Spitzer MIPS data since they have angular resolutions better than, or similar to, our WSRT radio data. The calibrated MIPS and radio continuum images for each galaxy underwent a pre-analysis procedure to ensure that the different PSFs and sampling at each wavelength did not introduce artifacts into our results. Each image was first sky-subtracted using a variance weighted mean calculated from regions surrounding the galaxy. The images at different wavelengths were then cropped to a common field-of-view, and regridded to a pixel scale of 3.
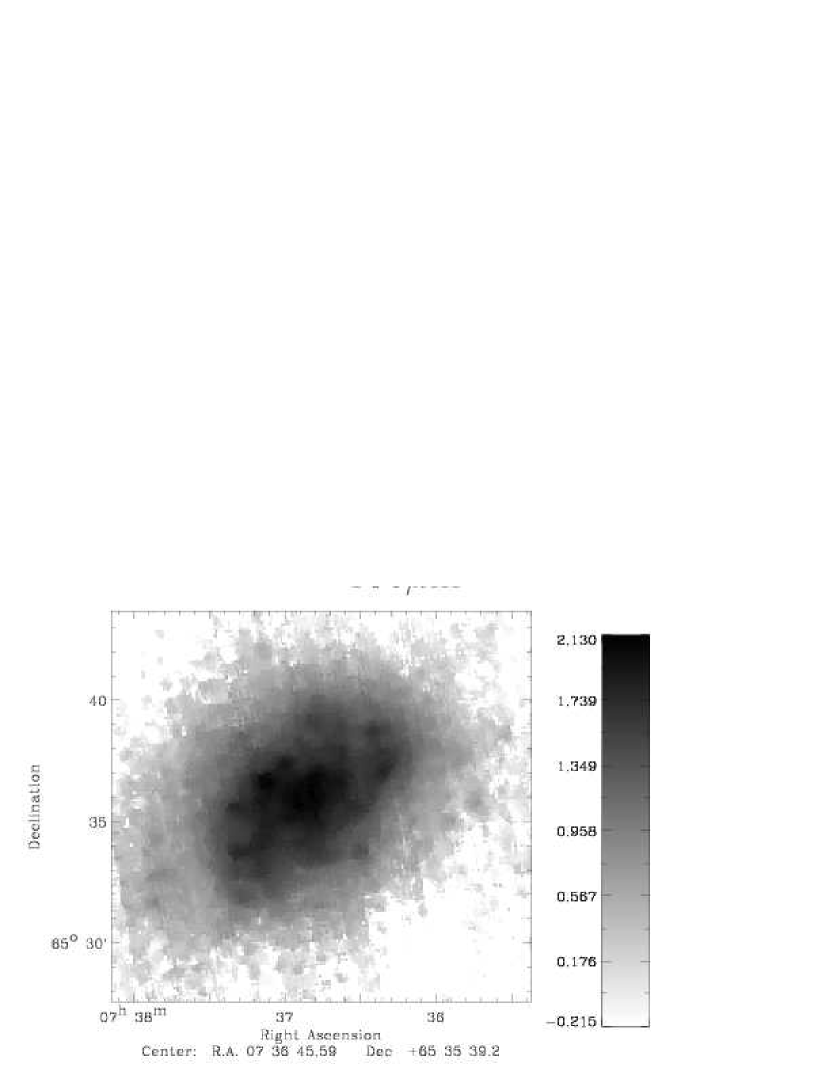
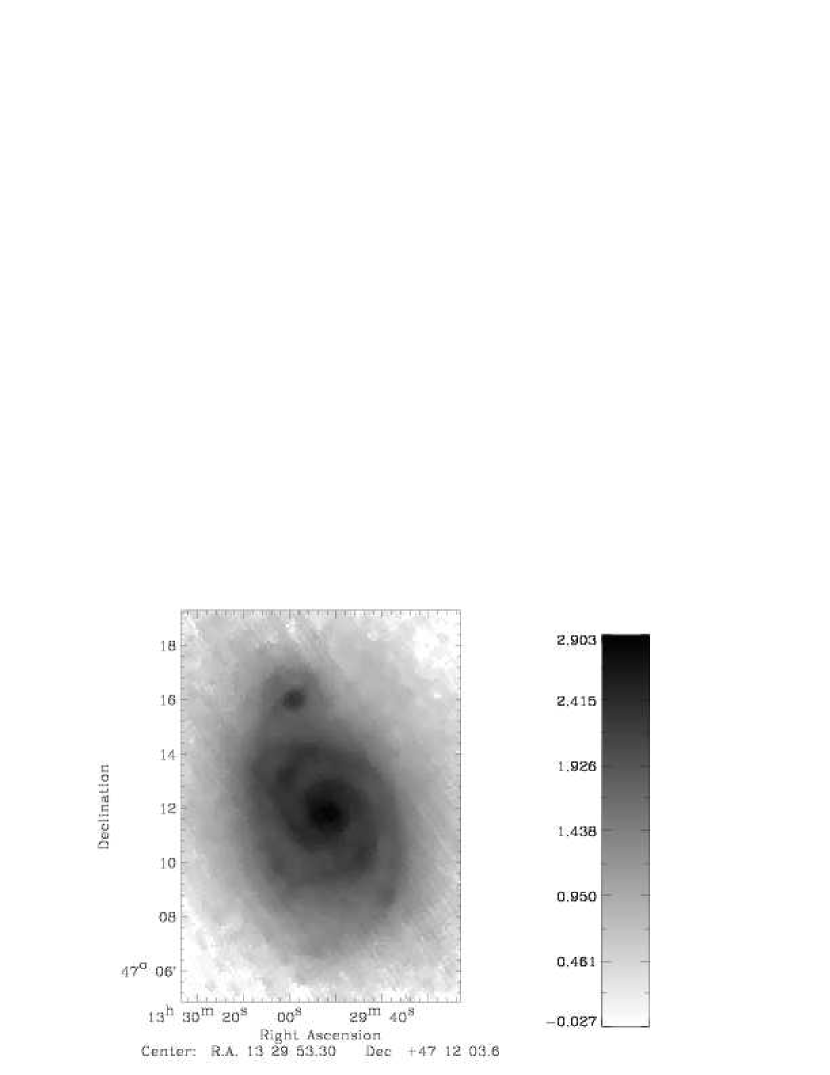
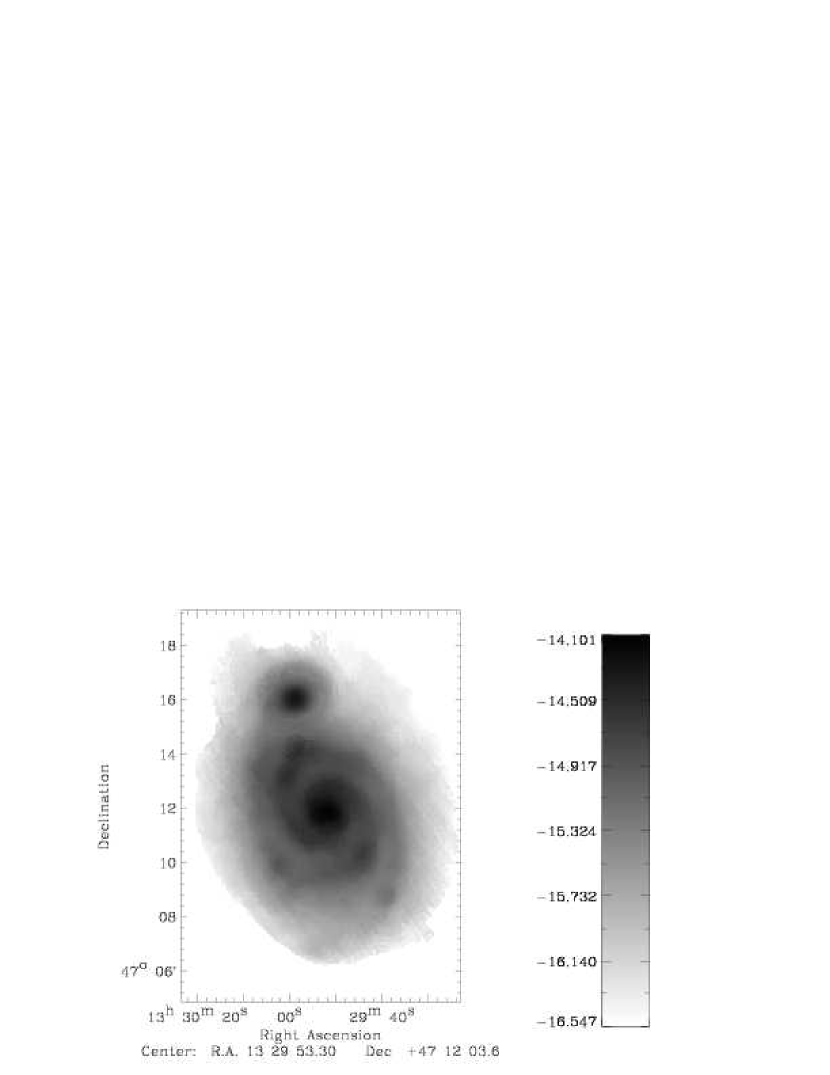
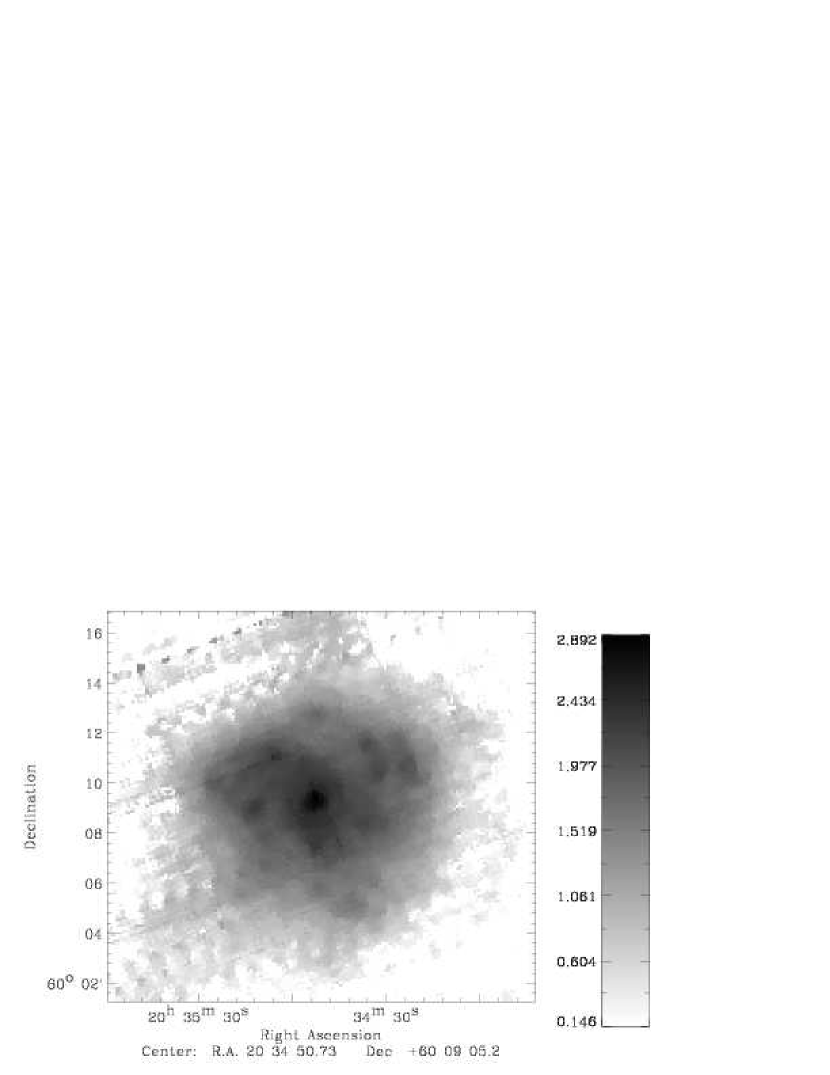
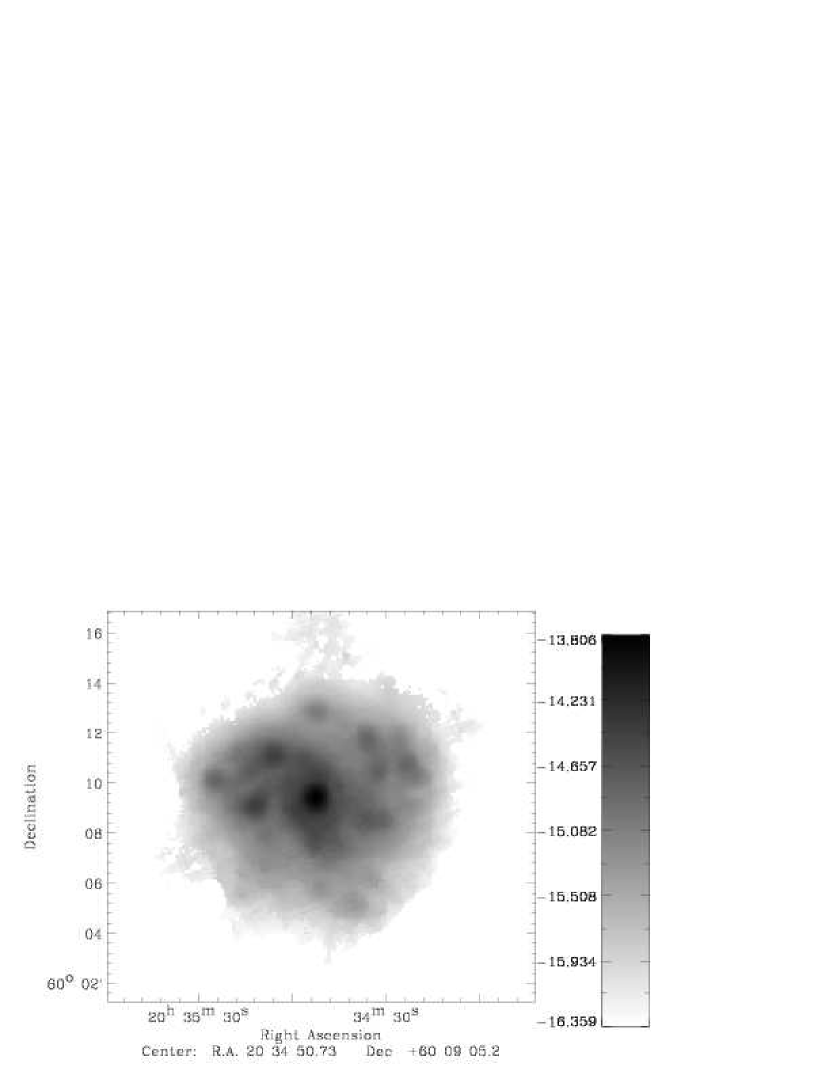
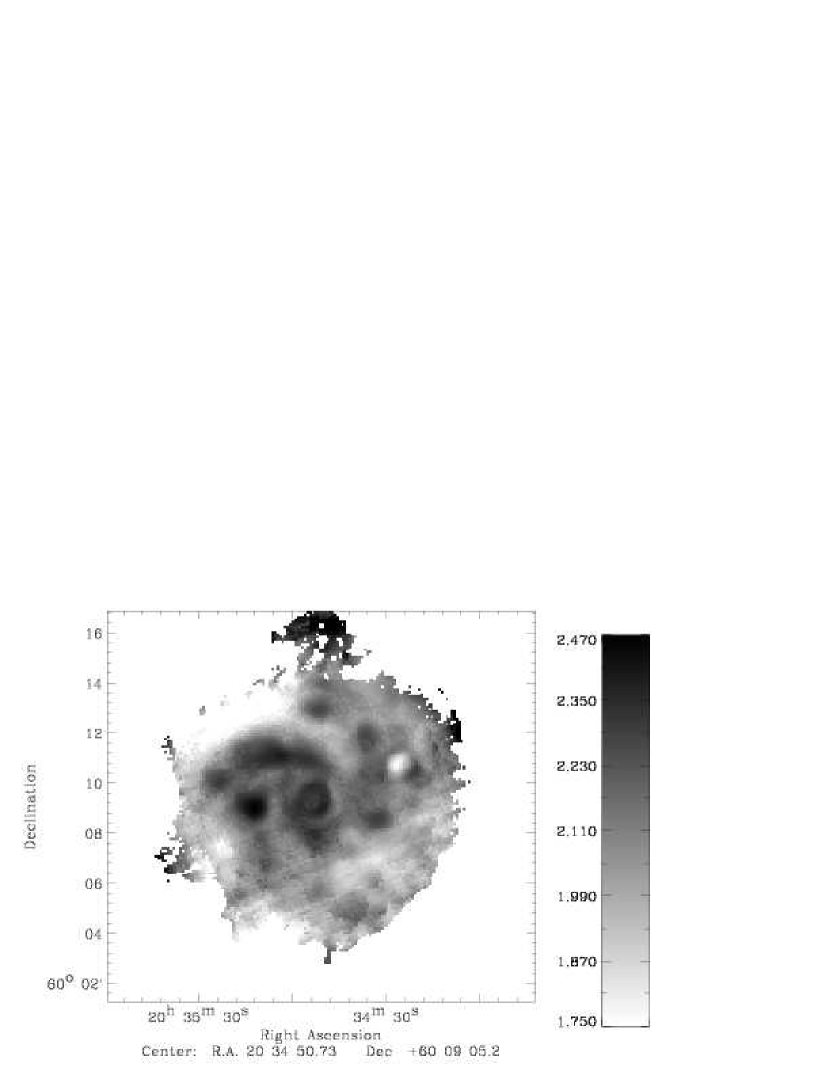
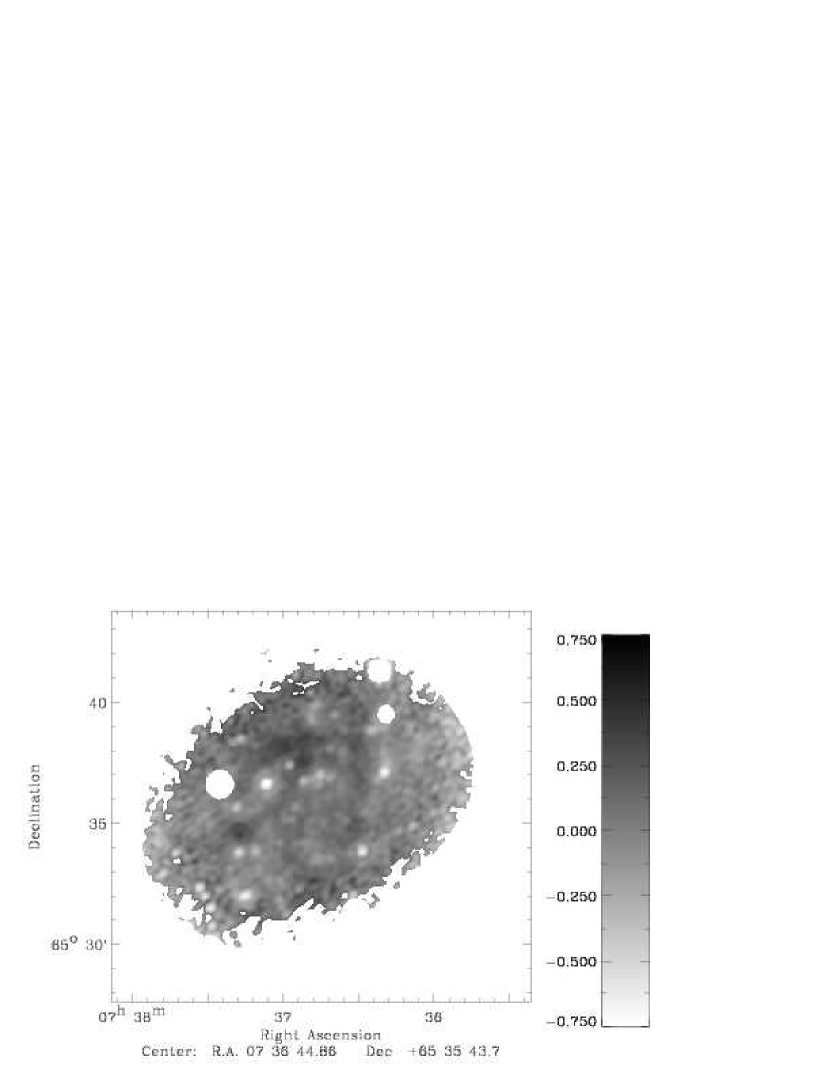
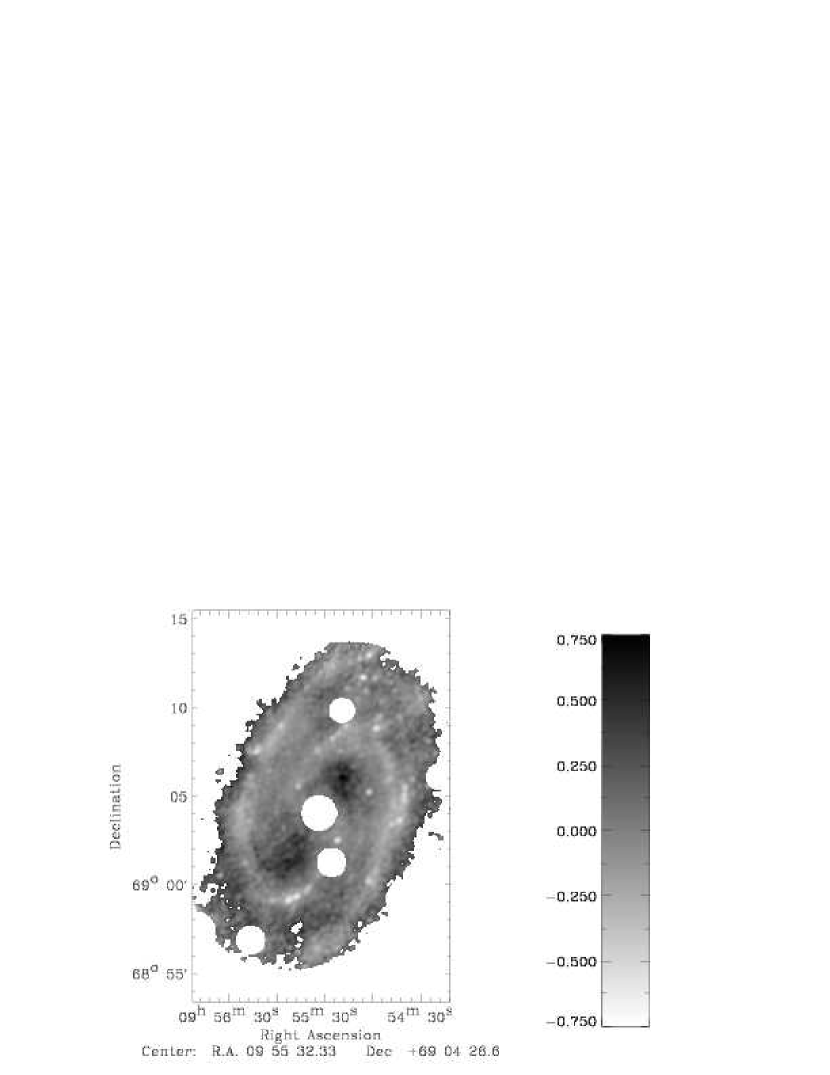
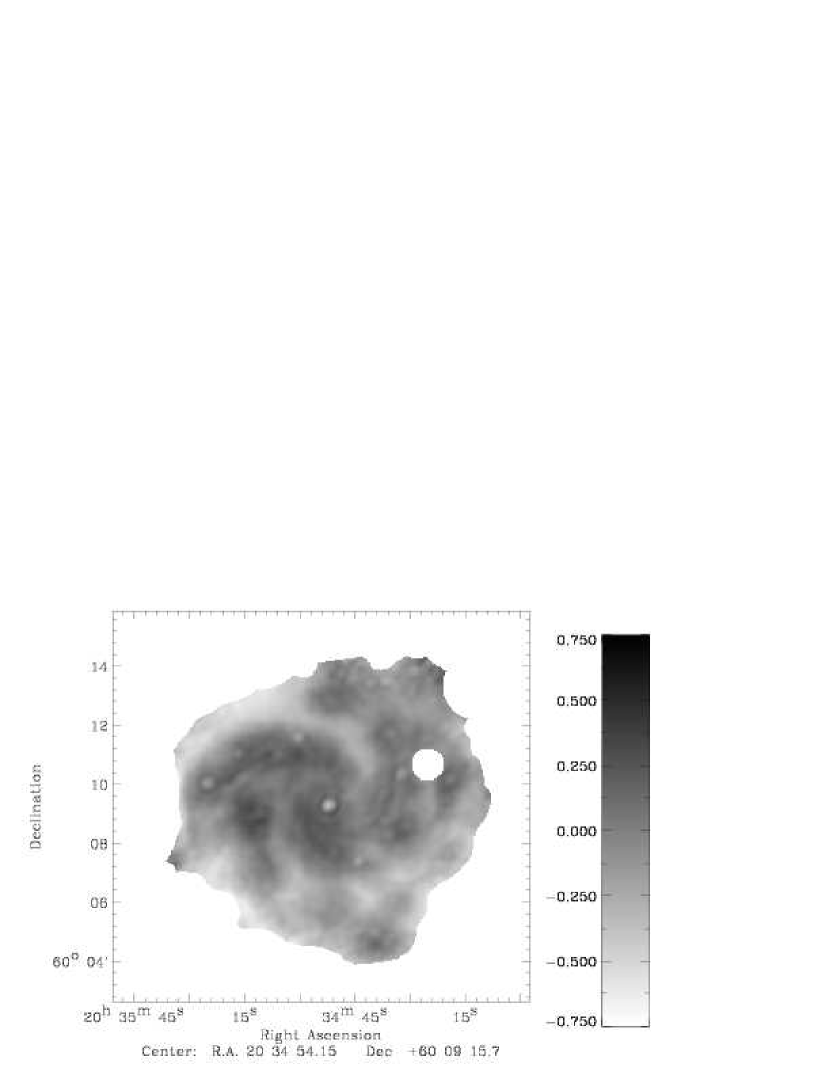
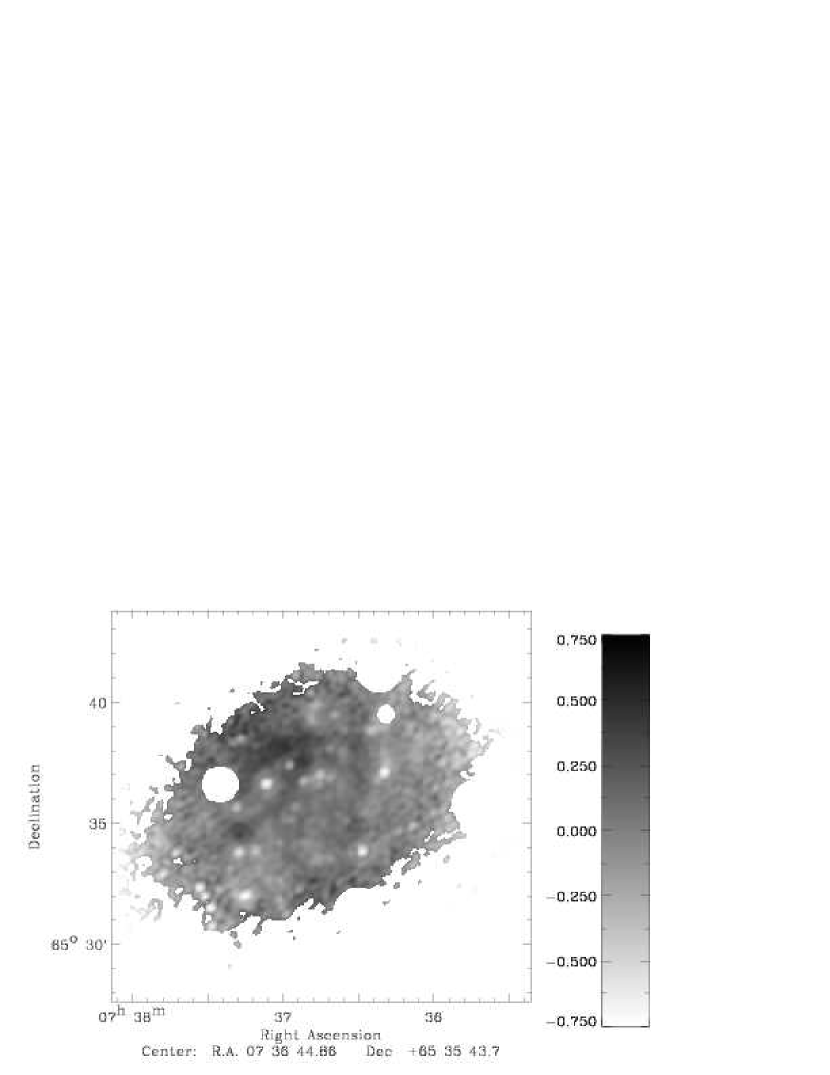
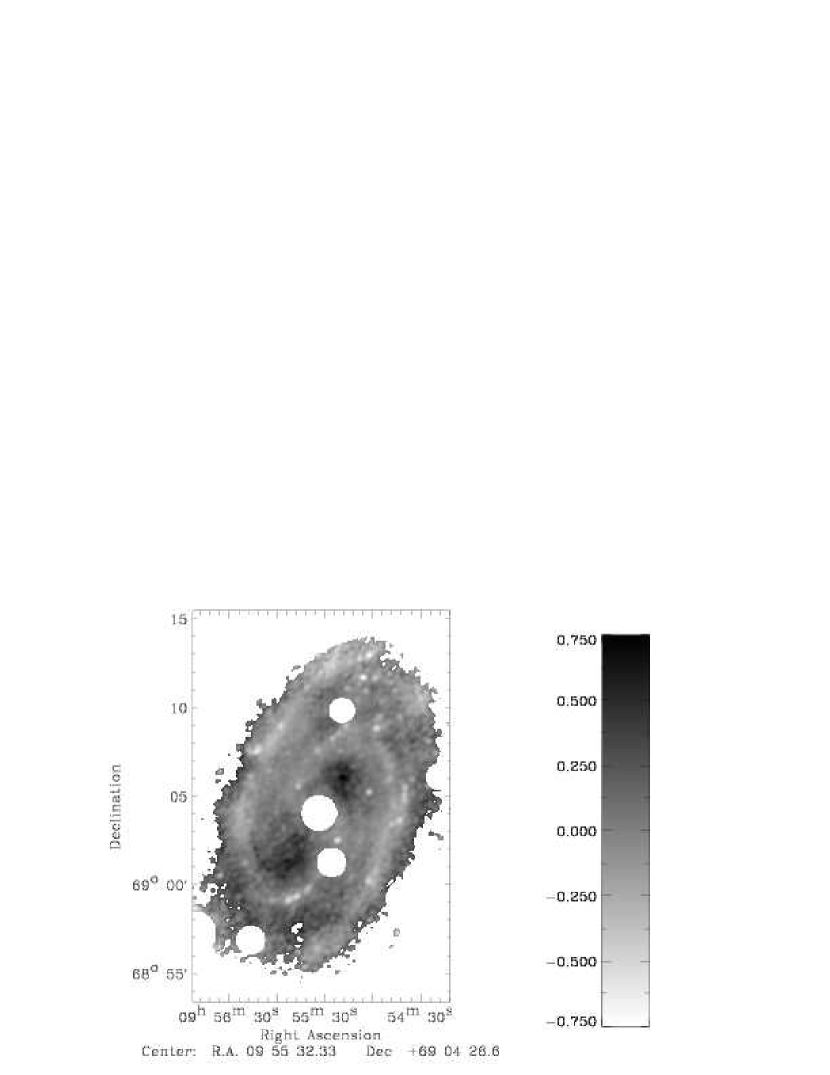
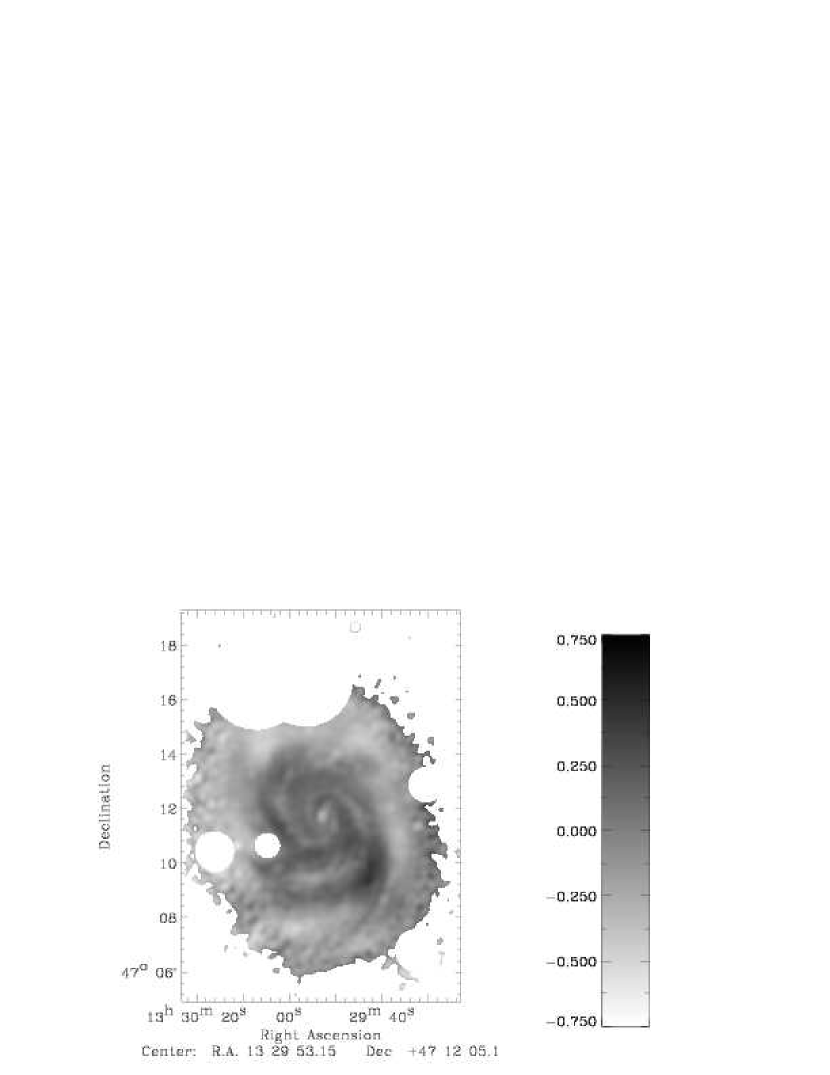
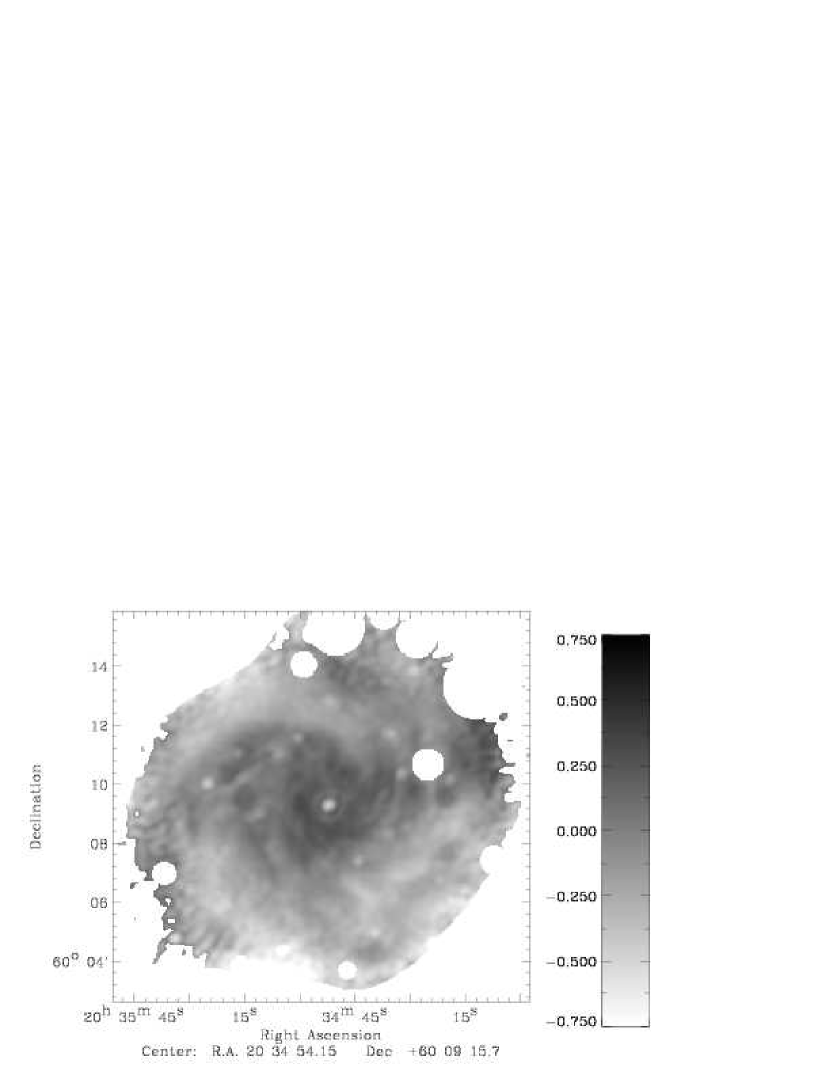
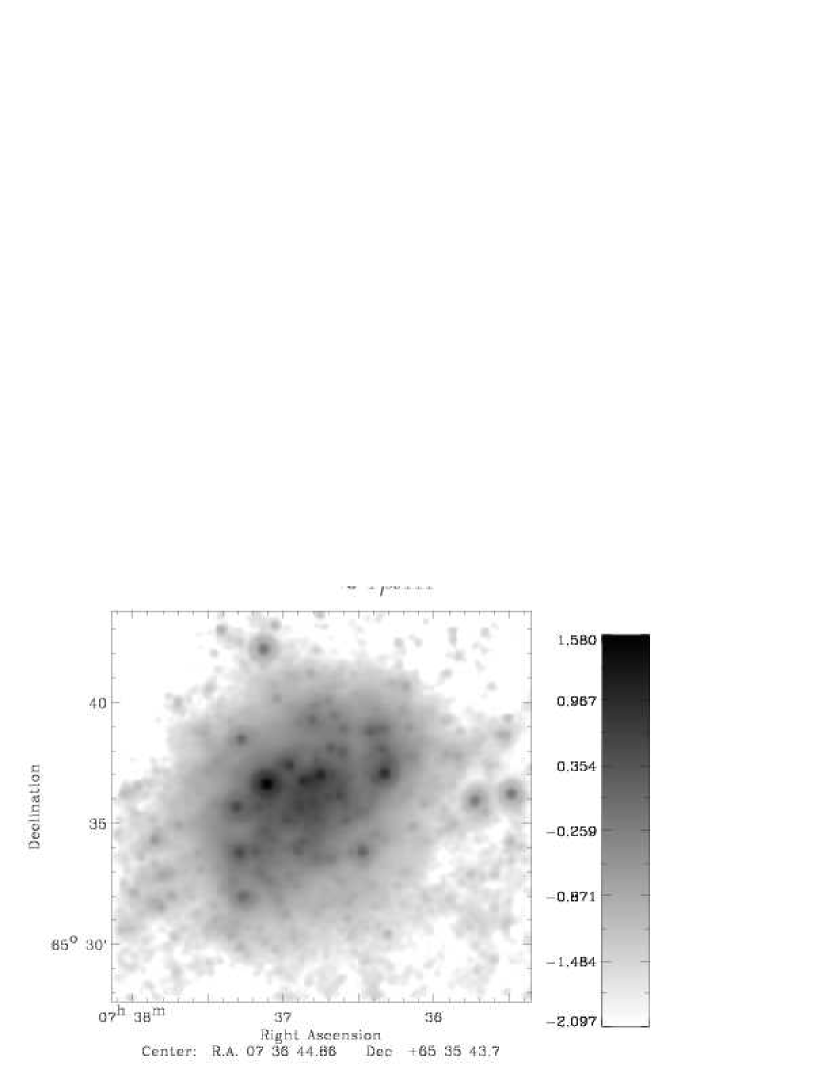
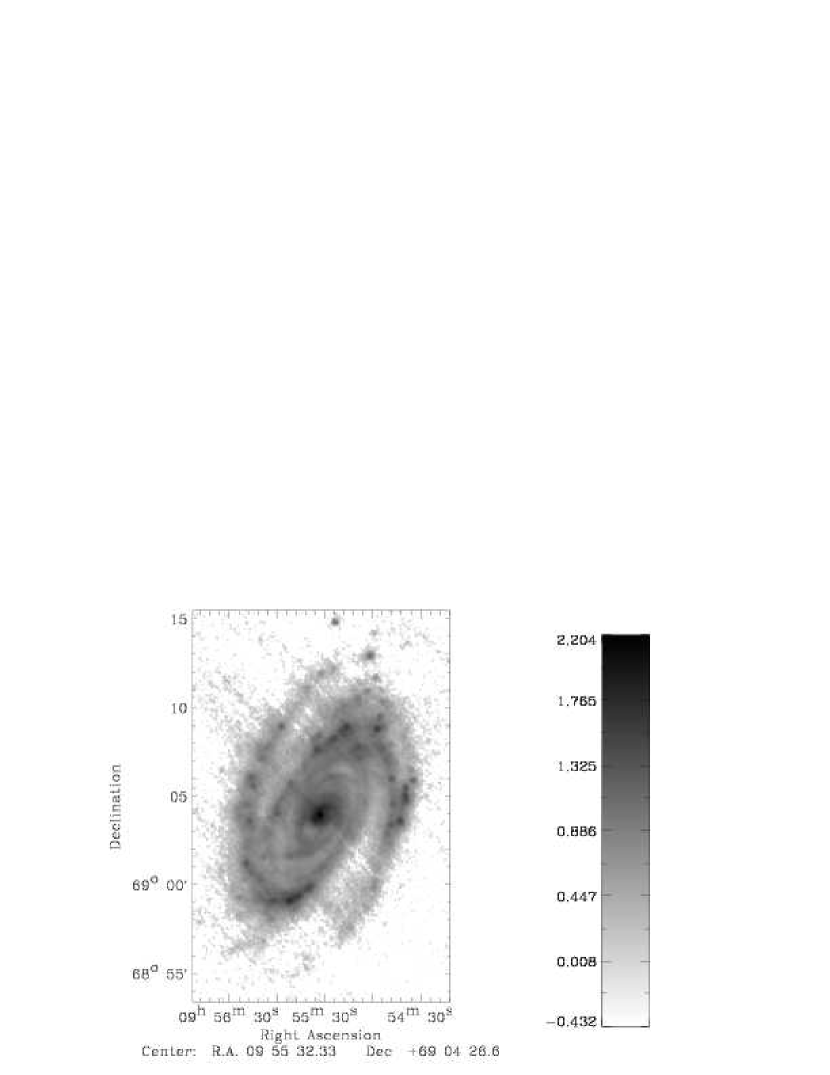
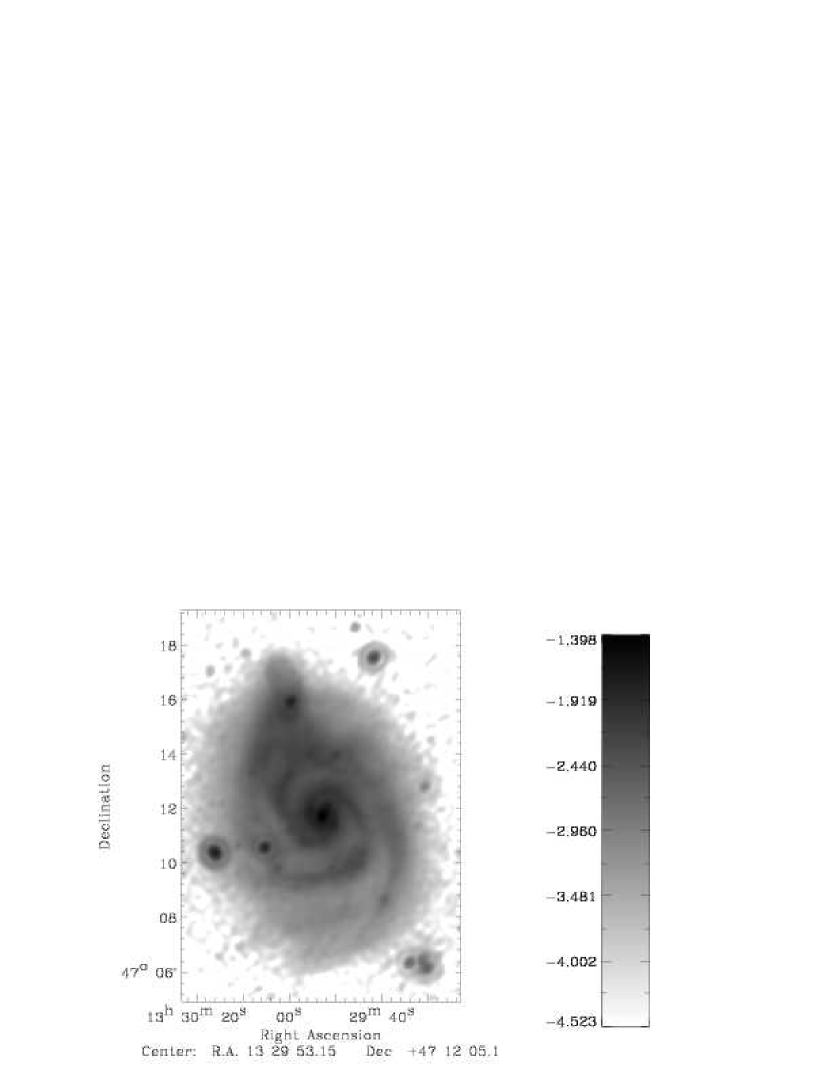
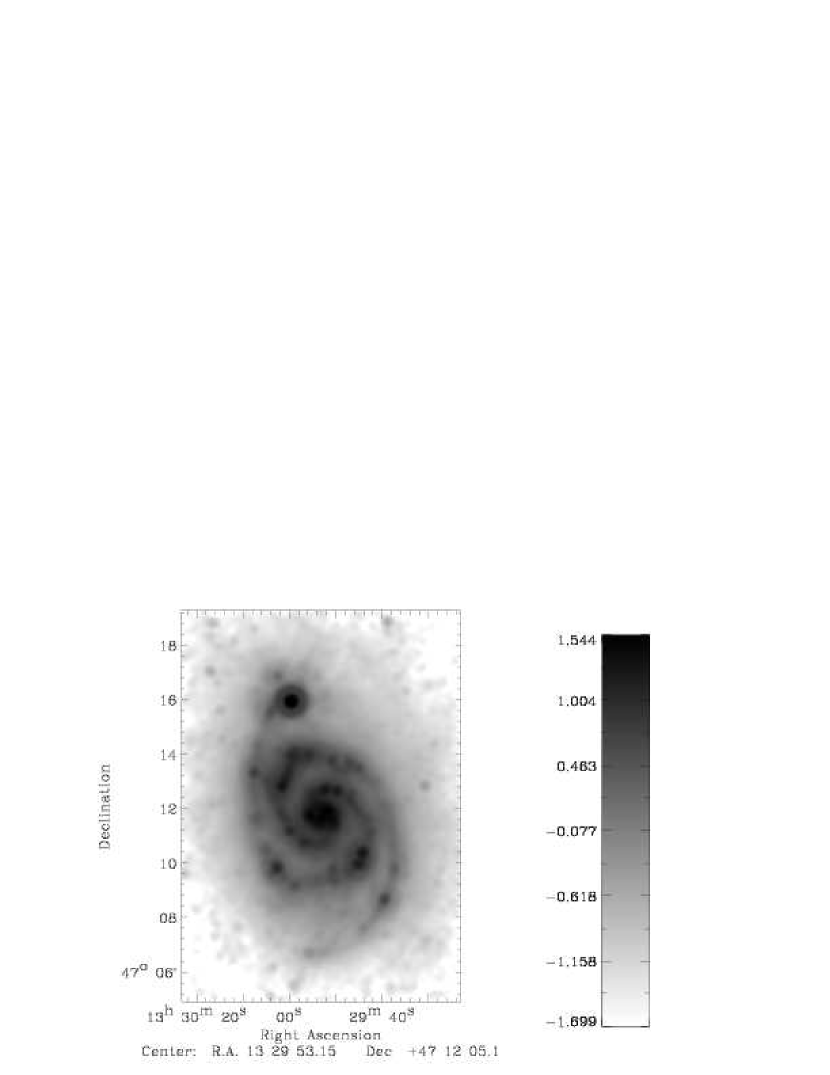
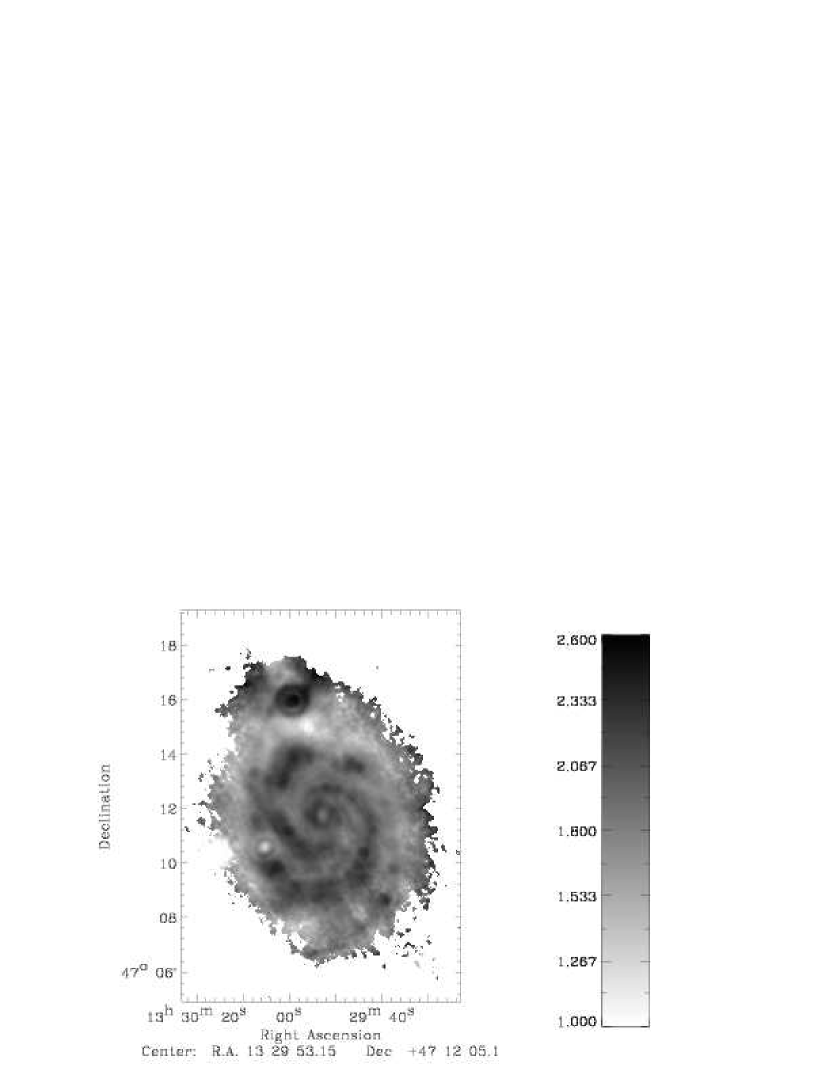
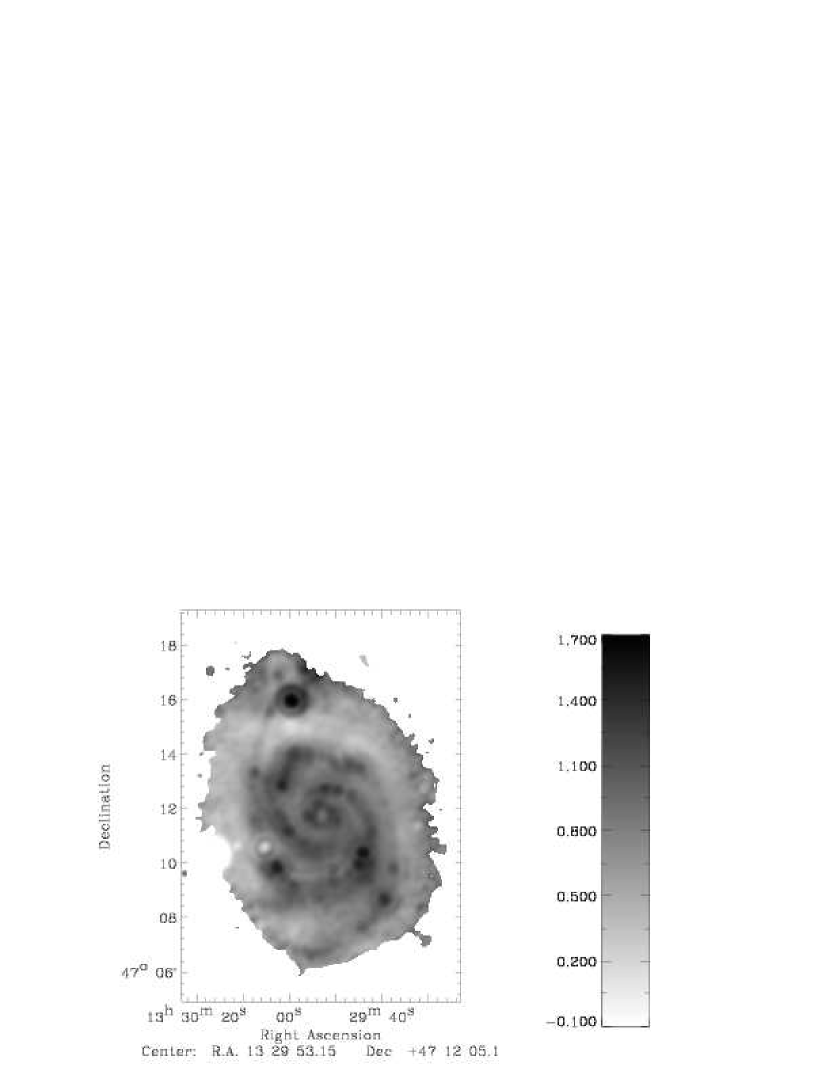
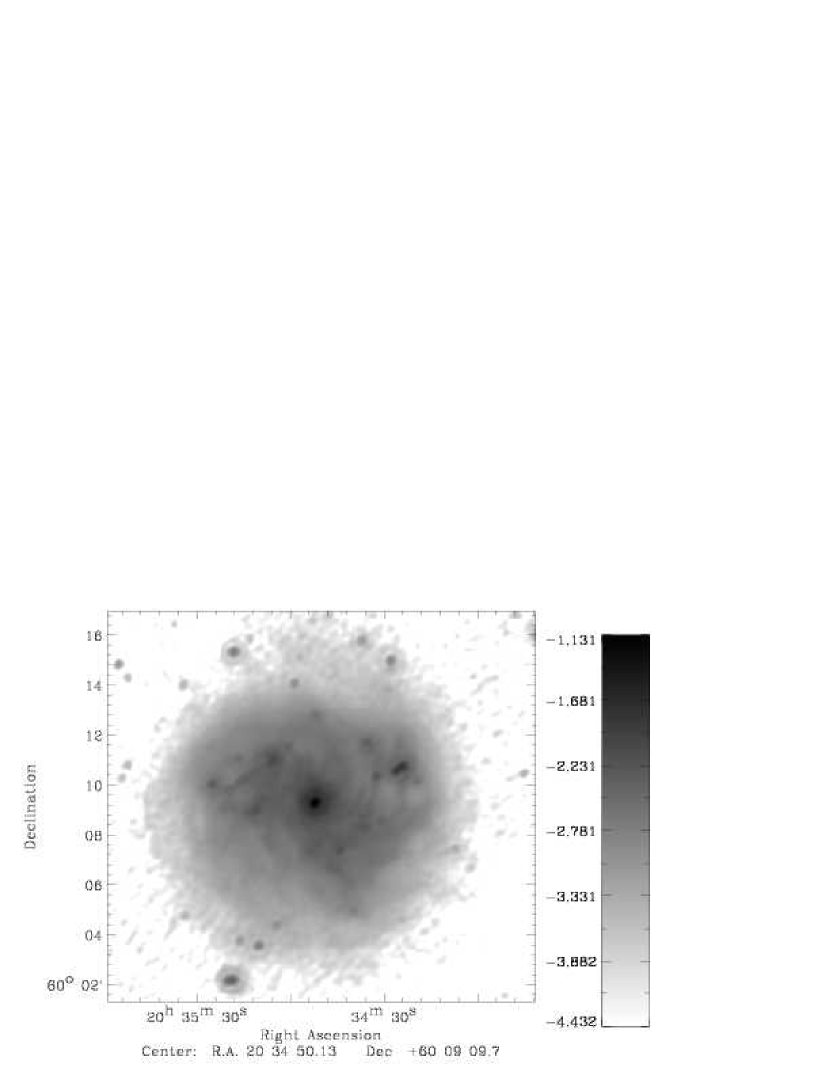
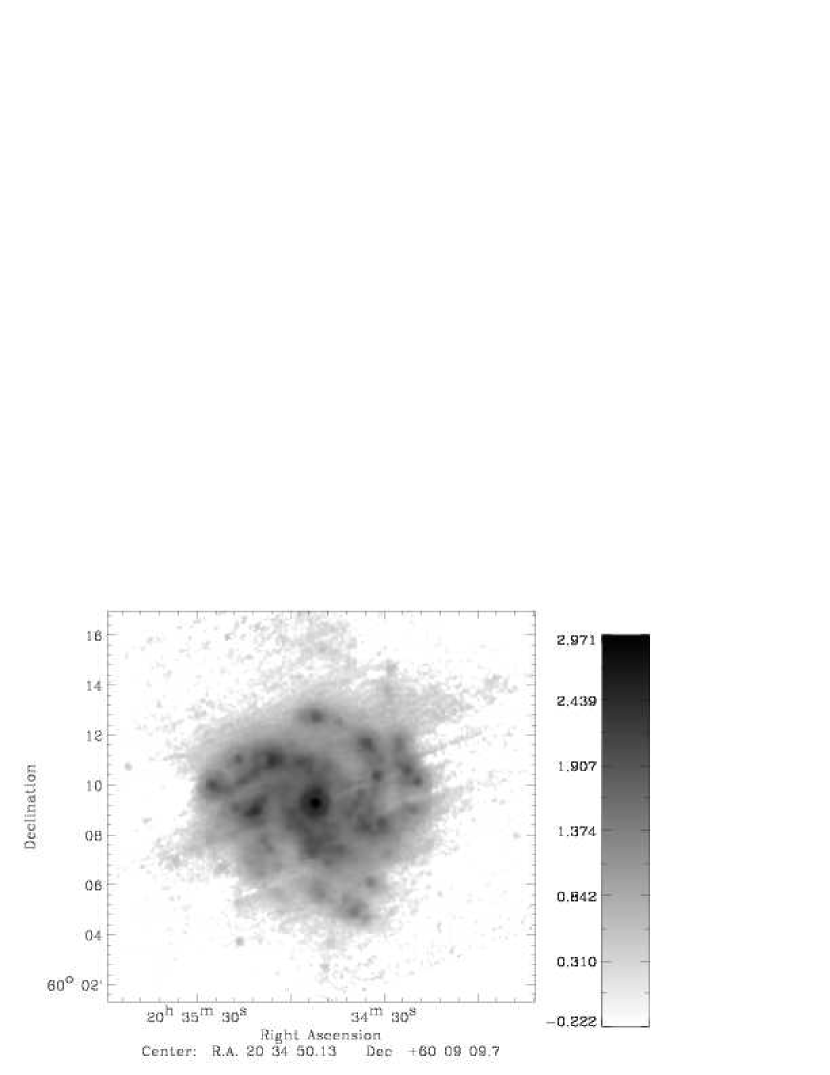
The MIPS 24 images were then convolved to match the 70 beam using custom smoothing kernels. The convolution kernels convert an input PSF into a lower resolution output PSF using the ratio of Fourier transforms of the output to input PSFs. As part of the creation of these kernels, the high frequency noise in the input PSF is suppressed (for details see K. D. Gordon et al. (2005, in preparation)). The resulting 70 and 24 maps are displayed in the second and third columns of Figure 1, respectively, and the RMS noise of the convolved 24 maps is listed in Table 2. The final radio maps, having beams matched to the MIPS 70 PSF (see 2.2), are displayed in the first column of Figure 1. Finally, we cross-correlated the radio and MIPS images to measure and remove any existing MIPS position offsets.
After the above image registration and PSF matching was carried out, we constructed logarithmic infrared/radio ratio ()-maps, where
| (1) |
for 24 and 70 . The only exception, as mentioned in 2.2, is the case of NGC 3031 where a 20 cm radio continuum map was used. The and maps for each galaxy are presented in the fourth and fifth columns of Figure 1, respectively, for pixels having 3 detections in each of the infrared and radio images.
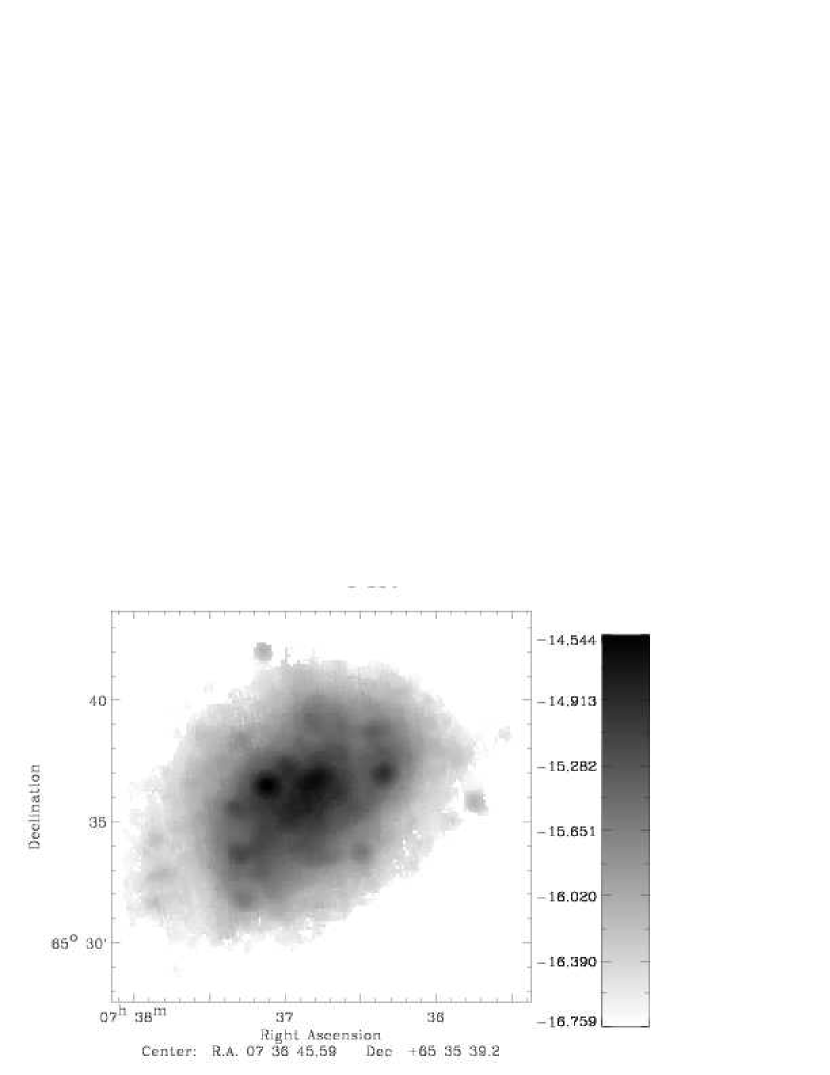
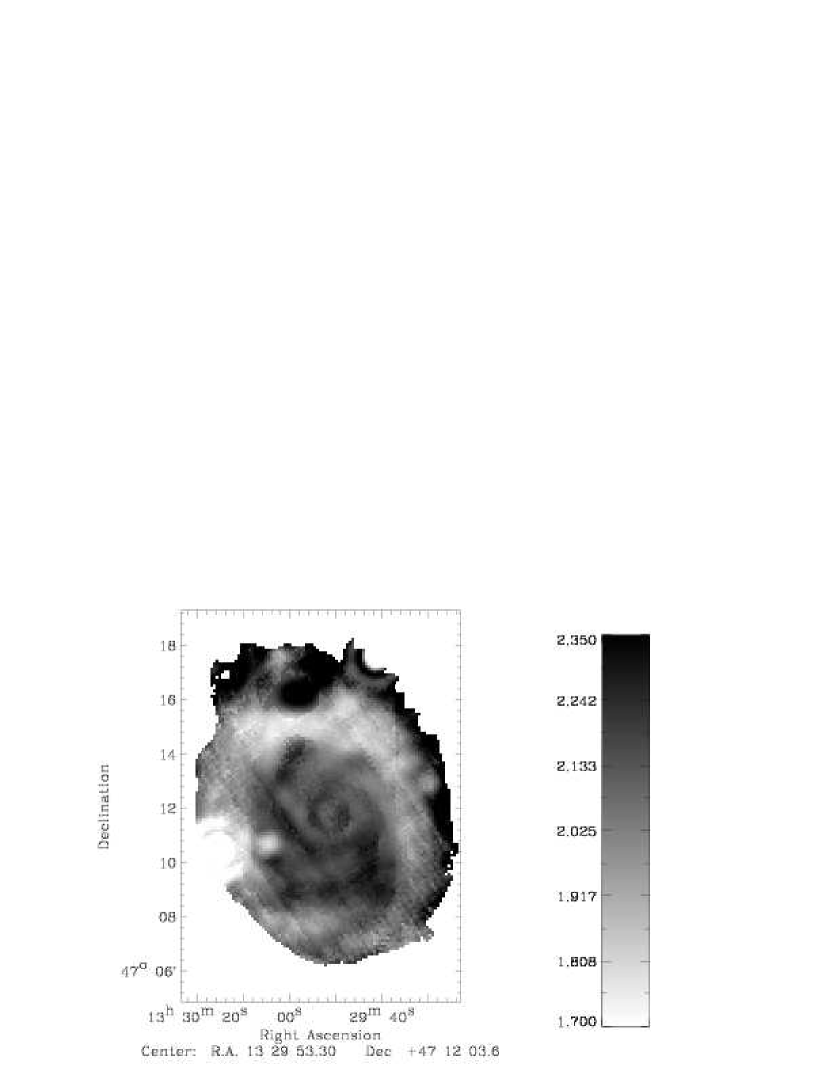
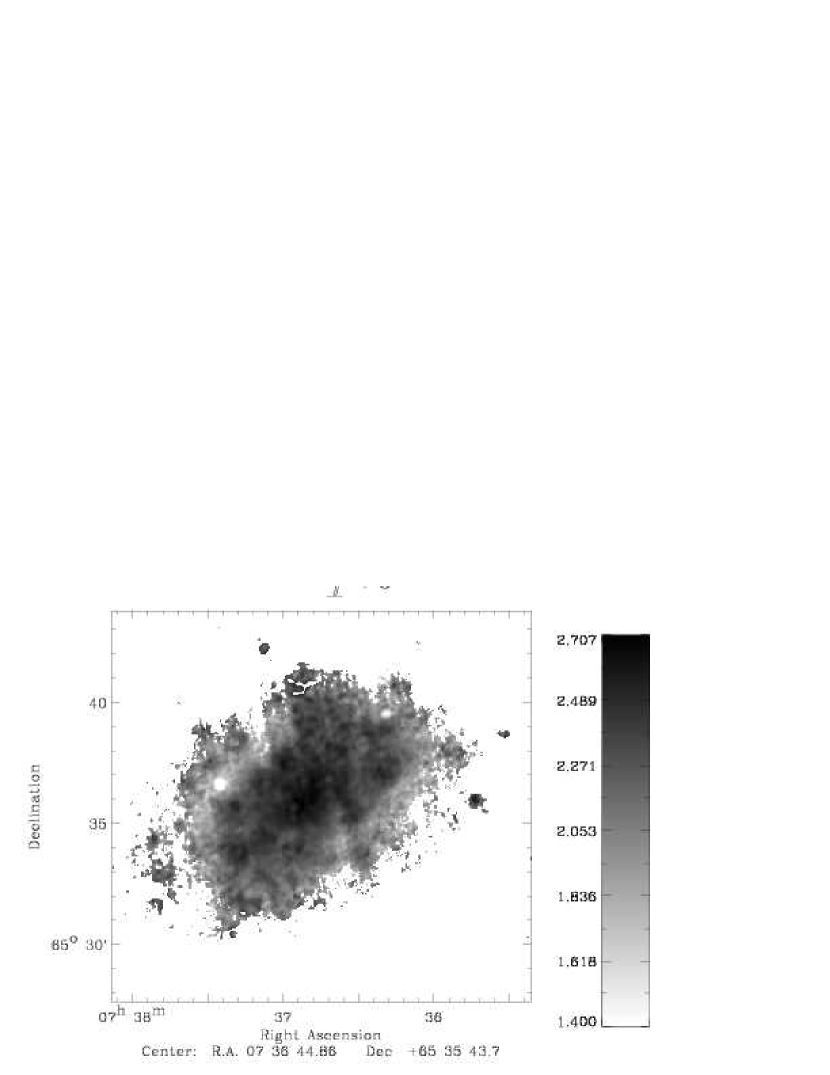
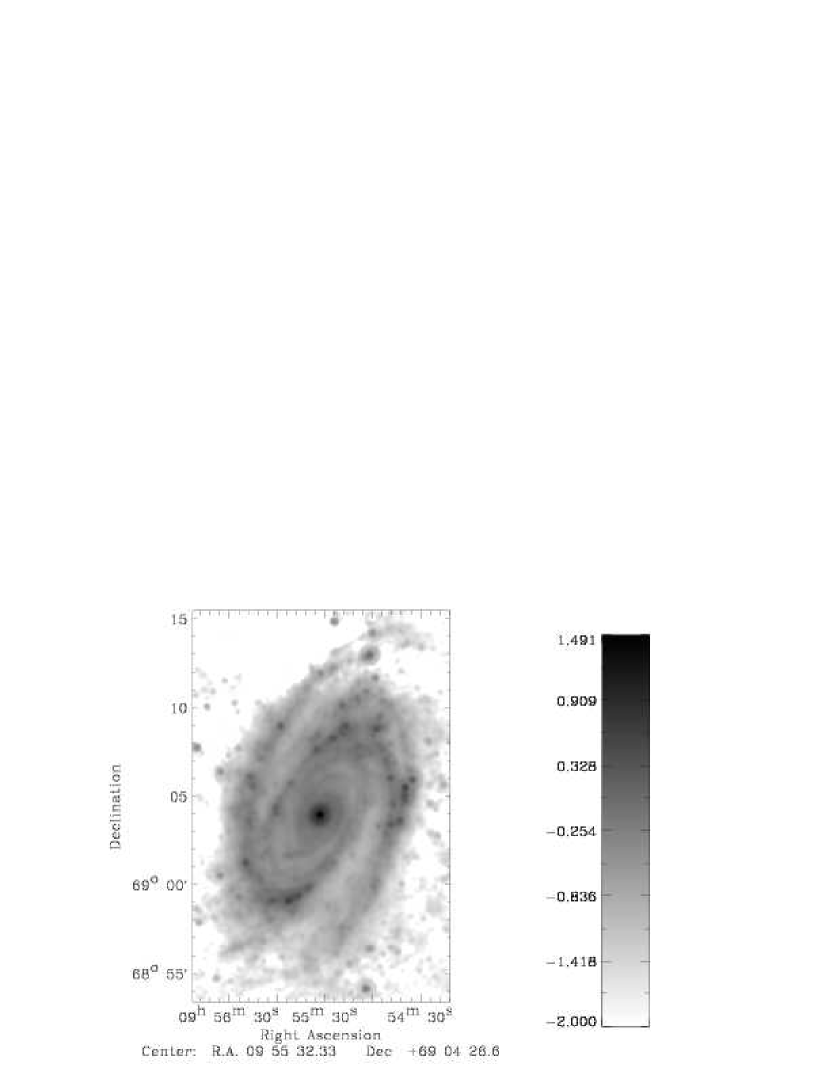
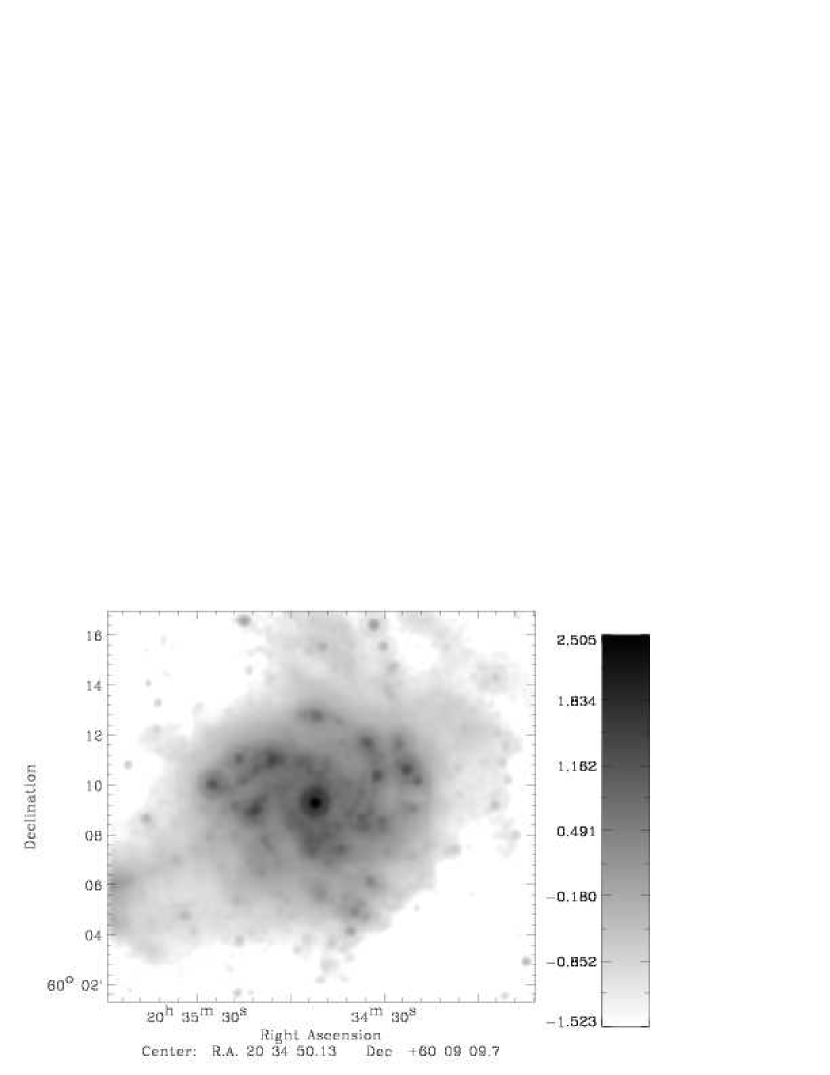
We tested to ensure that using the monochromatic 70 emission does not significantly affect conclusions drawn about the FIR-radio correlation by comparing and maps at matching resolutions. In order to do this we performed the same pre-analysis procedure described above to properly match the radio continuum and the 24 and 70 images to the resolution and pixel scale at 160 . We then constructed a total infrared (3-1100 , TIR) map using Equation 4 from Dale & Helou (2002) and estimated the FIR fraction using the same Dale & Helou (2002) spectral energy distribution (SED) models for pixels having 3 detections in each MIPS band. Finally, we constructed the logarithmic FIR/radio ratio map following the convention of Helou, Soifer, & Rowan-Robinson (1985), such that
| (2) |
for pixels which are also detected above the 3 level in the radio continuum image. The 160 , FIR, and maps for each galaxy are presented in the left, middle, and right columns of Figure 2, respectively. Results comparing the behavior of the monochromatic ratios with ratios at matching resolutions are presented in 3.1.
2.4 Aperture Photometry
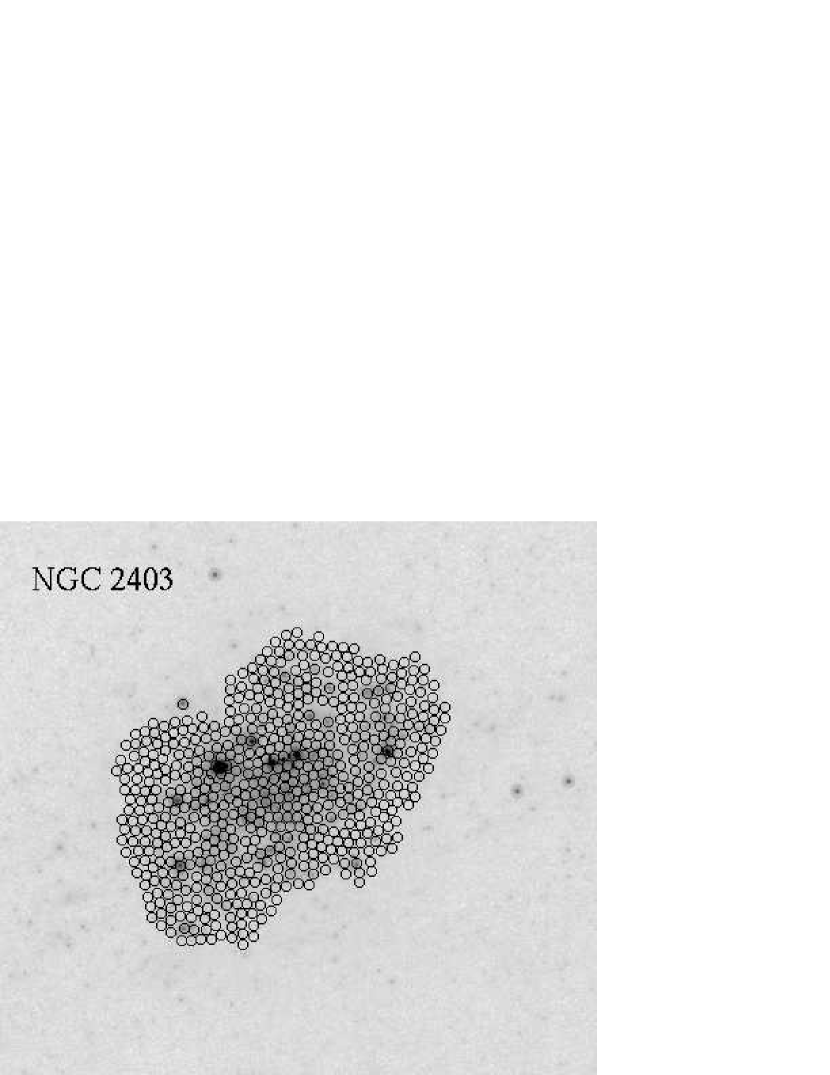
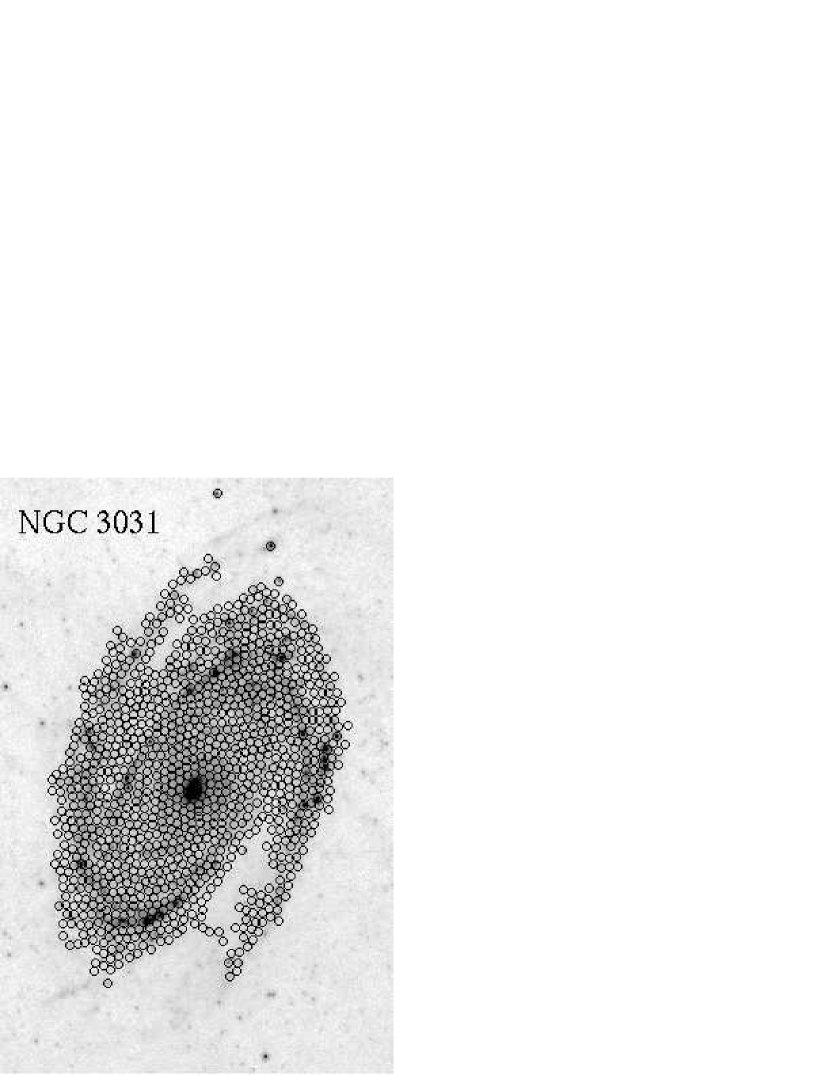
To probe the variations that exist within each galaxy, we compare values differentiating, to the extent possible, nuclear, arm, inter-arm, disk, inner-disk, and outer-disk environments. This procedure is carried out over ’critical’ apertures, defined by diameters equal to the FWHM of the PSF. Critical apertures of a given angular extent naturally correspond to different projected physical scales for galaxies at different distances. Assuming distances to each galaxy given in Table 1, the FWHM of the 70 beam corresponds to ’critical’ apertures of 0.3, 0.3, 0.5, and 0.75 kpc for NGC 2403, 3031, 6946, and 5194, respectively.
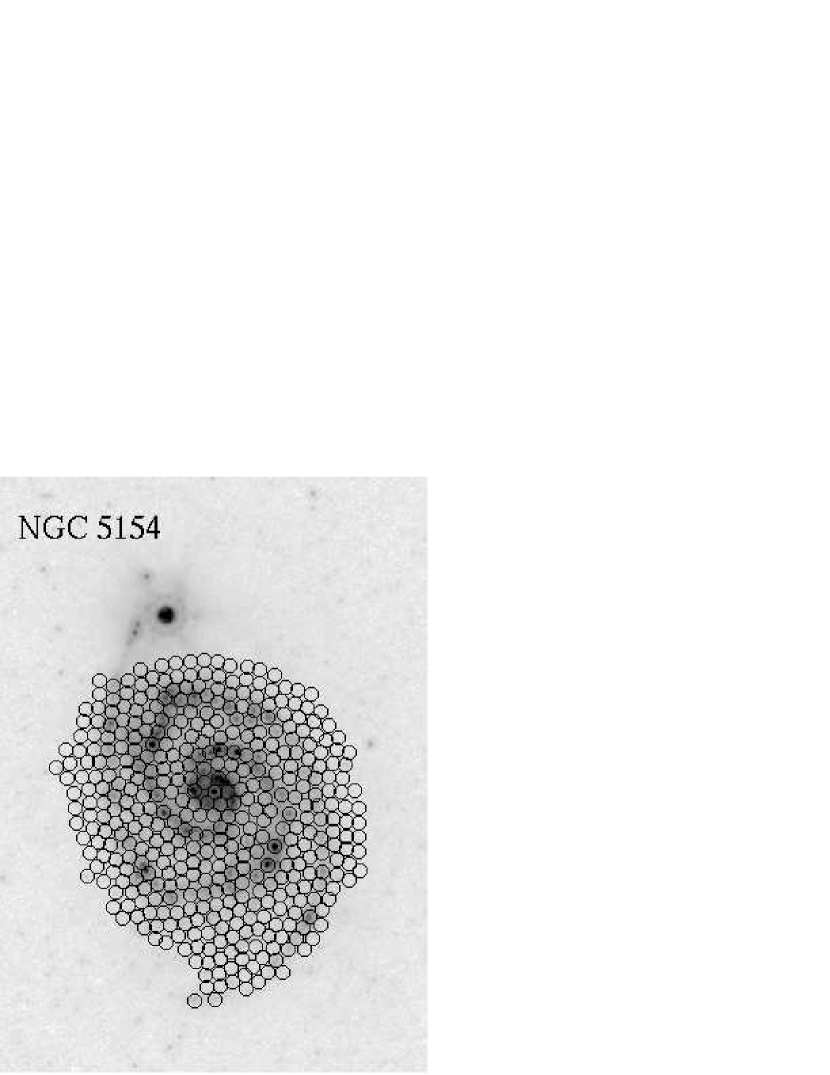
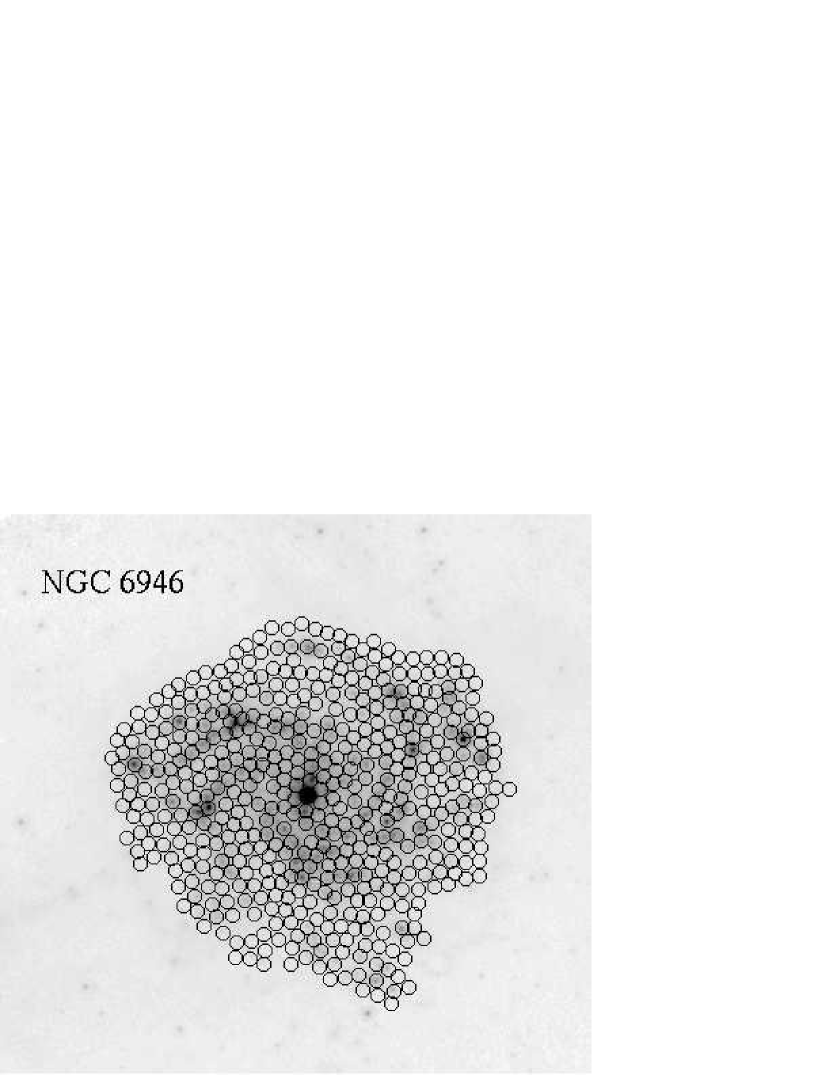
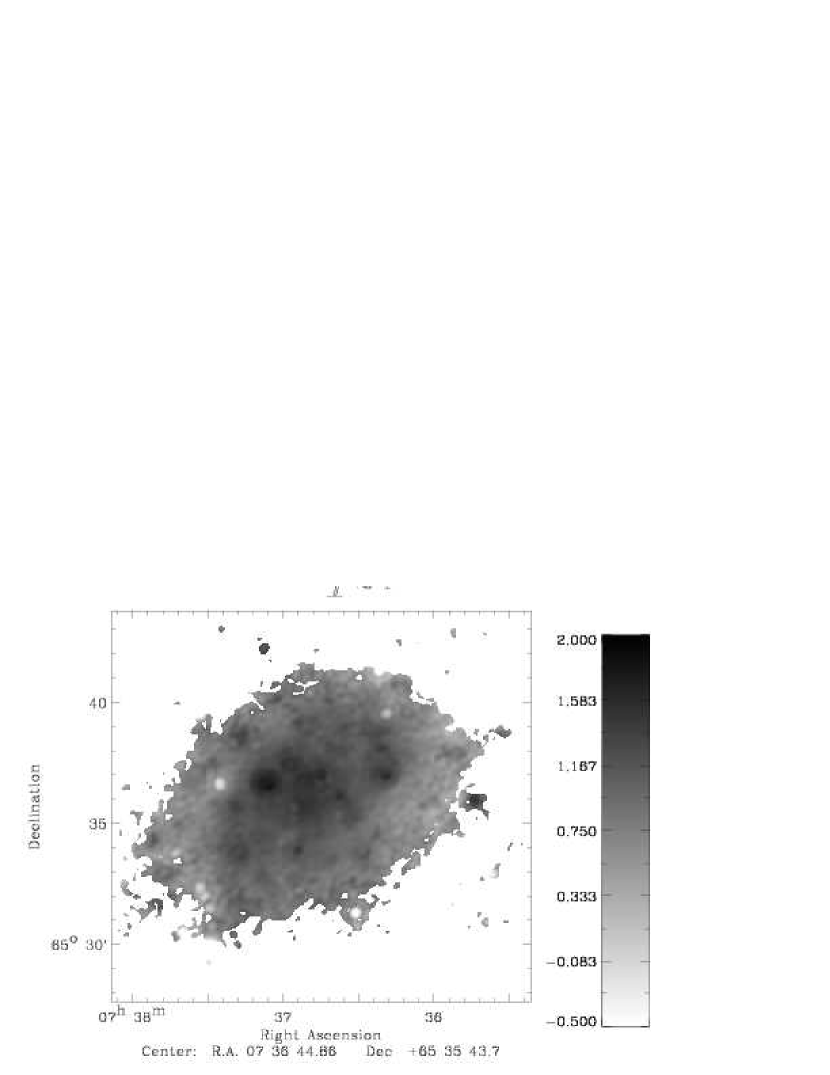
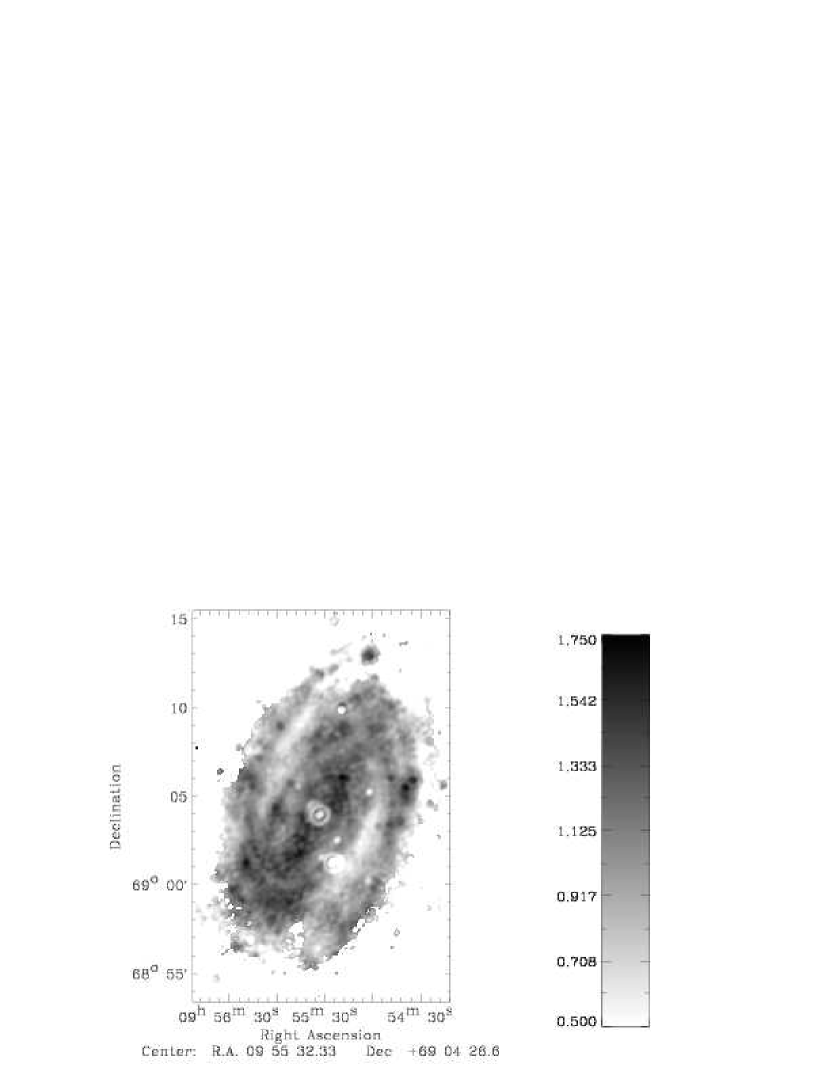
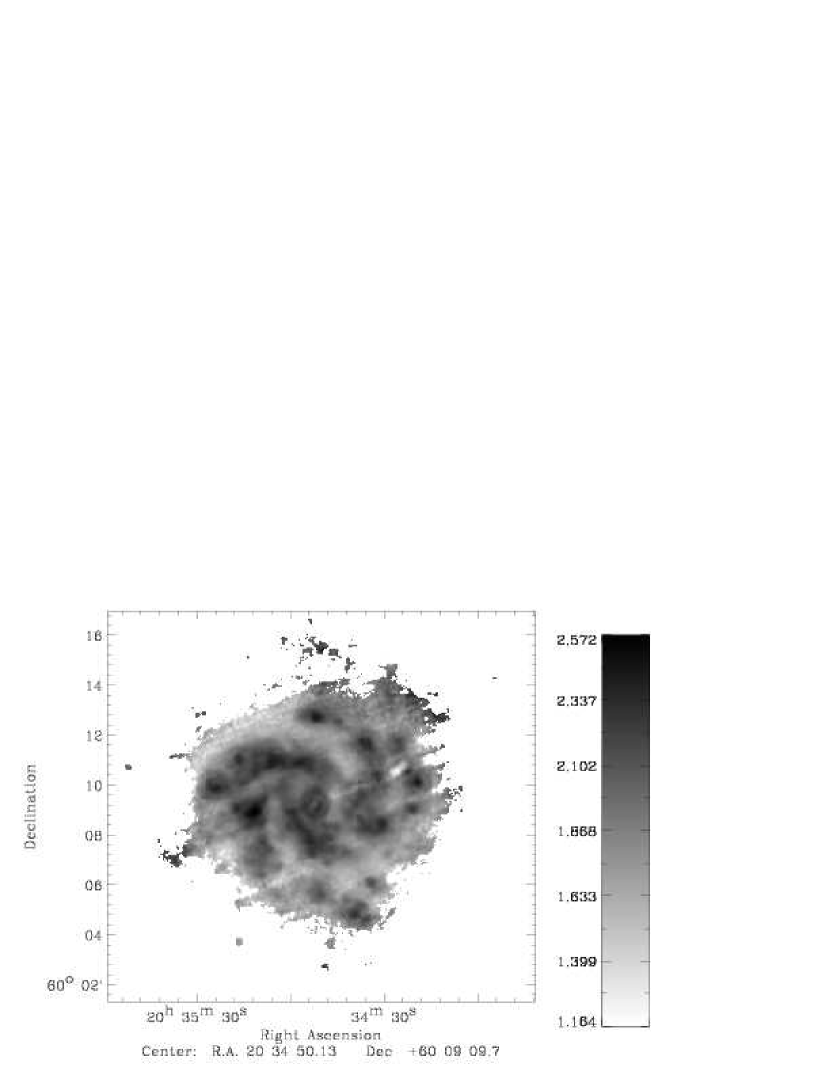
Aperture masks were created using the 24 images in their native resolution. The different regions are defined as follows. Nuclear regions are the bright central point in the galaxy, co-spatial in both the infrared and radio maps (except for NGC 2403 where the nucleus was not identifiable). Arm regions trace the spiral arms and are centered on individual giant H II regions where possible, but also contain the observed emission in between discrete star-forming regions within each arm. Inter-arm regions probe the more quiescent areas in between spiral arms. Inner-disk regions are circumnuclear regions ( kpc) that are both bright and not clearly associated with any large coherent structures, such as an inner-ring of spiral arms. We define the star-forming disk to contain all obvious star formation sites visible in the 24 images. Disk regions are areas within the star-forming disk, that are both diffuse and not clearly associated with any type of coherent structures. Outer-disk regions are identified as areas of diffuse emission surrounding the the star-forming disk. Our aperture masks for each galaxy are illustrated in Figure 3. Results of the aperture photometry are discussed in , and a summary of statistical results, including the mean () and dispersion () of the measured logarithmic infrared/radio ratios for each galaxy, is presented in Table 3.
3 Results
3.1 Infrared/Radio Maps
An inspection of the maps, presented in the fourth and fifths columns of Figure 1, reveals structure in the ratio images corresponding to the patterns of star-formation in each galaxy disk. We also find that all galaxies have dynamic ranges in and each spanning 1 dex. For comparison, previous studies of the FIR/radio ratios within NGC 3031 (M81) showed variations by a factor of 6, excluding its AGN nucleus (Gordon et al. , 2004), and by an order of magnitude within M31 (Hoernes, Berkhuijsen, & Xu , 1998).
By comparing our maps in Figure 2 with the and maps in Figure 1, we find the morphologies and associated trends are generally similar. Quantitatively, we compare the dispersions in (), (), and () across each disk using projected 1.5 kpc diameter apertures. Looking at the computed dispersion for each disk in Table 4 we find that the scatter generally decreases when using 70 data as opposed to the 24 data and is lowest in all cases when using the estimated FIR emission. This suggests that the correlation between the radio and FIR emission within each galaxy is tighter than the correlation between the radio and either of the monochromatic 70 or 24 emission bands. However, since the dispersion in is only 0.03 dex larger than the dispersion in , we perform our analysis at our best common resolution between the infrared and radio data (i.e. at the 70 resolution) since the area of the beam is a factor of 4 smaller than at the resolution of the 160 data.
We find elevated infrared/radio ratios at 70 and 24 associated with bright structures appearing in the input infrared and radio images of each galaxy. The most obvious case is seen for the bright spiral arms of NGC 3031, NGC 5194 and NGC 6946. The spiral structure in all three of these galaxies is visible in their infrared/radio ratio maps, which show enhanced values along the arms with local peaks centered on H II regions and depressed ratios located in the quiescent inter-arm and outer-disk regions of each galaxy. For NGC 2403, which does not have a grand-design spiral morphology, we still see and peaks associated with H II regions.
While the peaks in the and maps appear spatially coincident, there is a slight difference in their morphologies. Even after degrading the resolution of the 24 maps to match the PSF at 70 , the corresponding maps display a more compact morphology around star-forming regions within each galaxy. This observation is expected since 24 emission traces hotter dust than emission at 70 and is therefore more localized around active star-forming regions. In comparing the and maps for NGC 3031, NGC 5194 and NGC 6946, we find the spiral arms in each galaxy appear less broad and have more strongly peaked H II regions in the maps compared to the maps. We find a similar result for the bright H II regions in NGC 2403. These observations are consistent with recent Spitzer results by Helou et al. (2004) who report 24 emission to be strongly peaked in star-forming regions within NGC 300 and consequently suggest that emission at 24 is an intimate tracer of ongoing star formation.
3.2 Infrared/Radio Ratios vs. Infrared Surface Brightness
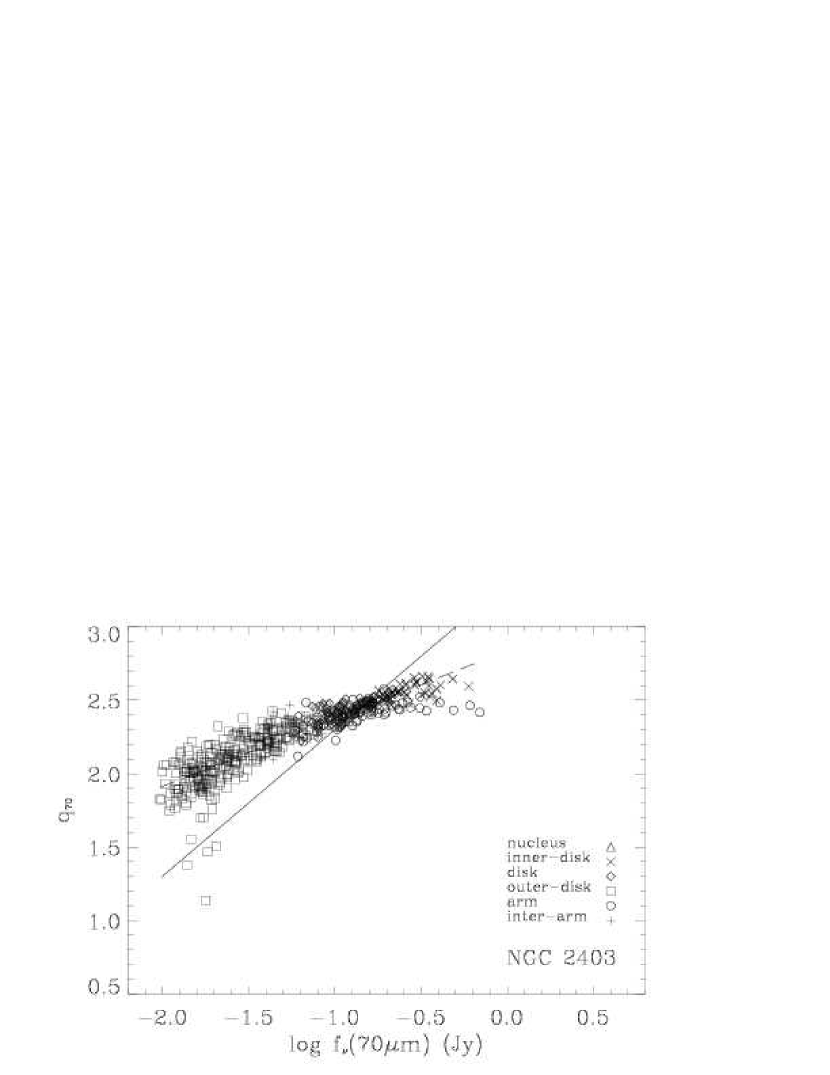
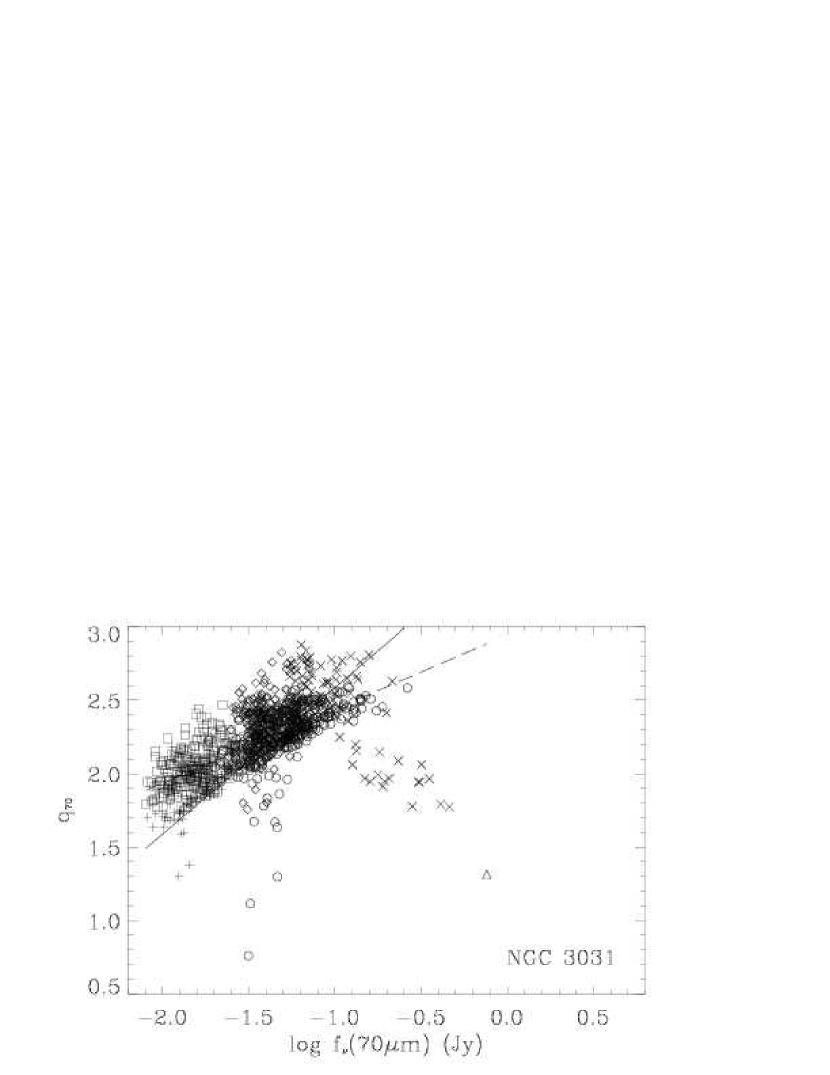
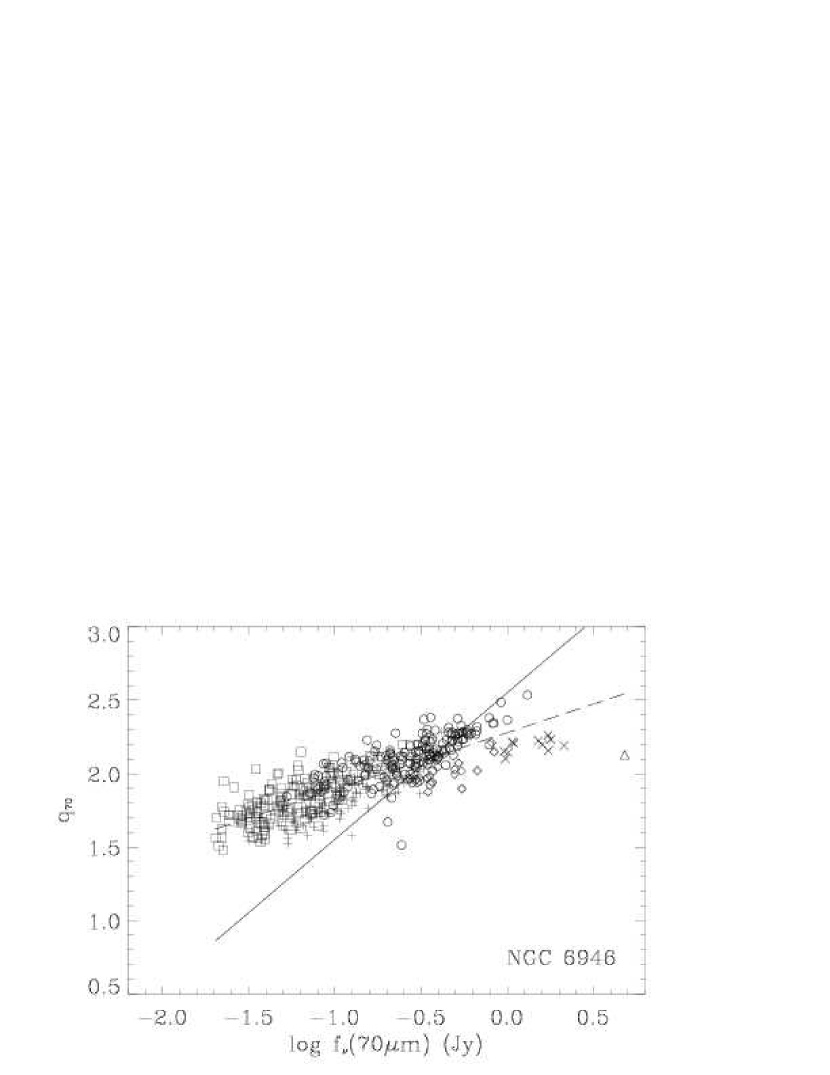
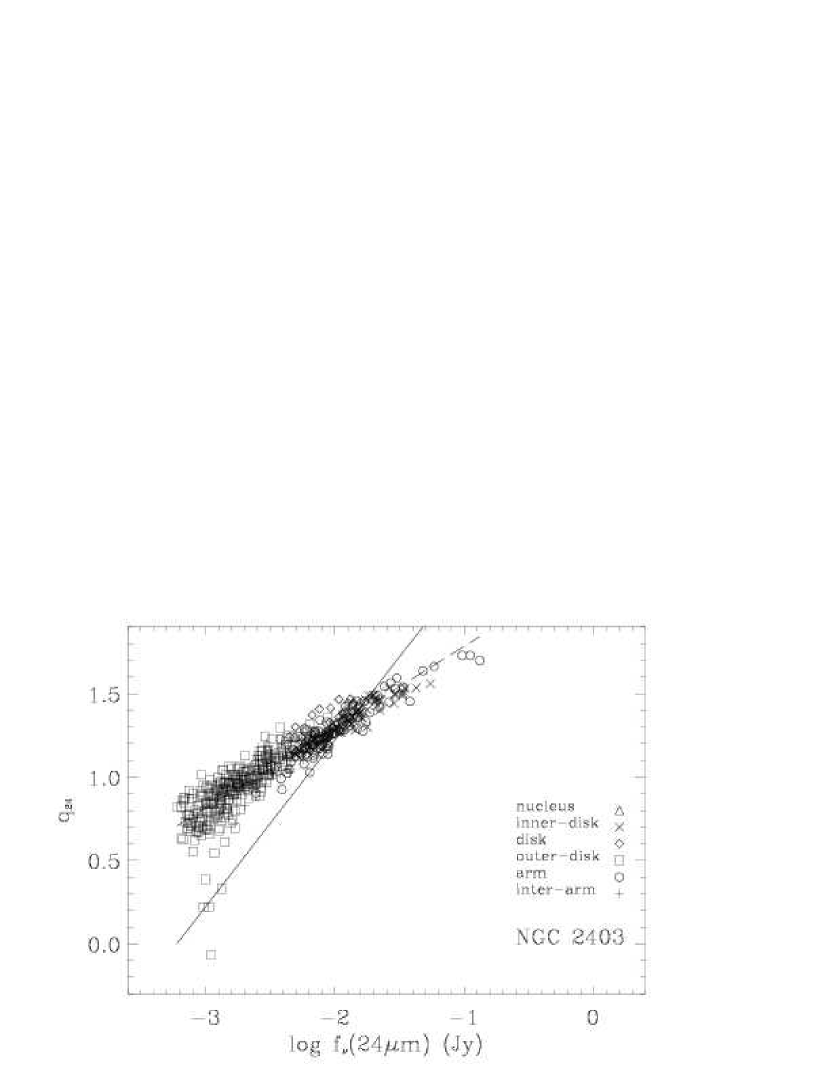
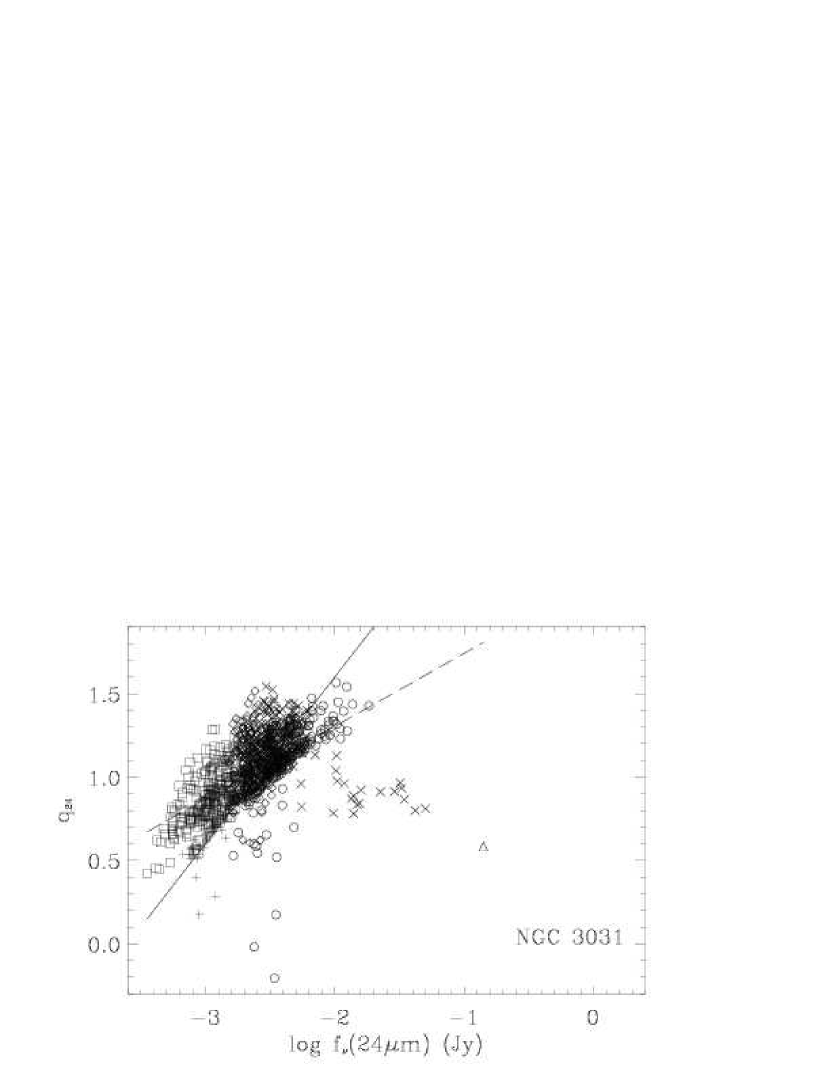
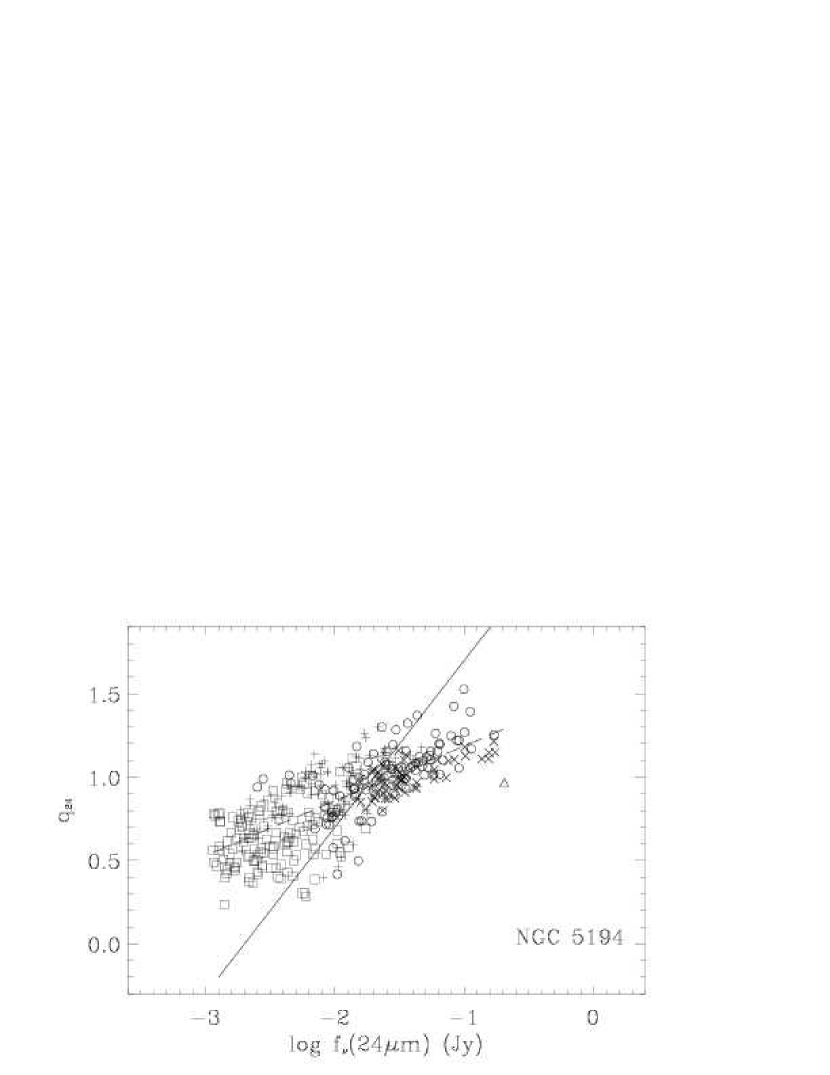
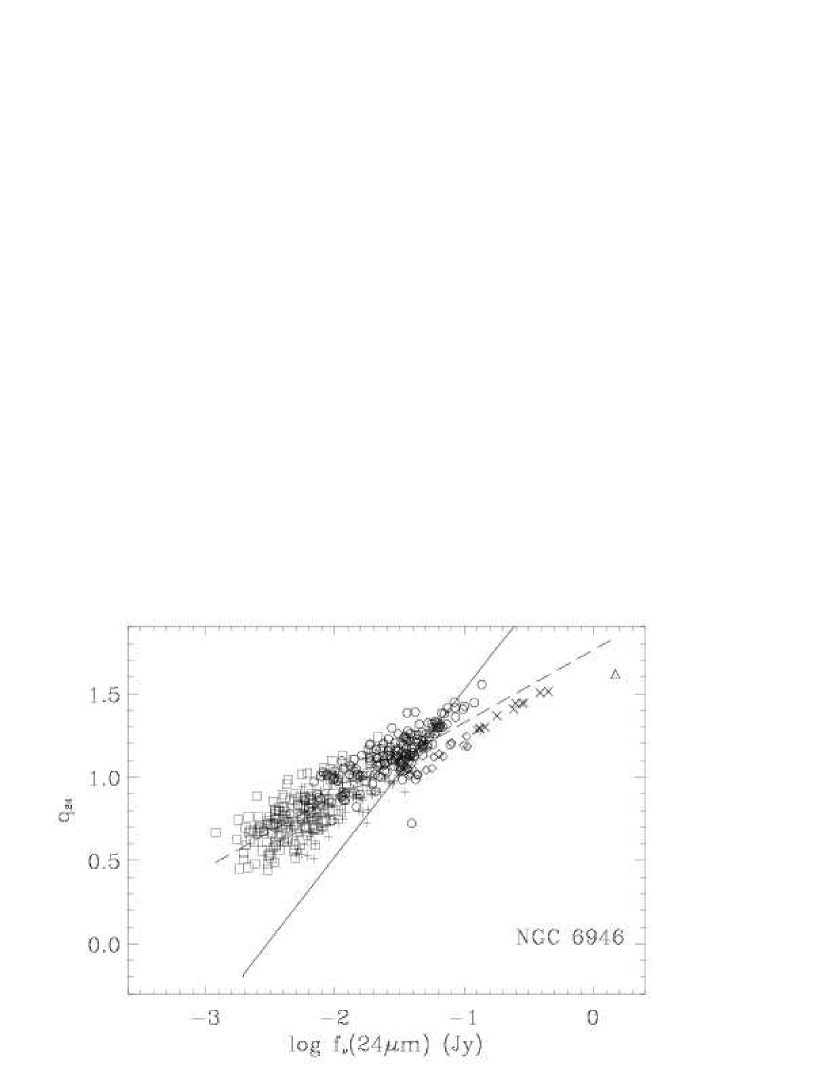
In order to see how ratios vary with the strength of infrared surface brightness within each galaxy, we produced scatter plots using the infrared and radio flux densities extracted from our aperture photometry scheme described in 2.4. Since the measuring apertures are equal in diameter for each galaxy, the measured flux densities are directly proportional to surface brightnesses. These results are illustrated for both and in Figures 4 and 5, respectively. As these plots have naturally correlated axes, we over-plotted the relation expected if the radio disk were completely flat in brightness across the entire galaxy.
In Figures 4 and 5, we see a general trend of increasing infrared/radio ratios with increasing infrared surface brightness. The slopes of the regression lines within the scatter plots are significantly lower (by a factor 2) than what would be expected for a radio disk characterized by a constant surface brightness. This non-linearity of increasing infrared/radio ratio with increasing infrared surface brightness within galaxies has been observed by other authors (Marsh & Helou , 1995; Hoernes, Berkhuijsen, & Xu , 1998; Hippelein et al. , 2003), and is opposite to the non-linearity observed in the global FIR-radio correlation in which the radio power of galaxies increases faster than infrared luminosity (Fitt, Alexander, & Cox , 1988; Cox et al. , 1988; Condon, Anderson, & Helou , 1991). The concern that this non-linearity may be a color effect is unwarranted since the gradient in the color correction FIR/ would have to be 5 times steeper than what is observed to eliminate this trend. The measured dispersion in and is 0.25 dex for each galaxy (see Table 3), which is only slightly larger than the nominal dispersion of 0.2 dex measured in the global FIR-radio correlation for late-type star-forming galaxies which do not host powerful AGN (Helou, Soifer, & Rowan-Robinson , 1985). Our measured dispersion, however, is in agreement with what was found by Yun, Reddy, & Condon (2001) using a much larger sample of galaxies spanning a wider range of parameters than prior IRAS-based efforts.
3.3 Environmental Trends
In all galaxies, there are clear differences in values among the different galaxy disk environments. The different environments are well separated in Figures 4 and 5, and tend to clump along the regression lines in these Figures due to their relative surface brightnesses. The measured dispersion for each environment appears to scale with the range of star formation activity within it. We also find that in the galaxies with a well defined infrared nucleus, the infrared/radio ratios of the nuclei do not fall along the regression line as seen in Figures 4 and 5. In NGC 3031 we find the nuclear and ratios lie 1.7 and 1.2 dex below what is expected from the fitted regression line, respectively. We also find that the circumnuclear regions of NGC 3031 display a trend of decreasing infrared/radios ratios with increasing infrared surface brightness. As the nucleus of NGC 3031 is known to host an AGN, this result is expected. The nucleus of NGC 5194 is categorized as an H II/Sy2, and accordingly we find the associated and ratios lie below the expectation of the regression line by 0.3 dex. The nuclear and ratios in NGC 6946 lie below the regression line expectation by 0.4 dex, even though NGC 6946 is not known to host an AGN which would provide extra radio emission.
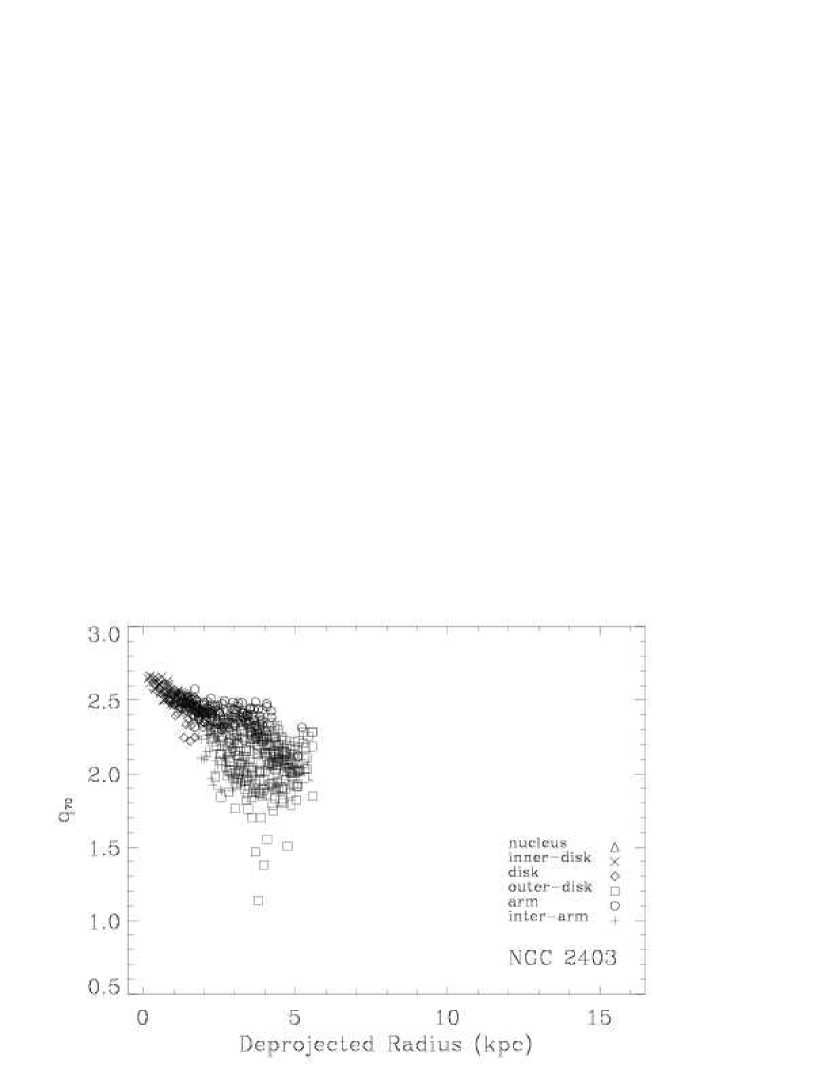
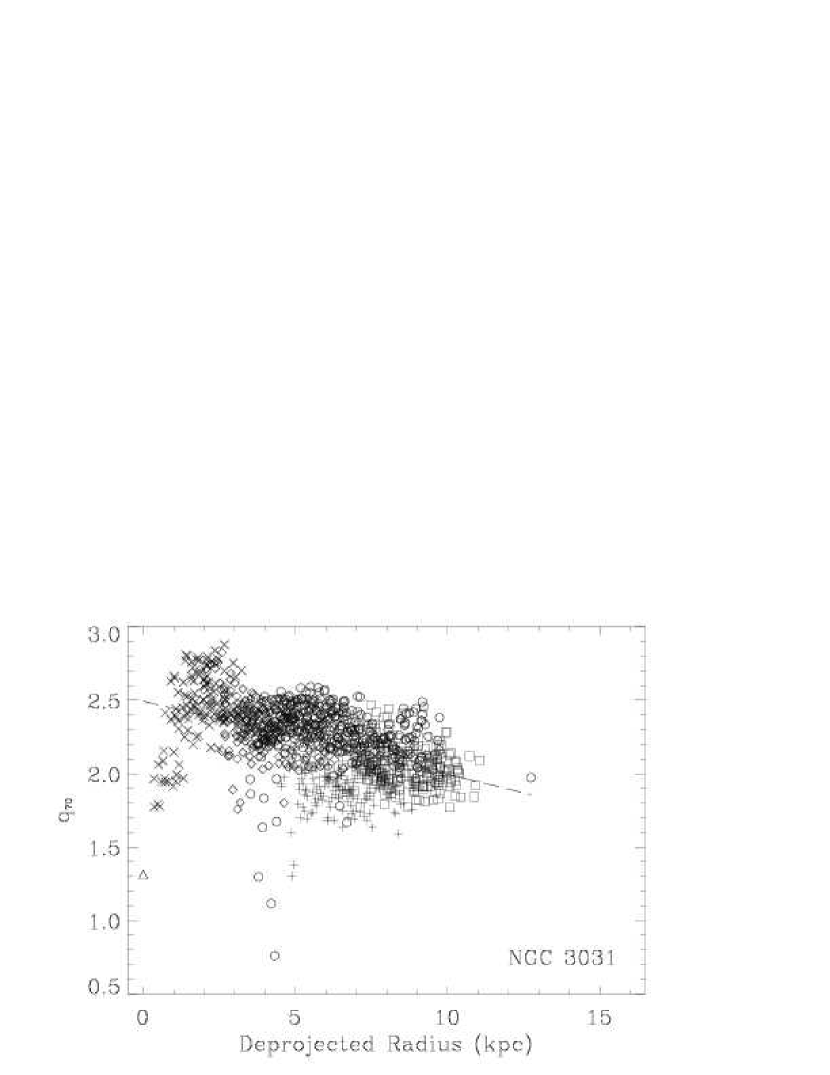
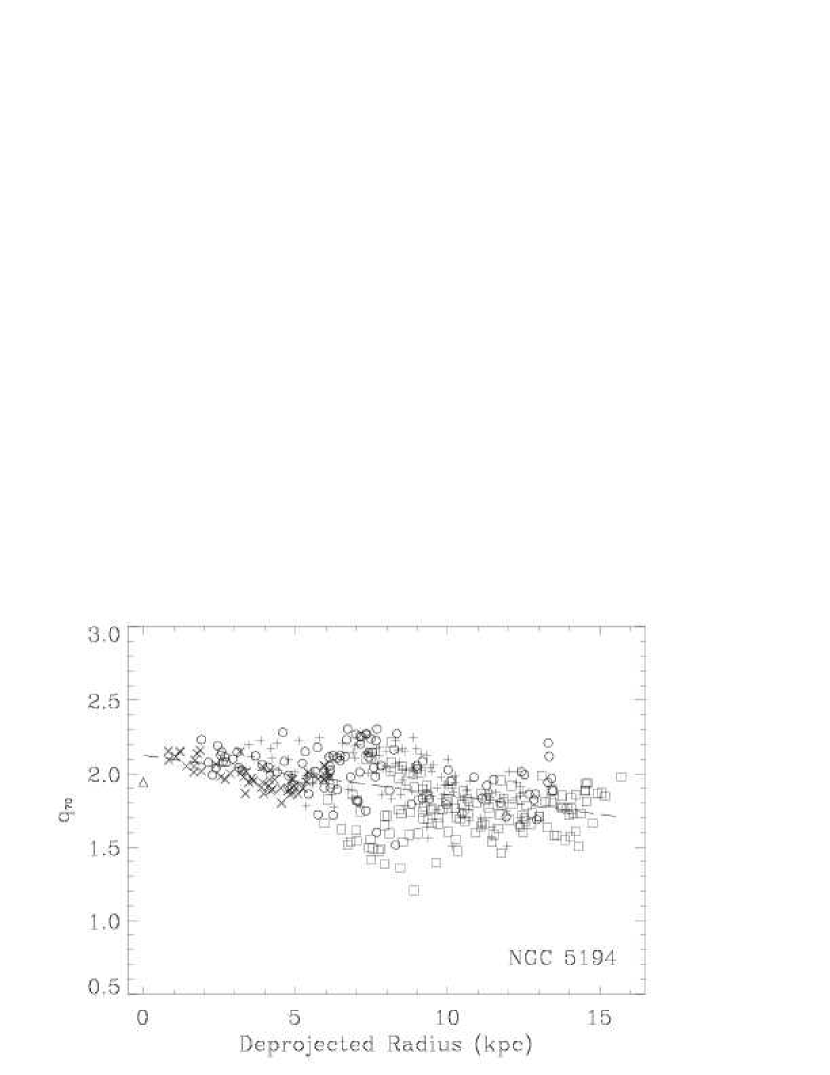
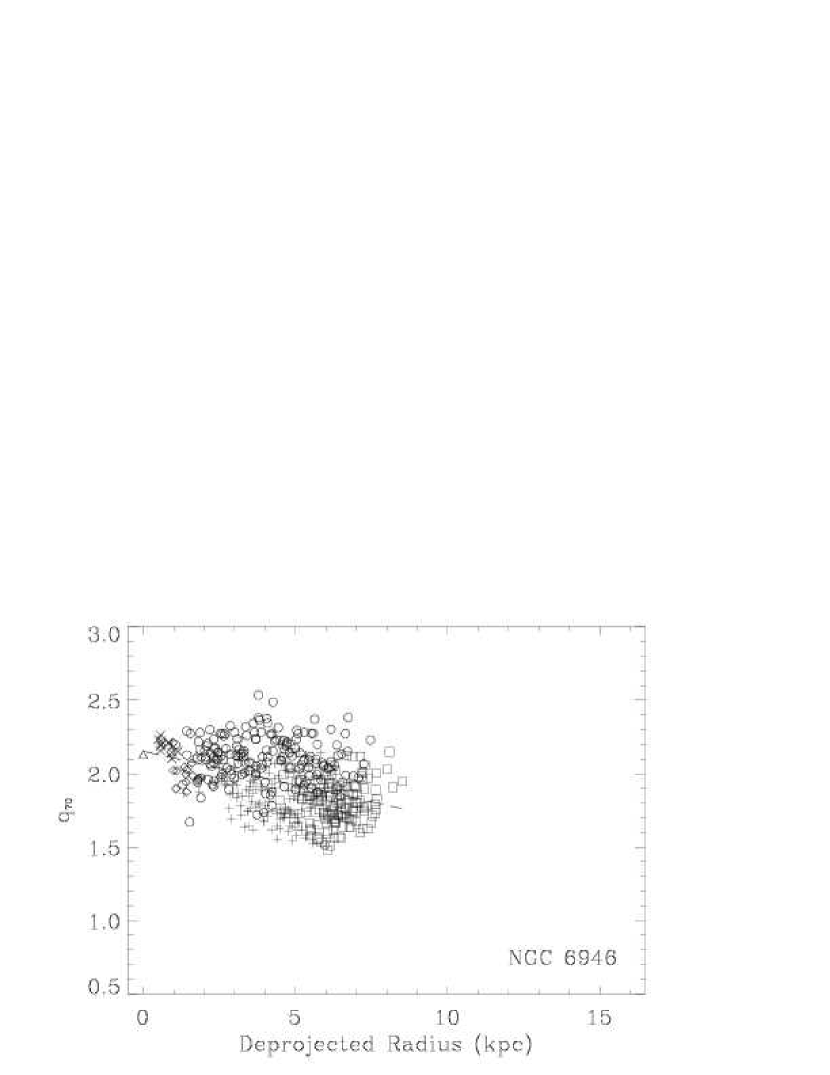
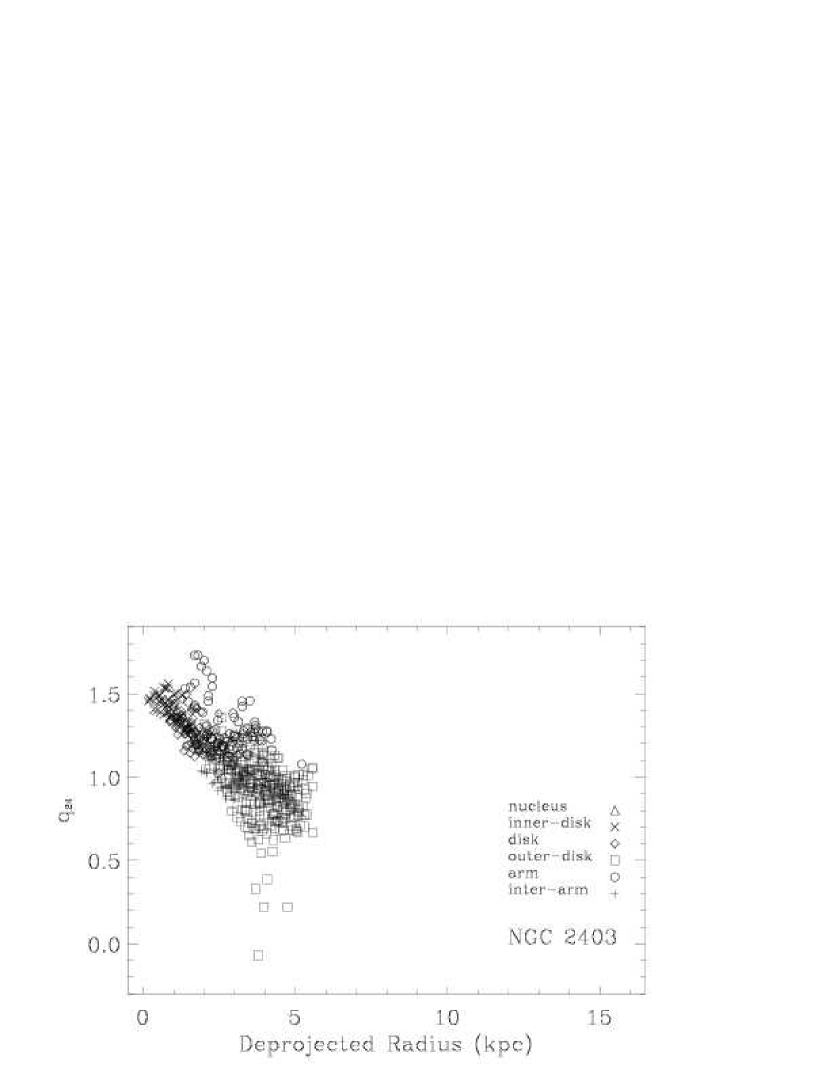
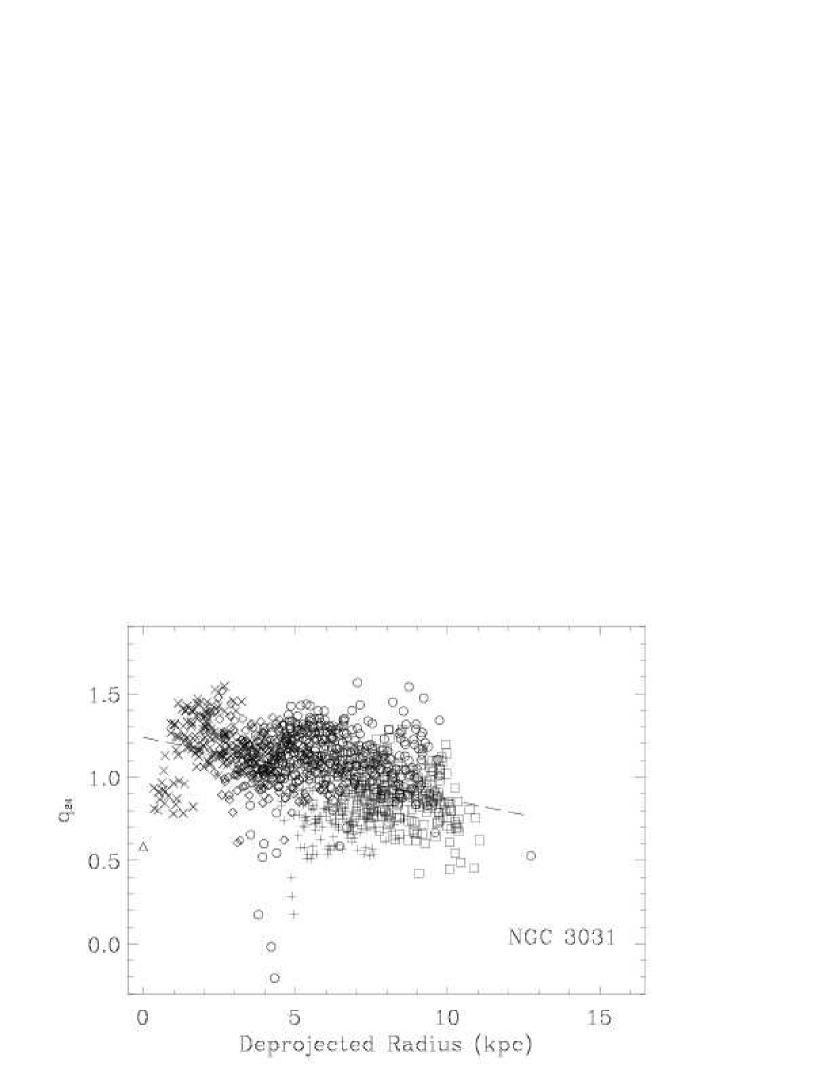
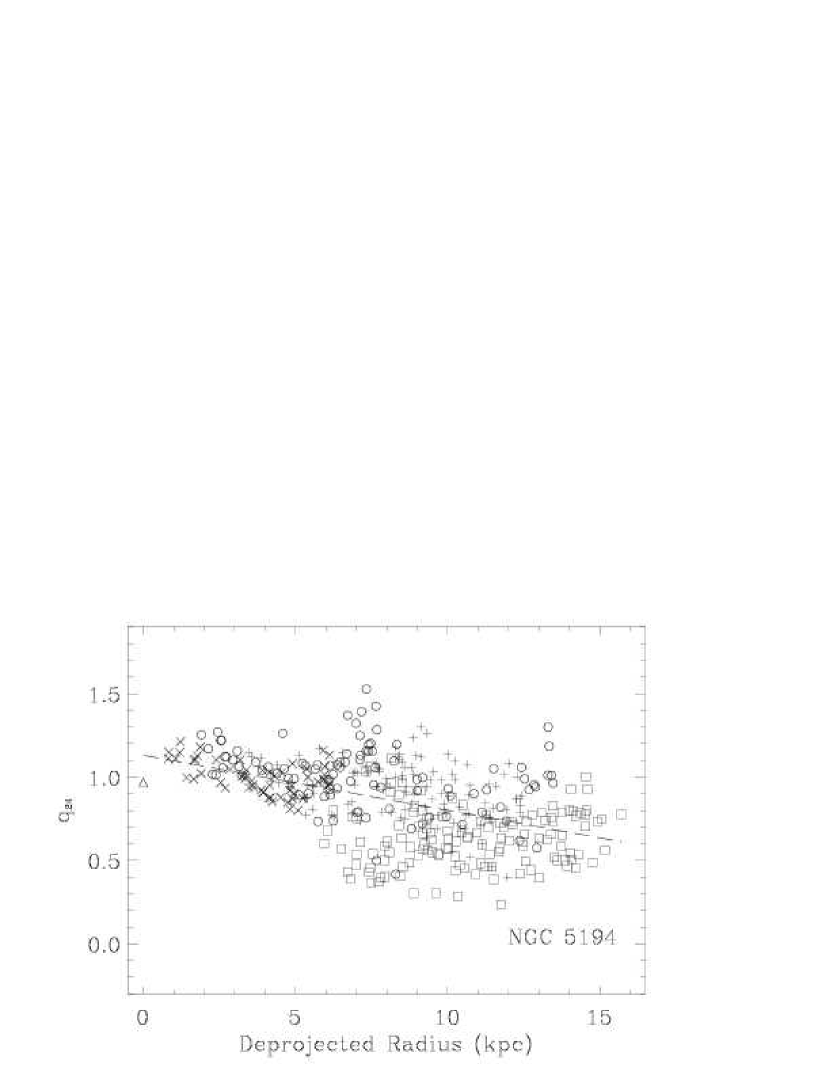
3.4 Radial Trends
We identify any radial trends which might exist for and in Figures 6 and 7, respectively. For each galaxy in our sample, there is an obvious trend of decreasing and ratios with increasing galactocentric radius. A similar trend was also found by Bicay & Helou (1990) who, using IRAS scan data, observed a decrease in 60 to 20 cm ratios with increasing radius. This result can be characterized by smaller scale-lengths for the infrared disks than the radio disks.
What we find in Figures 6 and 7 is a slight trend of increasing dispersion in the infrared/radio ratios with radius. The only exceptions are for NGC 2403 at 24 , and NGC 3031, in which the dispersion is large in the circumnuclear region due a combination of the central AGN and the non-Gaussian MIPS PSF. We also note that NGC 3031 displays anomalously low infrared/radio ratios for a few apertures at a radius of 4 kpc because of SN 1993J. This trend of increasing dispersion in and with radius does not seem to be an artifact of lower signal-to-noise at larger radii as the general appearance of Figures 6 and 7 persists even when we increased the detection threshold from 3 to 6 . We also find that the dispersion in and at constant radius is much larger than at constant surface brightness. To quantify this, we computed the dispersion in 1 kpc and 1.5 Jy bins about the median radius and flux density, respectively, and find that the dispersion in and is larger at constant radius than at constant surface brightness by an average of 0.1 dex. By moving farther out radially into the disks of galaxies two effects occur. There is a general drop in the disk surface brightness coupled with a drop in the H II region density. These two effects likely drive the increase in scatter for and ratios with radius and is the reason that there is a more firm correlation between infrared/radio ratio with surface brightness than with radius. This suggests that the distribution of star formation sites within the disk is more important in determining the overall appearance of the infrared/radio disk maps than the underlying exponential disk elements, such as the ISM mass distribution and the older stellar population of galaxies.
4 Discussion
4.1 Infrared/Radio Relations Inside and Among Galaxies
The goal of this study is to improve our understanding of the physical processes governing the FIR-radio correlation. Accordingly, we compare the results of global FIR-radio studies with local (kpc scale) FIR-radio studies. Identifying similarities and differences in the observed trends between local and global studies can help to constrain the physical scales and associated processes responsible for the FIR-radio correlation.
4.1.1 Relating IRAS to Spitzer
Since most of the previous work on the FIR-radio correlation has been done using IRAS data, we had to convert IRAS 60 flux densities to the nearby Spitzer 70 flux densities for comparison. In order to convert IRAS 60 to Spitzer 70 flux densities used IRAS 60/100 flux density ratios along with the SED models of Dale & Helou (2002). The models allow for IRAS 60/100 flux density ratios in the range of 0.2847 to 1.635 corresponding to a range in Spitzer 70/IRAS 60 flux density ratios between 0.9585 and 1.568. This relation between Spitzer to IRAS and flux densities is approximated by
| (3) |
where . We derived these coefficients using a singular value decomposition solution to an overdetermined set of linear equations as described in 15.4 of Press et al. (2002).
4.1.2 Comparison with Global Infrared/Radio Ratios
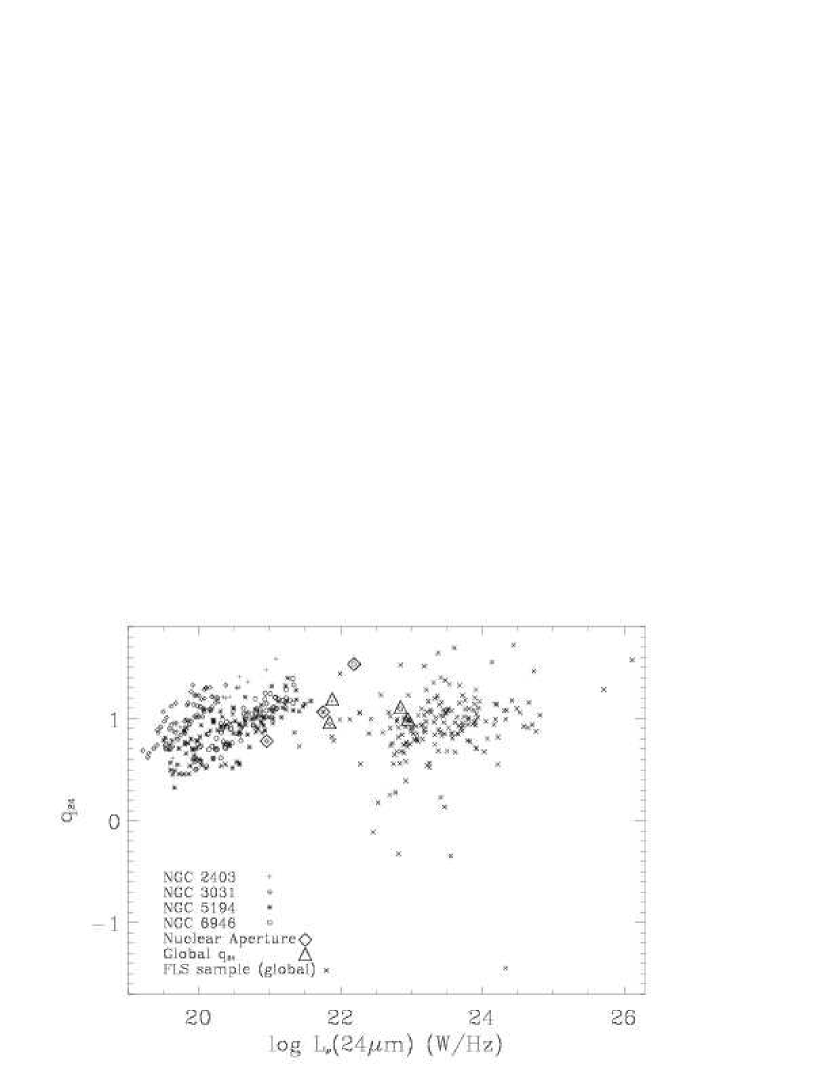
For a comparison of our results to previous global FIR-radio correlation data, we made use of IRAS and NRAO VLA Sky Survey (NVSS; Condon, et al. (1998)) data collected for a sample of 1809 galaxies by Yun, Reddy, & Condon (2001). Of these 1809 galaxies, 1752 had IRAS 60/100 flux density ratios compatible with the range of Dale & Helou (2002) SED models, and for this sub-sample we converted the observed IRAS 60 flux densities into estimated Spitzer 70 flux densities (see 4.1.1). Using the 1.4 GHz NVSS data and estimated distances to the sources (Yun, Reddy, & Condon , 2001), we plot global infrared/radio ratios along with our local infrared/radio ratios for 1.5 kpc diameter apertures versus luminosity in the top portion of Figure 8. Although the NVSS is a snapshot survey, and is therefore prone to miss extended emission from galaxies having large angular extents, Yun, Reddy, & Condon (2001) pay proper attention to these effects and derive unbiased 1.4 GHz fluxes. It should be noted that this sample, however, has been found to contain both confused IRAS measurements and AGN missed by automated procedures, which are not expected to obey the FIR-radio correlation. We also compare our results within galaxies to global ratios from data obtained as part of the Spitzer First Look Survey (FLS) in the bottom portion of Figure 8. A total of 179 sources are plotted using 24 and VLA 1.4 GHz measurements which have been -corrected using an SED-fitting method as described in Appleton et al. (2004). Objects having a value well below 0 are likely to be galaxies hosting an AGN and are not expected to follow any correlation found in our aperture work within galaxies.
In Table 5 we list the mean and standard deviation of and found within and among galaxies, as well as the number of measurements used to calculate each. In this comparison we present all data points including the few outliers in each sample. For our four sample galaxies, the local dispersions in and are nearly identical. The dispersion in the kpc scale ratios is comparable to what is measured globally, but the dispersion in the global ratios is 0.13 dex higher than what is measured within galaxies. This increase in dispersion may be due to sample selection as the FLS contains galaxies at 1, while the Yun, Reddy, & Condon (2001) sample contains objects only up to 0.15. Samples at higher redshifts will likely include a larger number of AGN and perhaps less evolved galaxy disks compared to samples limited to lower redshifts, and both effects may increase the dispersion.
In both panels of Figure 8 the global infrared/radio ratios of our sample galaxies appear to be slightly higher than the median of the corresponding local kpc-scale values. This offset is not statistically significant, as the global value is never greater than the median by more than 1 , and likely due to the brightest regions in galaxies contributing a large fraction of the global flux. What clearly appears as a significant difference between the local and global infrared/radio ratios is the behavior of versus increasing luminosity. In both the FLS and Yun, Reddy, & Condon (2001) samples the infrared/radio ratios are roughly constant with increasing galaxy luminosity while, within each disk, the infrared/radio ratios clearly increase with luminosity. We will see in 4.2.2 that the difference in versus luminosity within and among galaxies is likely due to the diffusion of CR within the galaxy disks. Although we do not see a strong non-linearity in either sample of global infrared/radio ratios, we note that a non-linearity in the global FIR-radio correlation is known to exist. However, this trend in global FIR/radio ratios is the opposite of what we find on kpc scales within galaxies, which is that galaxies with low FIR luminosities have radio luminosities lower than expected from a linear fit to the correlation (Fitt, Alexander, & Cox , 1988; Cox et al. , 1988; Condon, Anderson, & Helou , 1991).
4.2 Cosmic Ray Diffusion
4.2.1 Image-Smearing Model Technique
The phenomenological image-smearing model of Bicay & Helou (1990) predicts that the radio morphology of a galaxy can be reproduced by convolving the FIR image with a specific smearing kernel, , containing the diffusion information of the galaxy’s cosmic ray electrons (CRs). As previous work relied on IRAS maps made using the maximum correlation method (MCM), described by Auman, Fowler, & Melnyk (1990), to achieve ’super’-resolution of (i.e. Marsh & Helou (1998)), it is worth repeating this analysis using the current Spitzer maps obtained at the natural resolution of the instruments. We performed a simple image-smearing analysis for both the Spitzer 24 and 70 data and look for a preference among Gaussian and exponential smearing kernels projected either in the plane of the sky or in the plane of the galactic disk. The choice of Gaussian and exponential kernels are due to their differences in describing the diffusion and confinement characteristics of CRs. Gaussian kernels suggest a simple random walk diffusion scenario for CRs in each disk. Exponential kernels, having broader tails than Gaussian kernels of the same scale-length, are suggestive of CR escape on time scales less than or comparable to the diffusion time scales, and correspond to empirical “leaky box” models (Bicay & Helou , 1990).
The kernel, , is a function of a two-dimensional angular position vector with magnitude , where and are the right ascension and declination offsets on the sky. Let and denote the observed radio and infrared images respectively. Let us denote the type of function and projection of the parameterized kernel by the subscripts such that Gaussian (G) and exponential (e) kernels projected in the plane of the galaxy (g), , take the form of and , respectively where
| (4) |
The quantities and are the inclination, where defines a face-on projection, and position angle of the tilt axis of the galactic disk measured East of North, respectively, and is the -folding length of the smearing kernel. When the kernels are oriented in the plane of the sky (s), denoted as , both and are equal to 0 which sets . We define the quantity,
| (5) |
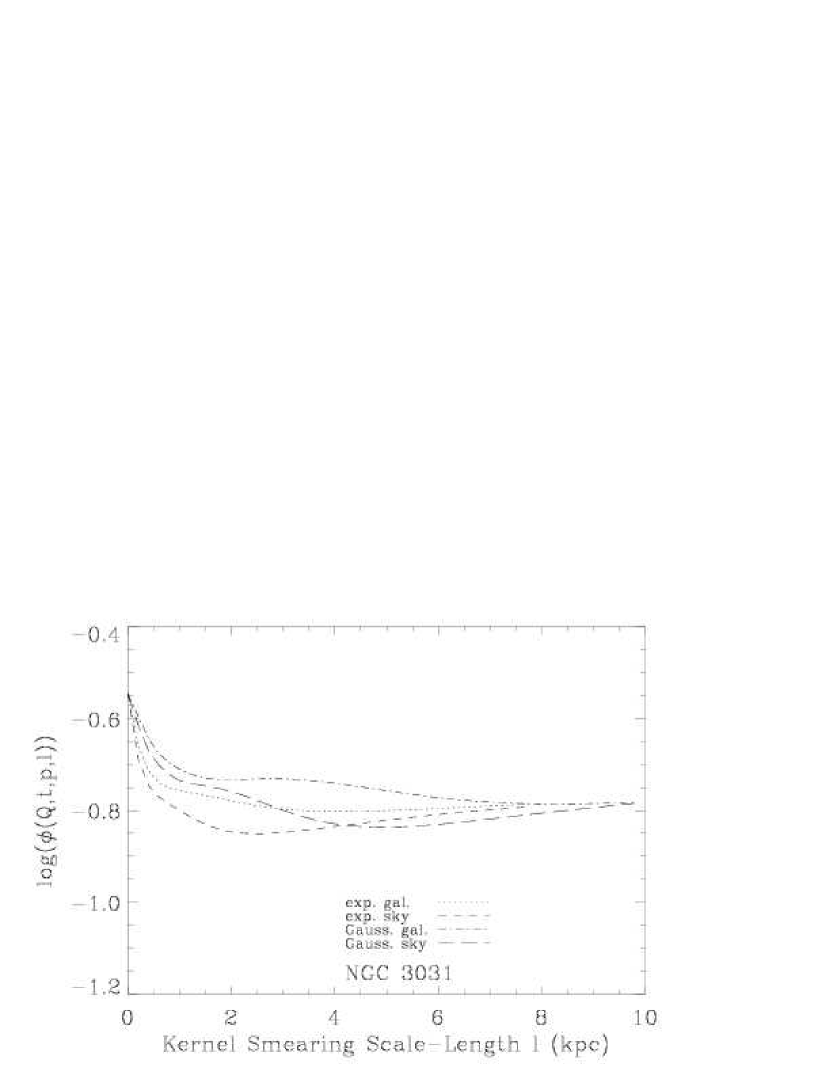
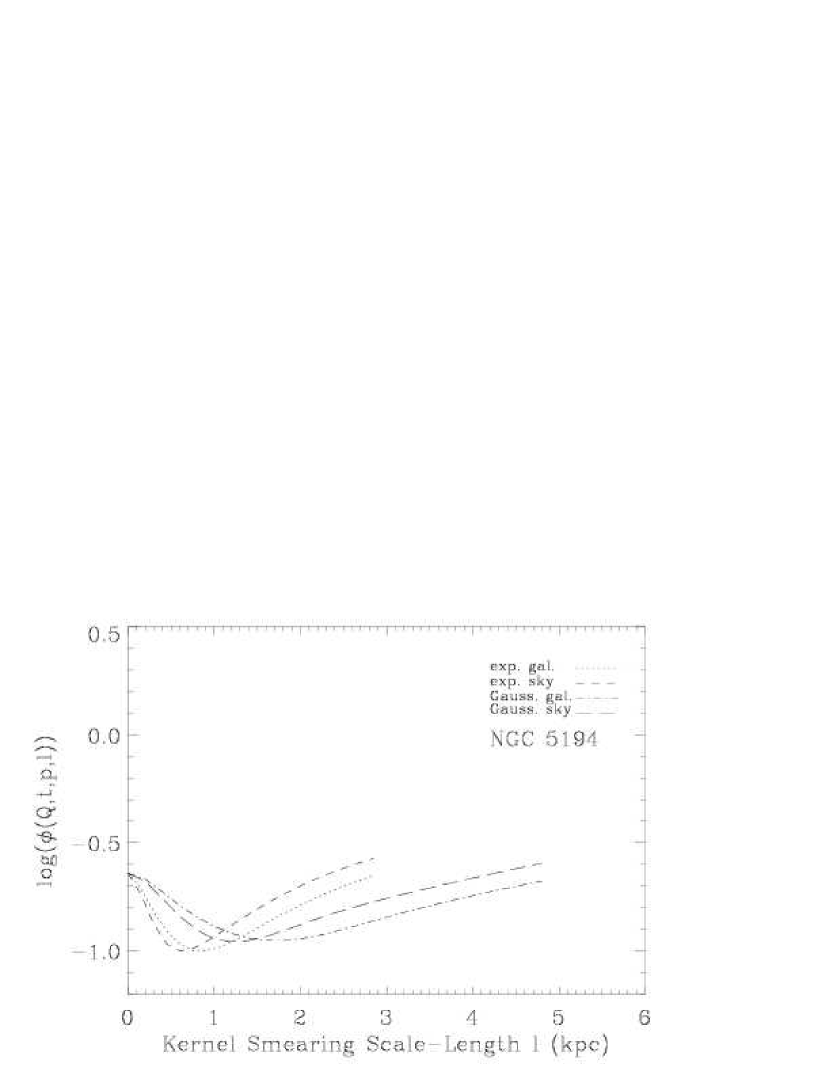
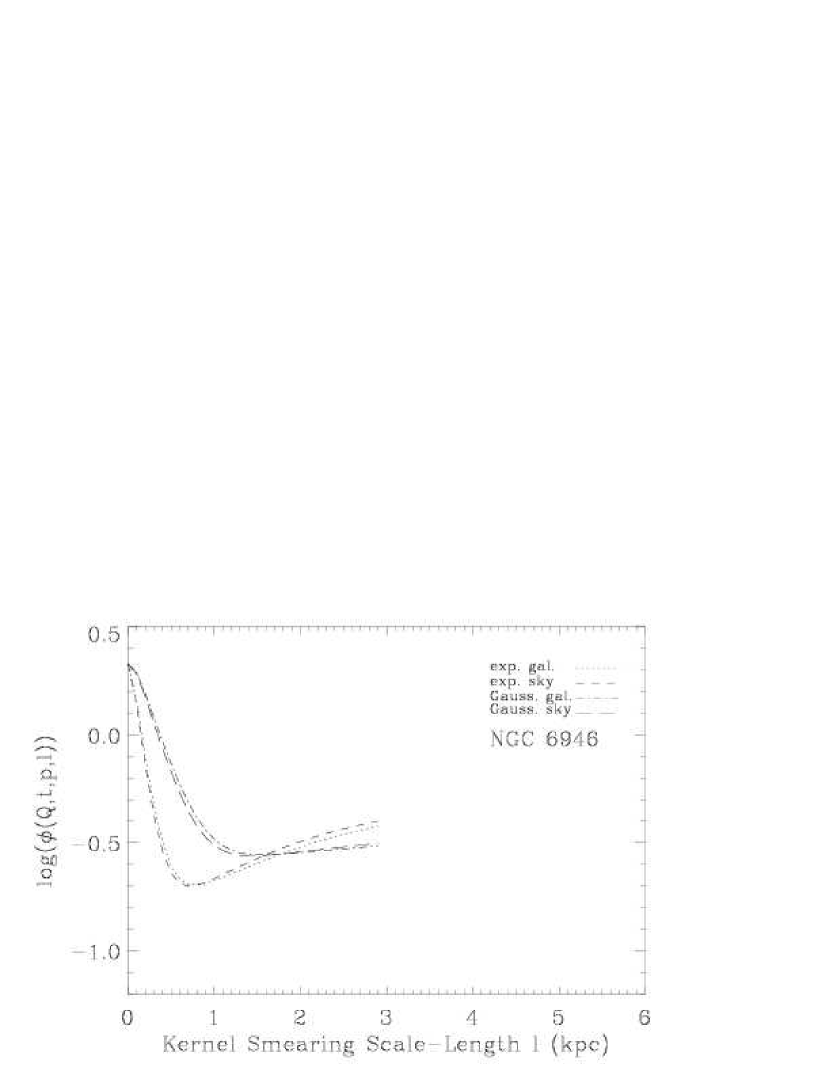
where is used as a normalization factor (i.e. ), represents the infrared image after smearing with kernel of type () having scale length , and the subscript indexes each pixel. This quantity was minimized to determine the best fit smearing kernel for each galaxy in our sample. We normalize by the squared sum of radio flux density to allow for proper comparison of our galaxies which vary in intrinsic surface brightness. Estimation of the residuals was carried out after first removing pixels not detected at the 3 level, and then editing out identifiable contaminating background radio sources and SNe. Because the AGN nucleus of NGC 3031 is also identifiable in the infrared images, it was removed before smearing the infrared images and in the calculation of the residuals. In the case of NGC 5194, its companion galaxy (NGC 5195) was removed before calculating the residuals. We find the best fit kernel by determining the minimum in as a function of smearing scale-length , as shown in Figures 9 and 10. The quantity,
| (6) |
which is the maximum depth of each residual trough, is a measure of how much the correlation is improved by smoothing the infrared image.
Because and characterize the residual behavior for the entire galaxy as single quantities, we also constructed residual maps for the best fit smearing kernels to inspect the spatial variations of the residuals. The residual image is defined as,
| (7) |
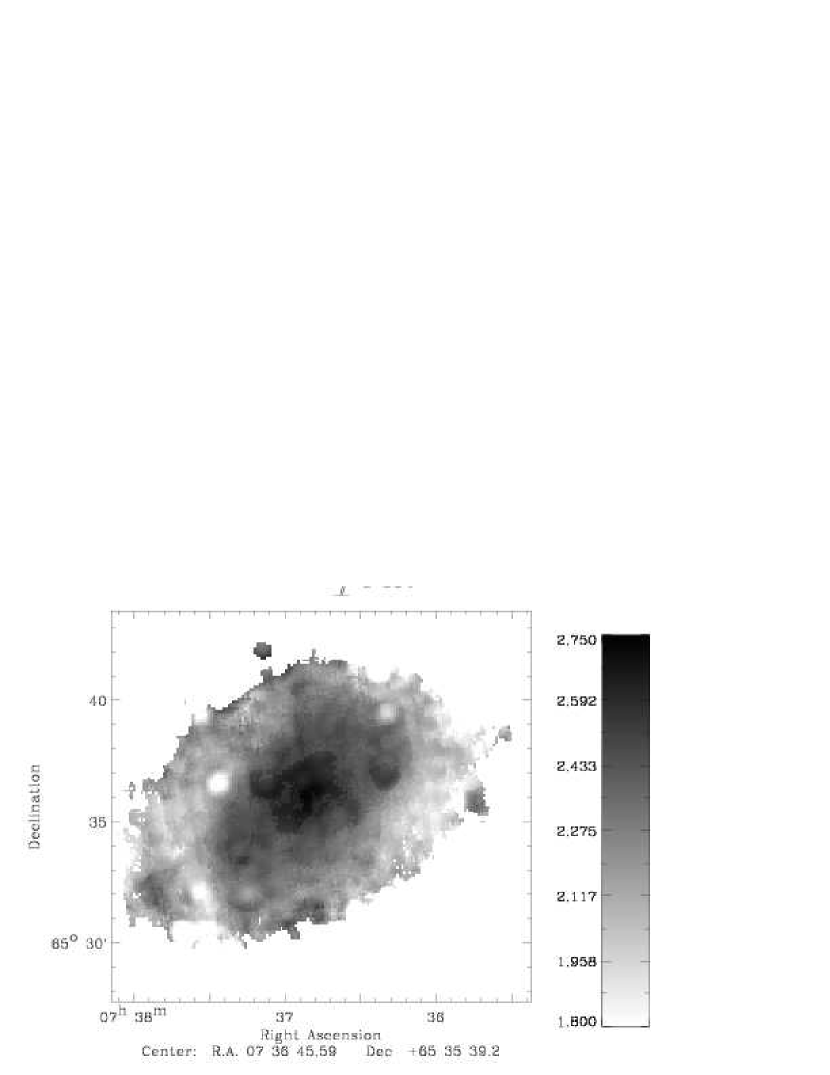
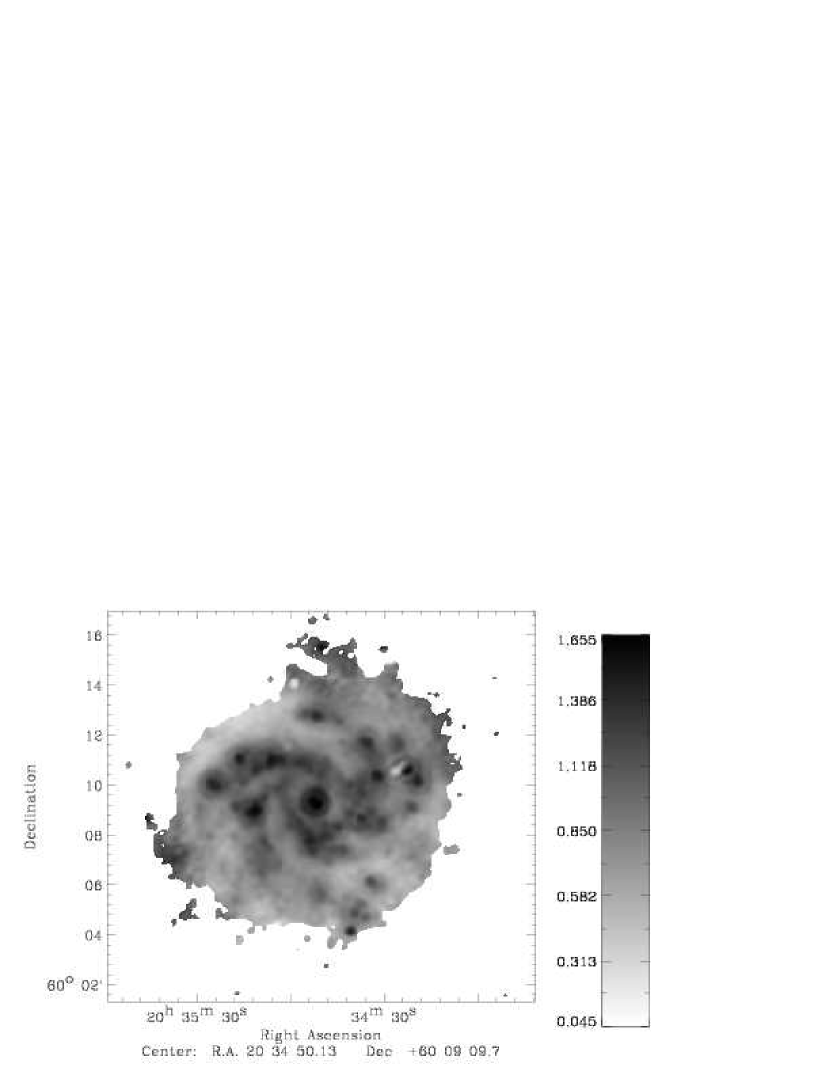
In Figures 11 and 12 we plot residual maps for the best fit exponential kernels oriented in the plane of the sky for the 70 and 24 data, respectively.
Making the assumption that propagation of CRs is symmetric in the plane of the sky, we can crudely attempt to measure the CR diffusion length within each galaxy disk. The infrared images, , might be considered a ’smeared’ version of the distribution of the original sources of infrared luminosity. They are ’smeared’ due to both the heating of dust by UV photons, having a scale-length some hundreds of parsecs away from their originating sources, and the angular resolution of the telescope, having a beam width . Accordingly, the infrared image, , artificially smeared by a kernel having a scale-length , has an effective scale-length of , such that
| (8) |
The radio images are initially ’smeared’ by both the angular resolution of the telescope and propagation of CRs, having a scale-length of , such that the total scale-length of the radio continuum image, is approximated by,
| (9) |
Assuming the smearing model holds, we set and find a general relation between the scale-length of the smearing kernel and the scale-lengths of the UV heating photons and CRs such that,
| (10) |
The scale-length of the best fit smearing kernel is a combination of the CR and UV photon scale-lengths, and we cannot separate their effects with the current data. However, the scale-length of the CRs is probably significantly larger than that for the UV photons (e.g. Helou & Bicay (1993)), and therefore is the dominant term in the scale-length of the best fit smearing kernel. Once we have determined the best fit smearing kernels, we use the corresponding smeared infrared maps to perform the same aperture photometry as described in 2.4 to calculate the mean and dispersion in on sub-kpc scales within each galaxy. The smearing kernel scale-lengths (), , and dispersion in are given in Table 6 for each galaxy and kernel type.
4.2.2 Image-Smearing Model Results
We look to see whether the image-smearing model works to significantly improve the correlation between the infrared and radio morphologies of galaxies. Determining the functional form and scale-length of the best fit smearing kernel provides insight into the propagation and diffusion characteristics of cosmic rays within galaxy disks.
An examination of Figures 9 and 10 shows that the the image-smearing technique improves the overall correlation between the radio maps and the 70 and 24 images by an average of 0.2 and 0.6 dex in , respectively. Even though the infrared wavelengths being studied trace two different temperature regimes and grain species, we find similar preferences in kernels for both the smeared 70 and 24 images. We find exponential kernels are preferred independent of projection, since they have values at least 0.04 dex larger than those from Gaussian kernels. This result differs from Marsh & Helou (1998), who found Gaussian and exponential kernels to work equally well, but is consistent with Bicay & Helou (1990). Since Gaussian kernels describe a simple random-walk diffusion for CRs, additional processes such as escape and decay appear necessary to describe the evolution of CRs through the galaxy disks, as was suggested by Bicay & Helou (1990). Each galaxy displays a marginal difference between exponential kernels oriented in the plane of the sky and those oriented in the plane of the galaxy. This poor discrimination for kernel projections is not surprising due to the low inclination of these face-on targets.
We choose to only present residual maps for exponential kernels oriented in the plane of the sky (Figures 11 and 12) since this kernel typically had the largest value of for each galaxy. Residual images for the other kernels appear very similar. It is obvious from the residual maps that a simple symmetric function cannot properly fit each part of the galaxy as arm, inter-arm, and individual giant H II regions strongly deviate from having zero residuals. However, the residuals in Figures 11 and 12, show two distinct and opposite trends. In the more active star-forming galaxies (NGC 5194 and NGC 6946: SFR 4 M☉/yr) we see that star-forming regions (i.e. arms) have residuals with infrared excesses while inter-arm and outer-disk regions display residuals having radio excesses. For the two less active star-forming galaxies (NGC 2403 and NGC 3031: SFR 1 M☉/yr), star-forming regions in the disk display radio excesses while the inter-arm and outer-disk regions generally have infrared excesses. Because the less active star-forming galaxies have larger smearing scale-lengths, the bright star-forming regions that appear in the infrared images of these galaxies are over-smoothed. This over-smoothing of the star-forming regions redistributes a larger amount of flux into the more quiescent parts of the galaxy disks than is needed to match what is observed in the radio image. The larger scale-lengths and over-smoothing of discrete star-forming sites in these less active star-forming galaxies may be due to the diffuse emission dominating the appearance of the disk. We propose that the relative paucity of H II regions translates into a deficit of recent CR injection into the ISM, and a longer effective timescale for CR diffusion. While this picture is self-consistent and accounts for the data on the four sample galaxies, further tests are required to ascertain its applicability outside of this small sample of galaxies.
The CR scale-lengths for the exponential kernels oriented in the plane of the sky range from a few hundred parsecs to a couple kpc. Three out of the four galaxies have smearing scale-lengths for the 70 maps that are smaller than what is found for the 24 maps by a couple hundred parsecs. This result is not surprising since the 24 emission is associated with hotter dust, and is more centrally peaked around bright star-forming regions than the 70 emission. The exception is NGC 3031 which does not have well determined scale-lengths, perhaps because the galaxy is mainly quiescent and lacks a large number of luminous star-forming regions for the size of its disk, so the majority of the 24 emission is as diffuse as the 70 emission. While the smearing scale-lengths at 70 and 24 for NGC 3031 are not well determined, those for NGC 2403 do seem relatively well determined even though both galaxies have similar star formation rate surface densities. A comparison of HII region luminosity functions shows that NGC 3031 has fewer high luminosity H II regions than NGC 2403 (Petit, Sivan, & Karachentsev , 1988; Sivan et al. , 1990), which may account for this difference.
The dispersion across each disk is found to be lower by at least 0.04 dex using the smeared infrared images to construct the infrared/radio ratio maps, except for NGC 3031, which is probably due to the inclusion of its AGN in calculating the dispersion. We also find that the slopes in the and versus infrared surface brightness relations are, on average, factors of 2 and 1.5 times smaller, respectively, when using the smeared infrared images. Accordingly, this reduction in slope improves the linearity of . Since this non-linearity within disks is suppressed by smearing the infrared images, it may well be a result of the diffusion of CR away from star-forming sites. In this case, such a non-linearity should not be found in the global correlation when integrating the flux over entire galaxies, which is indeed what is observed in Figure 8.
Assuming that the differences between the radio and infrared distributions are due to the diffusion to CRs, we can relate the best fit smearing scale-lengths to the mean ages of the CR populations of each galaxy. Comparing the shapes of the residual curves in Figures 9 and 10 for each galaxy, we find quite distinct behaviors between our two more active star-forming galaxies (NGC 5194 and NGC 6946) and our two less active star-forming galaxies (NGC 2403 and NGC 3031). The curves for NGC 5194 and NGC 6946 have clearly defined minima for each kernel type. In contrast, the curves in NGC 2403 and NGC 3031 are less well behaved, with the initial decrease in residuals being less smooth and, in the case of NGC 2403 at 70 , displaying clearly defined first and second minima having scale-lengths greater and less than 1 kpc. We speculate that the double-minimum behavior, especially present for NGC 2403 in Figure 9, results from a superposition of two populations of CRs: those from an older episode of star formation, now associated with the diffuse radio disk, and those from a more recent episode of star formation, associated with the prominent H II regions. We also speculate that NGC 2403 has gone through a period of relative quiescence between the two episodes of star formation. The relatively small scale-lengths (1 kpc) found in the first minimum of NGC 2403 are consistent with the scale-lengths observed in NGC 6946 and NGC 5194. They correspond to the spreading scale-length values expected in galaxies with typical ISM density 5 cm-3 and CR ages yrs (Helou & Bicay , 1993). These relatively young CRs are thought to have been recently accelerated in star-forming regions. Scale-lengths 1 kpc, however, are expected for older CR which have been diffusing through the ISM for yr. The double-minimum behavior is more apparent in NGC 2403 presumably because of the relative luminosities of the diffuse disk emission compared to the H II regions, and because of the geometry of the star formation sites with respect to the disk.
5 Summary
We present an initial look at the FIR-radio correlation within galaxies using infrared and radio data taken as part of the Spitzer Infrared Nearby Galaxies Survey (SINGS) and the parallel WSRT SINGS project. We report on four of the most nearby objects in our sample, allowing us to probe physical scales down to 0.3 kpc, for a 17 beam, and analyze the variations in the logarithmic ratios of 70 and 24 dust emission to 22 cm radio continuum emission.
We have also performed preliminary modeling of CR diffusion using the image-smearing technique of Bicay & Helou (1990). We find that this phenomenological model of smoothing the infrared maps to match the morphology of the radio maps does indeed improve the correlation. This model relies on the fact that CRs emit synchrotron radiation as they diffuse away from the same star-forming regions that heat dust, effectively creating a smoother version of the infrared image at radio wavelengths. Characterizing the optimal smoothing kernel for the infrared map provides insight into the evolution of the CRs, including an estimate of their diffusion scale-lengths. In our image-smearing analysis we have tested the differences between Gaussian and exponential smoothing kernels, oriented in the planes of the galaxy and sky, on the 70 and 24 maps of each galaxy.
As emission from 70 and 24 probe different grain populations, the variations in the logarithmic 70 /22 cm () and 24 /22 cm () surface brightness ratios across each galaxy disk are not identical. From comparisons of the and behavior within our sample, along with our image-smearing analysis, we find the following:
-
1.
and generally decrease with declining surface brightness and increasing radius. However, the dispersion measured in and at constant surface brightness is found to be smaller than at constant radius by 0.1 dex suggesting that the distribution of star formation sites is more important in determining the infrared/radio disk appearance than the underlying exponential disk elements, such as the ISM mass distribution and the older stellar population.
-
2.
The ratio-maps are more strongly peaked on star-forming regions than the ratio maps at matching resolution and, consequently, the dispersion in for each disk is generally smaller (0.03 dex) than what is found for , except in the case of NGC 3031. This is consistent with the 24 emission being more closely correlated spatially with sites of active star formation than the cooler 70 dust emission, as was found by Calzetti et al. (2005) and Helou et al. (2004).
-
3.
The ratio of FIR (42-122 ) to radio emission within galaxies displays less scatter than the monochromatic and ratios at matching resolution. However, the dispersion in is never more than 0.03 dex larger than the dispersion in for each galaxy.
-
4.
The dispersion in the global FIR-radio correlation is comparable to the dispersion measured in and within the galaxy disks on 1.5 kpc scales. Also, the trend of increasing infrared/radio ratio with increasing infrared luminosity within each galaxy is not observed in the global correlation probably due to the diffusion of cosmic ray electrons.
-
5.
The phenomenological modeling of cosmic ray electron (CR) diffusion using an image-smearing technique is successful, as it both decreases the measured dispersion in and by an average of 0.05 dex, and reduces the slopes in the and versus infrared surface brightness relations, on average, by a factor of 1.75. This reduction in slope suggests that the non-linearity in within galaxies may be due to the diffusion of CRs from star-forming regions.
-
6.
The image-smearing models with exponential kernels work marginally better to tighten the correlation between the radio and infrared maps than Gaussian kernels, independent of projection. This result suggests that CR evolution is not well described by random-walk diffusion in three dimensions alone and requires additional processes such as escape and decay.
-
7.
Using a simple symmetric smearing kernel to smooth the infrared image does not provide a perfect fit to the radio continuum image, and leaves organized structures such as arms and H II regions still visible. Our two less active star-forming galaxies display radio excesses around star-forming regions in their residual maps while our two more active galaxies have infrared excesses around star-forming arms. This difference in the appearance of the residual maps may be due to time-scale effects in which there has been a deficit of recent CR injection into the ISM in the two less active star-forming galaxies, thus leaving the underlying diffuse disk as the dominant structure in the morphology.
References
- Appleton et al. (2004) Appleton, et al. 2004, ApJS, 154, 147
- Auman, Fowler, & Melnyk (1990) Aumann, H. H., Fowler, J. W., and Melnyk, M., 1990, AJ, 99, 1674
- Beck & Golla (1988) Beck, R. and Golla, G. 1988, A&A, 191, L9
- Becker, White, & Helfand (1995) Becker, R. H., White, R. L., and Helfand, D. J. 1995, ApJ, 450, 559
- Bell (2003) Bell, E. F. 2003, ApJ, 586, 794
- Bicay & Helou (1990) Bicay M. D. and Helou, G. 1990, ApJ, 362, 59
- Boulanger & Pérault (1988) Boulanger, F. and Pérault, M. 1988, AJ, 96, 877
- Bressan, Silva, & Granato (2002) Bressan, A., Silva, L., and Granato, G. L. 2002, A&A, 392, 377
- Calzetti et al. (2005) Calzetti, D., et al. 2005, ApJ, in press (astro-ph/0507427)
- Condon, Anderson, & Helou (1991) Condon, J. J., Anderson, M. L., and Helou, G. 1991, ApJ, 376, 95
- Condon, et al. (1998) Condon, J. J., et al. 1998, AJ, 115, 1693
- Cox et al. (1988) Cox, M. J., Eales, S. A. E., Alexander, P., and Fitt, A. J. 1988, MNRAS, 235, 1227
- Dale & Helou (2002) Dale, D. A. and Helou, G. 2002, ApJ, 576, 159
- de Jong et al. (1985) de Jong, T., Klein, U., Wielebinski, R., and Wunderlich, E. 1985, A&A, 147, L6
- Fitt, Alexander, & Cox (1988) Fitt, A. J., Alexander, P., and Cox, M. J. 1988, MNRAS, 233, 907
- Gordon et al. (2005) Gordon, K. D., et al. 2005, PASP, 117, 503
- Gordon et al. (2004) Gordon, K. D., et al. 2004,ApJS, 154, 215
- Harwit & Pacini (1975) Harwit, H, and Pacini, F 1975, ApJ, 200, L127
- Helou & Bicay (1993) Helou, G. and Bicay, M. D. 1993, ApJ, 415, 93
- Helou, Soifer, & Rowan-Robinson (1985) Helou, G., Soifer, B. T., and Rowan-Robinson, M. 1985, ApJ, 298, L7
- Helou et al. (2004) Helou, G., et al. 2004, ApJS, 154, 253
- Hinz et al. (2004) Hinz, J. L., et al. 2004, ApJS, 154, 259
- Hippelein et al. (2003) Hippelein, H., Haas, M., Tuffs, R. J., Lemke, D., Stickel, M., Klaas, U., and Völk, H. J. 2003, A&A, 407, 137
- Hoernes, Berkhuijsen, & Xu (1998) Hoernes, P., Berkhuijsen, E. M., and Xu, C. 1998, A&A, 334, 57
- Hopkins et al. (2002) Hopkins, A. M., Afonso, J., Chan, B., Cram, L. E., Georgakakis, A., and Mobasher, B. 2003, AJ, 125, 465
- Kennicutt et al. (2003) Kennicutt, R. C. Jr., et al. 2003, PASP, 115, 928
- Marsh & Helou (1995) Marsh, K. A. and Helou, G. 1995, ApJ, 445, 599
- Marsh & Helou (1998) Marsh, K. A. and Helou, G. 1998, ApJ, 493, 121
- Neugebauer, et al (1984) Neugebauer, G. et al. 1984, ApJ, 278, L1
- Niklas & Beck (1997) Niklas, S. and Beck, R. 1997, A&A, 322, 29
- Petit, Sivan, & Karachentsev (1988) Petit, H., Sivan, J.-P, and Karachentsev, I. D. 1988, A&AS, 74, 475
- Press et al. (2002) Press, W. H., Teukolsky, S. A., Vetterling, W. T., and Glanner, B. P. 2002, in Numerical Recipes in C++ (2d ed.; Cambridge: Cambridge Univ. Press)
- Regan et al. (2004) Regan, M. W. et al. 2004, ApJS, 154, 204
- Rieke, et al. (2004) Rieke, G. H., et al. 2004, ApJS, 154, 25
- Sivan et al. (1990) Sivan, J.-P., Petit, H., Comte, G., and Maucherat, A. J. 1990, A&A, 237, 23
- Völk (1989) Völk H. J. 1989, A&A, 218, 67
- White & Becker (1992) White, R. L. and Becker, R. H. 1992, ApJS, 79, 331
- Xu et al. (1992) Xu, C., Klein, U., Meinert, D., Wielebinski, R., and Haynes, R. F. 1992, A&A, 257, 47
- Yun, Reddy, & Condon (2001) Yun, M. S., Reddy, N. A., and Condon, J. J. 2001, ApJ, 554, 803
| R.A. | Decl. | Dist. | PA | SFR | |||||||
|---|---|---|---|---|---|---|---|---|---|---|---|
| Galaxy | (J2000) | (J2000) | (arcmin) | Type | Nuc. | (km s-1) | (Mpc) | () | () | (M☉/yr) | |
| (1) | (2) | (3) | (4) | (5) | (6) | (7) | (8) | (9) | (10) | (11) | (12) |
| NGC 2403 | 7 36 51.4 | +65 36 09 | 21.912.3 | SABcd | H II | 131 | 3.5 | 57 | 127 | 0.77 | 2.50 |
| NGC 3031 | 9 55 33.2 | +69 03 55 | 26.914.1 | SAab | Lin | -34 | 3.5 | 60 | 157 | 0.86 | 2.45 |
| NGC 5194 | 13 29 52.7 | +47 11 43 | 11.26.9 | SABbc | H II/Sy2 | 463 | 8.2 | 53 | 163 | 6.1 | 2.09 |
| NGC 6946 | 20 34 52.3 | +60 09 14 | 11.59.8 | SABcd | H II | 48 | 5.5 | 32 | 69 | 4.1 | 2.28 |
Note. — Col. (1): ID. Col. (2): The right ascension in the J2000.0 epoch. Col. (3): The declination in the J2000.0 epoch. Col. (4): Major- and minor-axis diameters. Col. (5): RC3 type. Col. (6): Nuclear type: H II: H II region; Lin: LINER; Sy: Seyfert (1, 2). Col. (7): Heliocentric velocity. Col. (8): Flow-corrected distance in Mpc, for = 70 km s-1 Mpc-1 (Kennicutt et al. , 2003). Col. (9): Inclination in degrees. Col. (10): Position Angle in degrees. Col. (11): IRAS based star formation rate (SFR) (Bell , 2003). Col (12): (Helou, Soifer, & Rowan-Robinson , 1985).
| Galaxy | 160 | 70 | 24 | 24 a | 22 cm |
|---|---|---|---|---|---|
| MJy/sr | MJy/sr | MJy/sr | MJy/sr | Jy/beam | |
| NGC 2403 | 0.61 | 0.35 | 0.044 | 0.0085 | 26 |
| NGC 3031 | 0.96 | 0.37 | 0.042 | 0.011 | 24b |
| NGC 5194 | 0.94 | 0.43 | 0.044 | 0.019 | 29 |
| NGC 6946 | 1.4 | 0.58 | 0.068 | 0.029 | 37 |
Note. — (a) 24 map convolved to match the 70 PSF. ( RMS measurement based on a 20 cm radio map.
| Nucleus | Inner-Disk | Disk | Outer-Disk | Arm | Inter-Arm | Total | |
|---|---|---|---|---|---|---|---|
| NGC 2403 | |||||||
| 2.56 | 2.43 | 2.08 | 2.40 | 2.24 | 2.24 | ||
| 0.05 | 0.07 | 0.18 | 0.08 | 0.13 | 0.22 | ||
| 1.42 | 1.28 | 0.90 | 1.27 | 1.06 | 1.08 | ||
| 0.08 | 0.10 | 0.18 | 0.16 | 0.10 | 0.24 | ||
| NGC 3031 | |||||||
| 1.31 | 2.44 | 2.34 | 2.07 | 2.29 | 1.91 | 2.20 | |
| 0.26 | 0.18 | 0.14 | 0.19 | 0.14 | 0.25 | ||
| 0.58 | 1.20 | 1.12 | 0.90 | 1.11 | 0.78 | 1.02 | |
| 0.18 | 0.16 | 0.16 | 0.19 | 0.15 | 0.22 | ||
| NGC 5194 | |||||||
| 1.94 | 1.99 | 1.74 | 2.02 | 1.95 | 1.90 | ||
| 0.09 | 0.17 | 0.17 | 0.17 | 0.20 | |||
| 0.97 | 1.00 | 0.63 | 1.01 | 0.91 | 0.86 | ||
| 0.10 | 0.17 | 0.20 | 0.16 | 0.23 | |||
| NGC 6946 | |||||||
| 2.13 | 2.19 | 2.02 | 1.81 | 2.11 | 1.86 | 1.94 | |
| 0.05 | 0.09 | 0.15 | 0.16 | 0.16 | 0.20 | ||
| 1.62 | 1.39 | 1.11 | 0.77 | 1.13 | 0.87 | 0.95 | |
| 0.09 | 0.08 | 0.16 | 0.15 | 0.17 | 0.23 | ||
| Galaxy | |||
|---|---|---|---|
| NGC 2403 | 0.21 | 0.17 | 0.15 |
| NGC 3031 | 0.18 | 0.19 | 0.16 |
| NGC 5194 | 0.16 | 0.12 | 0.11 |
| NGC 6946 | 0.18 | 0.14 | 0.12 |
Note. — Dispersions () were calculated for , , and within each galaxy disk using apertures having projected diameters of 1.5 kpc.
| N | N | |||||
|---|---|---|---|---|---|---|
| global | 2.30 | 0.27 | 1752 | 0.92 | 0.35 | 179 |
| within | 2.02 | 0.24 | 282 | 0.95 | 0.23 | 282 |
Note. — Statistics within galaxies using apertures of 1.5 kpc in diameter. The global 70 data was taken from the Yun, Reddy, & Condon (2001) sample and the global 24 data was taken from the Spitzer FLS sample (Appleton et al. , 2004). All data points, including outliers, were used in calculating these statistics for each set of data.
| Galaxy | l | l | l | l | ||||||||
|---|---|---|---|---|---|---|---|---|---|---|---|---|
| Smearing 70 maps | ||||||||||||
| NGC 2403 | 1300 | 0.07 | 0.15 | 900 | 0.08 | 0.15 | 3000 | 0.03 | 0.16 | 2100 | 0.04 | 0.16 |
| NGC 3031 | 4100 | 0.26 | 0.24 | 2500 | 0.31 | 0.23 | 8300 | 0.24 | 0.24 | 4900 | 0.29 | 0.23 |
| NGC 5194 | 700 | 0.27 | 0.16 | 500 | 0.29 | 0.16 | 1400 | 0.24 | 0.16 | 1100 | 0.26 | 0.17 |
| NGC 6946 | 300 | 0.17 | 0.17 | 300 | 0.17 | 0.16 | 500 | 0.11 | 0.18 | 500 | 0.11 | 0.18 |
| Smearing 24 maps (matched to 70 resolution) | ||||||||||||
| NGC 2403 | 1400 | 0.83 | 0.15 | 1000 | 0.81 | 0.16 | 3200 | 0.77 | 0.16 | 2300 | 0.75 | 0.17 |
| NGC 3031 | 1000 | 0.34 | 0.25 | 1500 | 0.33 | 0.24 | 1800 | 0.30 | 0.27 | 4100 | 0.30 | 0.24 |
| NGC 5194 | 900 | 0.36 | 0.17 | 600 | 0.36 | 0.18 | 1700 | 0.31 | 0.19 | 1200 | 0.32 | 0.20 |
| NGC 6946 | 800 | 1.03 | 0.16 | 700 | 1.03 | 0.16 | 1600 | 0.89 | 0.18 | 1400 | 0.89 | 0.18 |
Note. — Scale-length l given in units of parsecs; The newly measured dispersion in () calculated over the same apertures as done for and in Table 3, including the regions which were removed before calculating residuals.


Caption for Figure 1 to be placed horizontally below the rows of maps (along the long edge) of the page.