Methanol masers : Reliable tracers of the early stages of high-mass star formation
Abstract
The GLIMPSE and MSX surveys have been used to examine the mid-infrared properties of a statistically complete sample of 6.7 GHz methanol masers. The GLIMPSE point sources associated with methanol masers are clearly distinguished from the majority, typically having extremely red mid-infrared colors, similar to those expected of low-mass class 0 young stellar objects. The intensity of the GLIMPSE sources associated with methanol masers is typically 4 magnitudes brighter at 8.0 µm than at 3.6 µm. Targeted searches towards GLIMPSE point sources with [3.6]-[4.5] 1.3 and an 8.0 µm magnitude less than 10 will detect more than 80% of class II methanol masers. Many of the methanol masers are associated with sources within infrared dark clouds (IRDC) which are believed to mark regions where high-mass star formation is in its very early stages. The presence of class II methanol masers in a significant fraction of IRDC suggests that high-mass star formation is common in these regions. Different maser species are thought to trace different evolutionary phases of the high-mass star formation process. Comparison of the properties of the GLIMPSE sources associated with class II methanol masers and other maser species shows interesting trends, consistent with class I methanol masers tracing a generally earlier evolutionary phase and OH masers tracing a later evolutionary phase.
1 Introduction
Interstellar masers from a number of molecular species (in particular main-line OH, water and methanol) are known to be associated with high-mass star formation regions. Class II methanol masers are unique amongst these in that they are only observed towards high-mass star formation regions (Minier et al., 2003), in contrast to OH and water masers which are also observed towards other astrophysical objects, such as late-type stars. The strongest methanol masers often show emission in multiple transitions and are projected against ultra-compact Hii regions (e.g. W3(OH), Menten et al., 1992; Sutton et al., 2001). However, the majority of methanol masers only show emission in the 6.7 (and sometimes 12.1 GHz) transition and are not associated with detectable Hii regions (Phillips et al., 1998; Walsh et al., 1998). Recent observations have shown that those sources which do not show centimeter radio continuum emission are associated with millimeter (Pestalozzi et al., 2002) and sub-millimeter (Walsh et al., 2003) sources. They have a spectral energy distribution consistent with them being deeply embedded (Minier et al., 2005) and being associated with a very early phase of the star formation process. Masers are potentially powerful probes of the high-mass star formation process, but an understanding of the environment in which they arise is required before they can be used as such.
Theoretical models of class II methanol masers invoke excitation to the second torsional state from the radiative field of warm dust at sub-millimeter and far-infrared (FIR) wavelengths to explain the high brightness temperatures observed (Sobolev & Deguchi, 1994; Sobolev et al., 1997). Many methanol masers have been discovered in searches towards IRAS sources which meet the Wood & Churchwell (1989) criteria for being ultra-compact Hii regions (e.g. Schutte et al., 1993; van der Walt et al., 1995; Walsh et al., 1997; Slysh et al., 1999; Szymczak et al., 2000). However, in many cases the masers are not directly associated with the IRAS sources, but rather with the larger star formation region. The IRAS satellite had relatively poor angular resolution and suffered well documented problems in the Galactic Plane with saturation and confusion, due to the high density of strong sources. This does not mean that the masers are not associated with FIR sources, but rather that they are not necessarily associated with the strongest source within a given star formation region. So IRAS observations are of little use in determining the properties of the sources responsible for pumping the methanol masers.
There have been a number of subsequent infrared surveys, such as the Midcourse Space Experiment (MSX) and the Two Micron All-Sky Survey (2MASS). MSX undertook a survey of the Galactic Plane at mid-infrared wavelengths, with an angular resolution of 18″. However, this is insufficient angular resolution to be able to resolve individual sources in high-mass star formation regions, which are typically at distances greater than 1 kpc. Hence the MSX sources closest to methanol masers usually have colors consistent with massive young stellar objects (Lumsden et al., 2002), but are typically not directly associated with the masers (Ellingsen, 2005). It is well established that many stars are in binary or higher order multiple systems, and resolving the individual stars in such systems requires angular resolutions significantly better than 1″. However, the overall infrared characteristics of a multiple system will be dominated by the most massive star and it is the properties of this star that will have the primary influence on the masers. Where reference is made to an infrared “source” throughout the paper this includes multiple star systems unresolved at arcsecond resolutions. 2MASS has sufficient angular resolution to be able to resolve the source associated with the maser from others within the cluster star forming environment. However, the longest observing wavelength for 2MASS is only 2.2 µm and the majority of the maser sources are optically thick at near-infrared wavelengths. As for IRAS and MSX, typically the closest 2MASS sources are significantly offset from the maser location and are likely unrelated objects within the larger star formation region (Ellingsen, 2005). There have been a number of near-infrared observations targeted at methanol maser sites (Testi et al., 1998; Walsh et al., 1999; Goedhart et al., 2002), many of the masers have no NIR counterpart, and in other cases the NIR source is offset from the maser location. Typically these nearby sources are extremely red, but, as for the 2MASS associations, it is likely that in most cases they are sources unrelated to the masers within the larger star formation region.
Targeted mid-infrared observations have been made toward a number of methanol masers at wavelengths as long as 20 µm (De Buizer et al., 2000; Walsh et al., 2001). These find mid-infrared sources associated with many of the masers that do not have near-infrared counterparts (67% in the case of De Buizer et al.), but also show that sometimes the sources associated with the methanol masers are optically thick to wavelengths longer than 20 µm, suggesting that they are deeply embedded and very young. The most significant problems with existing ground-based mid-infrared observations is limited sensitivity (e.g. of the order of 15 mJy at 10 µm for De Buizer et al., 2000, and higher in the other cases) and large astrometric uncertainty, due to the lack of guide stars at these wavelengths. This makes it impossible to accurately determine the relative location of the masers and mid-infrared sources, which is particularly important in situations where there are extended, or multiple mid-infrared emission regions. De Buizer et al. (2000) use a method of cross-correlating the centimeter radio continuum and mid-infrared emission to determine the best registration. However, there are significant differences between the emission at the two wavelengths, which means that the relative registration remains uncertain. The astrometry is highly dependent on the telescope and more recent ground-based mid-infrared observations targeted towards water maser sites have been able to achieve sub-arcsecond precision (De Buizer et al., 2005b). Further sensitive mid-infrared observations with good astrometric accuracy are highly desirable, as they will yield important information on the nature of the mid-infrared sources associated with methanol masers.
2 GLIMPSE observations
GLIMPSE (Galactic Legacy Infrared Mid-Plane Survey Extraordinare) is a legacy science program of the Spitzer Space Telescope that surveyed the inner Galactic plane ( = 10°–65°) in a number of mid-infrared wavelength bands at 1.4–1.9″ resolution, using the IRAC (Infrared Array Camera) instrument (Benjamin et al., 2003). The observations were made in the 3.6, 4.5, 5.8 and 8.0 µm bands of IRAC, and the quoted positional accuracy in the point source catalog is approximately 04. As such it provides the best opportunity to date to investigate the mid-infrared properties of a large number of methanol masers, and compare them with other sources. I have used the 15 April 2005 release of the GLIMPSE point source catalog and mosaicked images from the longest wavelength band (8.0 µm) to investigate the mid-infrared properties of the fifty-six methanol masers in the Galactic Longitude range = 325°–335°. The positions of the methanol masers are known to an accuracy of 05 from Australia Telescope Compact Array (ATCA) observations (Ellingsen, 2005). The methanol masers under investigation include a statistically complete sample detected in the Mt Pleasant survey (Ellingsen et al., 1996). In contrast, previous ground based mid-infrared observations have been primarily targeted either at IRAS-associated, or strong maser peak flux density based samples (De Buizer et al., 2000; Walsh et al., 2001).
3 Results
The fifty-six class II methanol masers in the region = 325°–335° are listed in Table 1, along with any GLIMPSE point sources within 2″ of the maser location. Forty-one of these maser sources are part of a statistically complete sample. Those which are not, are indicated in column 1 of Table 1. Three of the sources not within the statistically complete sample (G , G, G) were not detected in the Mt Pleasant survey, but rather in the survey of Caswell (1996), the remainder were detected at Mt Pleasant, but lie outside the spatial or velocity range for which the search is complete (Ellingsen et al., 1996). Twenty-nine of the methanol masers in Table 1 have a GLIMPSE point source within 2″ (52%), considering only the statistically complete sources this becomes twenty-three of forty-one masers (56%). The magnitudes and flux densities observed in each of the 4 IRAC bands for each of the GLIMPSE sources associated with methanol masers are listed in Table 2.
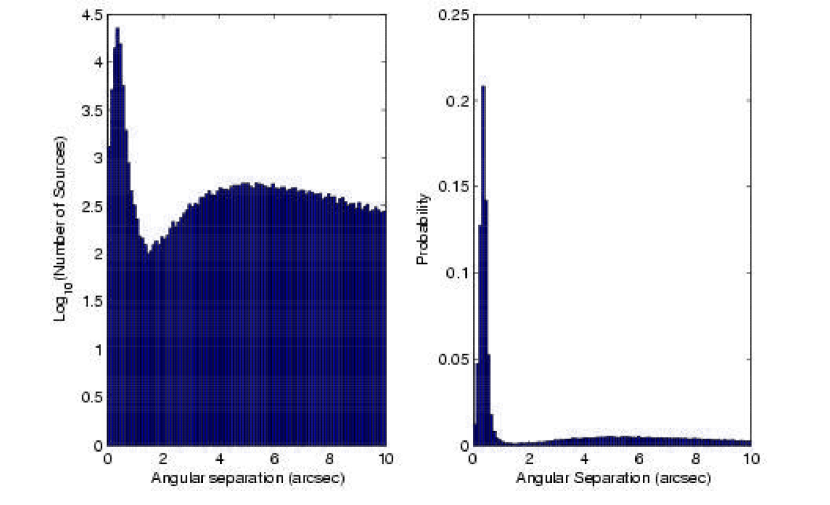
To cross-check the positional accuracy of the GLIMPSE catalog and estimate the probablity of confusion, I measured the angular separation between each GLIMPSE point source and the nearest 2MASS point source for sources within a 30′ radius of = 326.5°, = 0.0°. In total there are approximately 109,000 GLIMPSE and 83,500 2MASS point sources in this region. Figure 1 shows the distribution of angular separations plotted as a histogram with 0.1″ bins for the range 1-10″. The distribution peaks very strongly at 0.3-0.4″ as predicted with a much smaller secondary peak at around 5″ which can be used to estimate the probability of chance coincidence as it relates to the source density in the two catalogs. Approximately 34,000 GLIMPSE sources have a 2MASS point source within 1″ and extrapolation of the tail of the coincidence distribution implies (conservatively) that more than 97% of these are valid associations. This implies that the probability of any of the associations between GLIMPSE point sources and methanol masers listed in Table 1 being chance coincidences is low, particularly for the sources where the separation is less than 1″.
The minimum requirement for a source to be included in the GLIMPSE
point source catalogue was that it had to be detected with a
signal-to-noise ratio greater than 5, twice in one IRAC band and
once in an adjacent band 111GLIMPSE Data Products Document v1.5,
http://data.spitzer.caltech.edu/popular/glimpse/20050415_enhanced_v1/Documents/
glimpse_dataprod_v1.5.pdf.
The point source catalog is believed to be 99% reliable. The GLIMPSE
archive is a more complete second catalog with less stringent
conditions, requiring two detections with a signal-to-noise ratio
greater than 5 in any bands. The archive contains approximately 50%
more sources than the point source catalog. A search of the GLIMPSE
archive finds sources within 2″ of an additional 9 methanol
masers that do not have an associated GLIMPSE point source. The names
of the sources from the GLIMPSE archive (where there is no associated
GLIMPSE point source) are also listed in Table 1. GLIMPSE sources from the point source catalog have the prefix GLMC and those
from the archive GLMA, the archive sources are also listed in italics
in Tables 1 & 2 so that they stand out.
Considering both GLIMPSE point sources and archive sources,
thirty-eight of the fifty-six methanol masers (68%) have an associated
GLIMPSE source within 2″. For the forty-one methanol masers in
the statistically complete sample there are thirty-two with associated
GLIMPSE sources (78%)
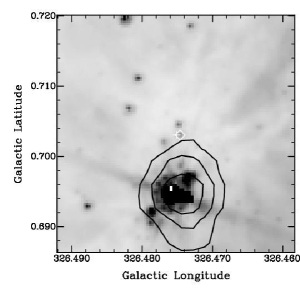
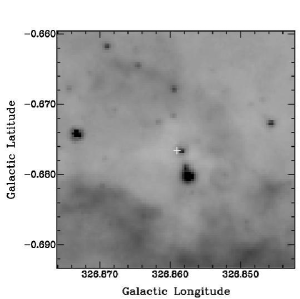
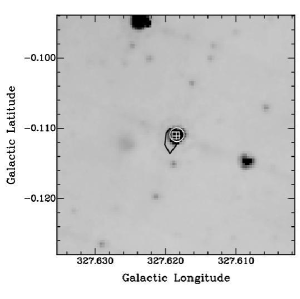
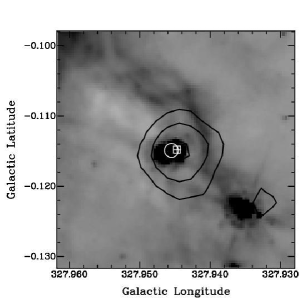
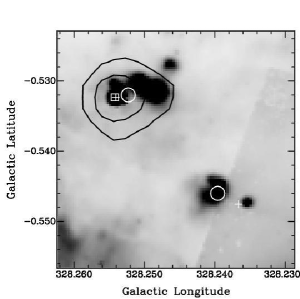
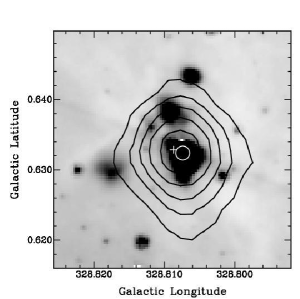
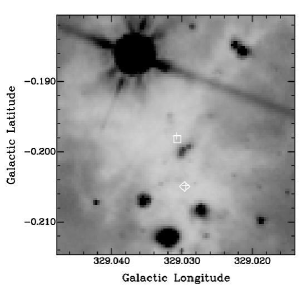
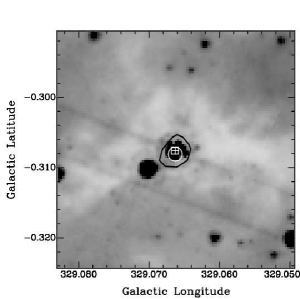
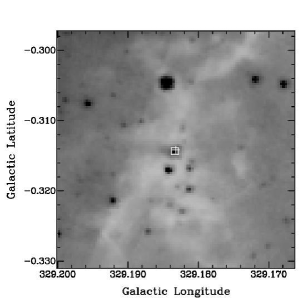
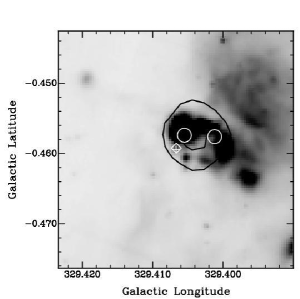
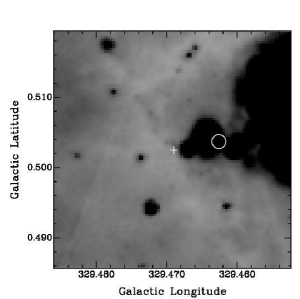
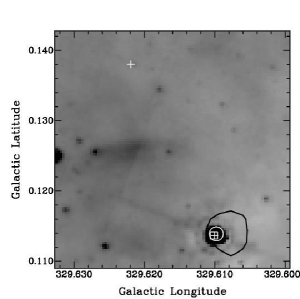
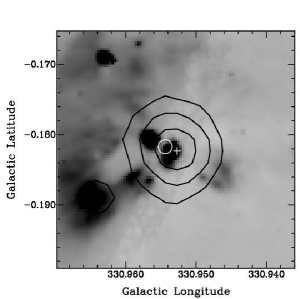
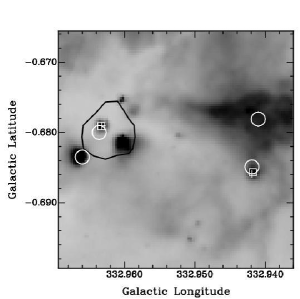
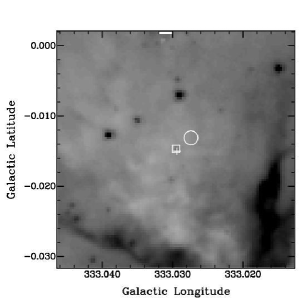
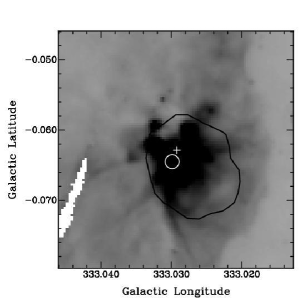
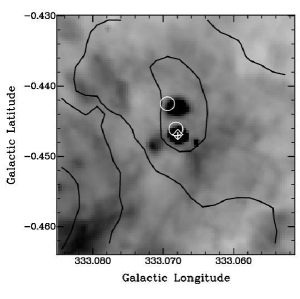
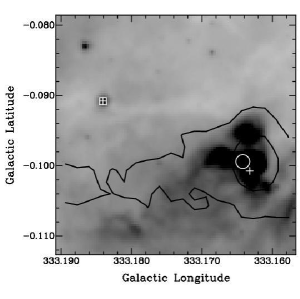
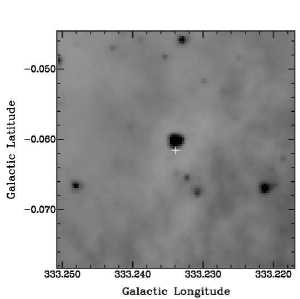
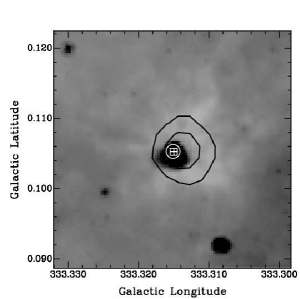
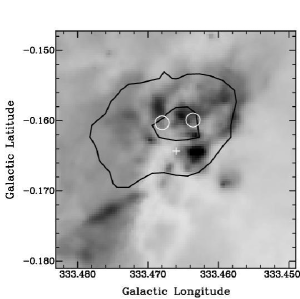
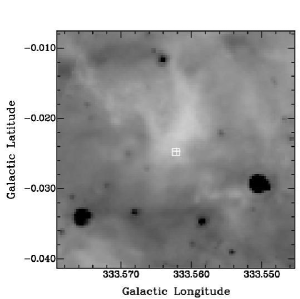
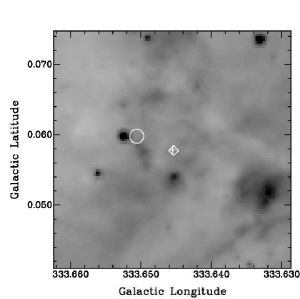
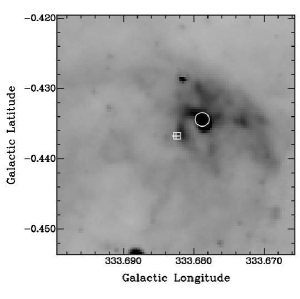
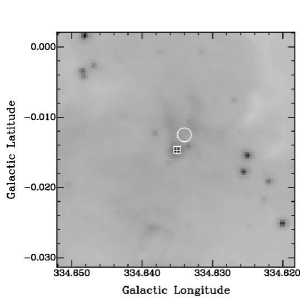
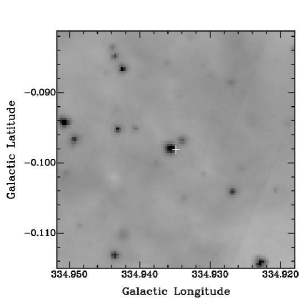
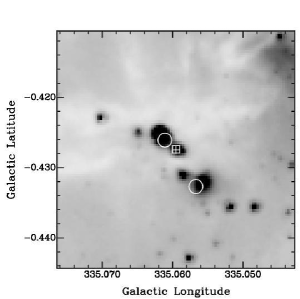
For each of the eighteen methanol masers that have no associated GLIMPSE point or archive source there are two possible explanations, one is that the associated mid-infrared emission is too faint, the other is that the emission in the region is extended and hence not present in the point source catalog. It is possible to distinguish between these two possibilities by examining the GLIMPSE mosaics in the region surrounding each maser source. Figures 2-14 show the 8.0 µm GLIMPSE observations (grayscale) and MSX E-band (21 µm) emission (contours) in a 2′ square field centered on the location of each maser (in some cases there are multiple maser sites within one field). The locations of the methanol masers, nearest GLIMPSE point source (within 2″) and any MSX point source within 5″ are also shown in each figure. Comments on selected individual sources are given in section 3.1. There are image artifacts present in some of the fields, wherever there are strong 8.0 µm sources they are accompanied by linear features running from a position angle of approximately 250° through to 70° (the scanning direction of the observations). For some point sources (e.g. G ) the point spread function of the IRAC instrument is evident, and a few fields (e.g. G ) have blanked pixels due to saturation. However, these and other minor image artifacts do not have a significant impact on our ability to investigate the mid-infrared emission associated with the methanol masers. It is clear from Fig. 2-14 that in the majority of cases where there is no GLIMPSE point source near the masers, they are projected against regions of extended 8.0 µm emission. So at the sensitivity of the GLIMPSE survey only a small percentage (somewhere in the range of 5-10%) of methanol masers are not associated with mid-infrared emission at wavelengths of 8.0 µm or shorter.
Information on associated water, OH and class I methanol masers is available for the 6.7 GHz methanol masers from the Mt Pleasant sample in the region =325-335° region, and these are listed in the last column of Table 1, along with the relevant references. The 6.7 GHz methanol and the OH masers have both been observed with the ATCA and only sources where the two species are coincident to within 1″ are listed. However, the water and class I methanol maser observations were both made with single dish radio telescopes and were targeted towards the 6.7 GHz maser position, so a definite association between the two different maser species has not been made for these transitions. The locations of these associated masers are not shown in Fig. 2-14, as the OH masers lie at essentially the same location as the methanol masers and for the water and class I methanol masers the position relative to the class II methanol masers has not been determined.
3.1 Comments on individual sources of interest
G (Fig. 2) : The methanol maser lies to the north of a strong 8 and 21 µm source. The maser is projected against one of a number of faint, compact 8 µm sources and may be associated with the nearest GLIMPSE archive source.
G (Fig. 2) : The maser is at the edge of a region of strong 21 µm emission; the (8 µm) GLIMPSE image is completely saturated. The maser is associated with a GLIMPSE point source, but it is one for which only the 3.6 & 4.5 µm measurements are given.
G (Fig. 2) : This methanol maser is associated with an MSX point source and a GLIMPSE archive source. The 8 µm image shows the maser projected against strong extended emission, presumably a moderately evolved star forming complex.
G (Fig. 2) : The maser is associated with a faint 8 µm source that lies within an IRDC, approximately 15″ to the south there is a stronger source which has a single narrow extension pointing towards the maser and its associated GLIMPSE point source.
G (Fig. 3) : This is a moderately strong methanol maser source that is associated with OH and water masers and GLIMPSE and MSX point sources. It is projected against extended 8 & 21 µm emission and lies near the edge of the large scale diffuse PAH emission from the Galactic Plane.
G & G (Fig. 3) : This complex region contains a number of extended 8 µm sources with diffuse emission to the north and low-contrast absorption to the south and east perhaps indicating the remnants of an IRDC. There are water, OH and two sites of methanol masers in this region separated by 5″. The methanol masers are projected against extended 8 µm emission and their separation is approximately perpendicular to the direction of extension of the dust emission. The VLBI images of Dodson et al. (2004) show the maser emission is elongated along approximately the same direction.
G (Fig. 3) : This region shows weak 21 µm emission, with a number of 8 µm sources at its edges, all of this embedded in a low-contrast IRDC. The methanol maser is associated with a slightly extended 8 µm source, there is a GLIMPSE archive source with measurements at 5.8 & 8.0 µm within 2 ″.
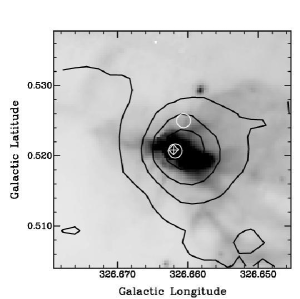
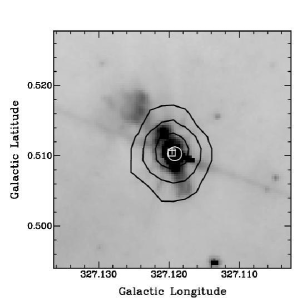
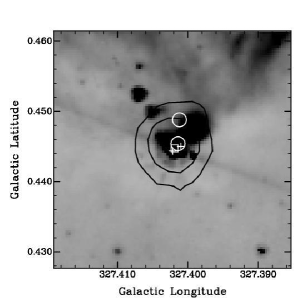
G & G (Fig. 4) : These two strong methanol masers each lie at the edge of extended 8 µm emission which is embedded within a single large IRDC. G has associated OH and water masers, while G is coincident with the strongest 8.0 µm emission in the vicinity and is also the centre of MSX 21 µm emission. Previous mid-infrared images by De Buizer et al. (2000) and Walsh et al. (2001) detected the emission associated with G, but showed the masers offset. The better astrometry of the GLIMPSE observations shows that the methanol masers are in fact projected against the mid-infrared source.
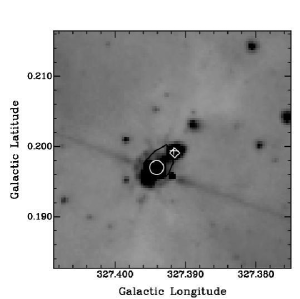
G (Fig. 4) : This is another strong, well studied methanol maser associated with class I methanol and OH masers (but not water). The masers are projected against an Hii region which is extended in the same direction as the mid-infrared emission, but to a much smaller degree (Ellingsen et al., 2005) and this region is seen in 8 µm GLIMPSE emission. Previous observations by De Buizer et al. (2000) and Walsh et al. (2001) are consistent with the GLIMPSE observations, but with the greater sensitivity and positional accuracy of GLIMPSE, all the masers can be seen to be projected against mid-infrared emission.
G & G (Fig. 5) : These two methanol maser sources lie at the northern end of a very long dark filament (G ), which also contains G and G and is discussed in more detail in section 4.4. Figure 5 appears to show that neither of the masers are associated with 8.0 µm emission, however, each is within 2 ″ of a GLIMPSE source that Table 2 shows to have a detection in this band. Comparison with the other sources listed in Table 2 shows that in each case the emission is several magnitudes weaker than any of the other maser associated sources and this emission is only visible when the image is scaled in such a way that the majority of the region is saturated. The unusual weakness of the 8.0 µm emission in these sources suggests that either the extinction in this IRDC is very high, or these methanol masers are associated with a particularly young high-mass star formation region. There are class I methanol, water and OH masers associated with both 6.7 GHz maser sites.
G & G (Fig. 5) : These masers are both projected against 8.0 µm emission near the middle and opposite extremity respectively of the G dark filament to G . Each of the masers is associated with a GLIMPSE point source with significantly stronger 8.0 µm emission than G or G .
G (Fig. 5) : The maser is projected against an extended region of mid-infrared emission, some of which has saturated at 8 µm. Walsh et al. (1998) did not detect any radio continuum emission associated with the masers.
G (Fig. 6) : The maser emission in this region lies projected against a small extension of a large extended mid-infrared source visible at both 8 & 21 µm. The maser lies at the edge of the extended mid-infrared emission.
G (Fig. 6) : The methanol masers lie at the edge of a large region of 8.0 µm emission which is relatively bright in comparison to the majority of those with associated masers and is projected against an IRDC which has lower contrast than most, perhaps indicating that it is at the far kinematic distance. The maser emission is not associated with a GLIMPSE point or archive source and Walsh et al. (1998) did not detect any radio continuum emission associated with the masers.
G (Fig. 6) : The methanol masers are associated with both an OH and water maser and lie near the interface between a large complex region of mid-infrared emission and an IRDC. Walsh et al. (1998) found that the methanol masers lie at the edge of a larger Hii region which is likely associated with the GLIMPSE and MSX emission.
G (Fig. 7) : The methanol masers in this source are projected against an Hii region (Phillips et al., 1998) which also has associated OH, water and a class I methanol maser. In terms of the mid-infrared emission the masers lie near the edge of a complex region which is surrounded by a low contrast dark cloud.
G (Fig. 7) : This source has previously been imaged in the mid-infrared by De Buizer et al. (2000) and Walsh et al. (2001), the latter finding the masers associated with a compact 10 µm source and the former finding the masers offset from the same source. The GLIMPSE images show that the masers are projected against a finger of low level 8.0 µm emission, at the edge of a large complex region. The masers are projected against weak, relatively diffuse radio continuum emission which is extended along the same axis as the mid-infrared emission (Phillips et al., 1998). Lee et al. (2001) detected H2 emission in the same region, perhaps powered by an outflow from the source associated with the masers.
G (Fig. 7) : The methanol masers are projected against 8.0 µm emission at the edge of a large complex region. There is a smooth, thin curved finger of mid-infrared emission that commenences just south of the masers and extends for approximately 1′.
G (Fig. 8) : This is one of the less common cases where the methanol masers lie near the centre of an extended region of mid-infrared emission at both 8.0 and 21 µm.
G (Fig. 9) : This is another source where the methanol masers lie towards the centre of a region of strong mid-infrared emission which has saturated at 8.0 µm. Ellingsen (2005) showed that few class II methanol masers have an associated MSX point source, however, G is one where there is a clear association.
G (Fig. 9) : The methanol masers are associated with a region of extended 8.0 & 21 µm emission. The masers are projected against a weak extension from the main region that lies at the interface with an IRDC.
G (Fig. 9) : The methanol masers lie at the interface between an extended region of mid-infrared emission and a low contrast IRDC. No other maser species have been detected towards this location.
G (Fig. 9) : The methanol masers are associated with a faint GLIMPSE point source embedded in a complex region. No other maser species have been detected towards this location and Walsh et al. (1998) did not detect any radio continuum emission associated with the methanol masers.
G & G (Fig. 10) : The G methanol masers are associated with GLIMPSE and MSX point sources that lie at the interface between an extended mid-infrared emission region and an IRDC. The G masers are associated with a point-like mid-infrared source embedded within the same IRDC as G .
G (Fig. 11) : The methanol masers lie near the centre of an extended region of 21 µm emission. There is a GLIMPSE archive source within 2″ of the methanol maser site, but no other maser species have been detected in this region.
G & G (Fig. 11) : Two nearby clusters of methanol masers lie at opposite edges of an extended region of 8.0 and 21 µm emission and are both associated with class I methanol and water masers. Neither of the masers have an associated GLIMPSE point source, most likely due to the strong extended emission in the region, but there is an archive source near G . In terms of mid-infrared emission, this is one of the most active regions with associated methanol masers in the = 325°–335° region.
G (Fig. 12) : The methanol masers are associated with both GLIMPSE and MSX point sources that are embedded within an IRDC that contains few other nearby emission sources.
G (Fig. 12) : The methanol masers lie at the interface between mid-infrared emission and an IRDC in a complex, clumpy region. The radio continuum image of Walsh et al. (1998) shows the masers are offset from nearby Hii regions that appear to be associated with the stronger mid-infrared emission in the region and are distributed roughly radially from the nearest infrared emission.
G (Fig. 12) : The methanol masers lie within a small IRDC and although they are associated with a GLIMPSE point source detected in the 3.6 & 4.5 µm bands there is no sign of any emission at 8.0 µm.
4 Discussion
4.1 The mid-infrared colors of 6.7 GHz methanol masers
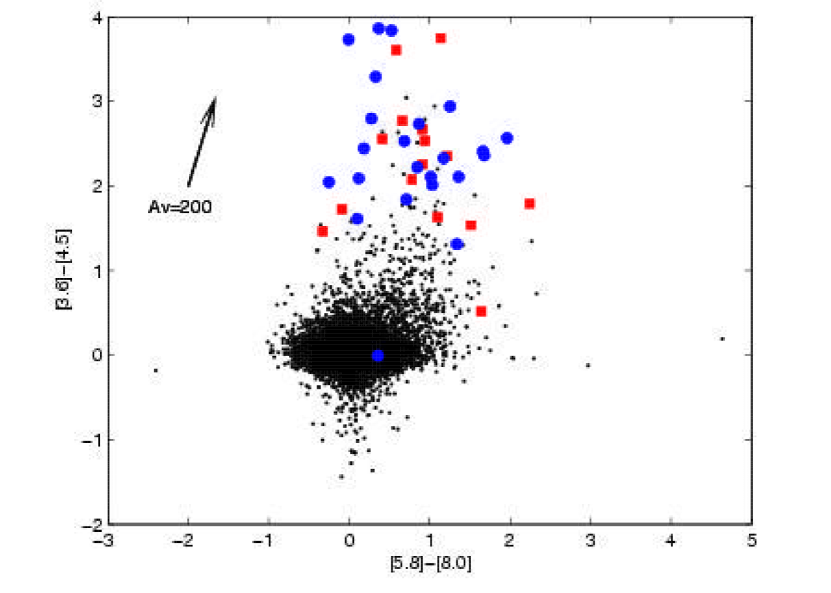
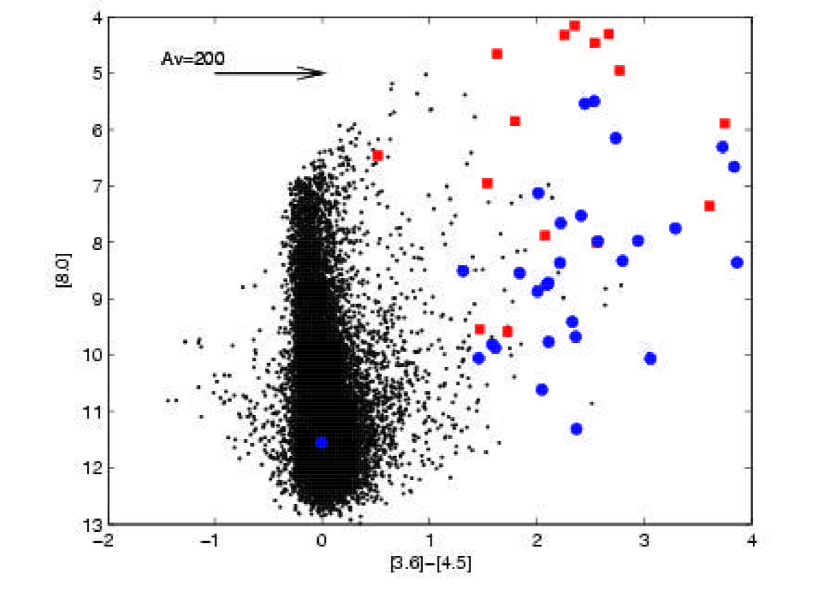
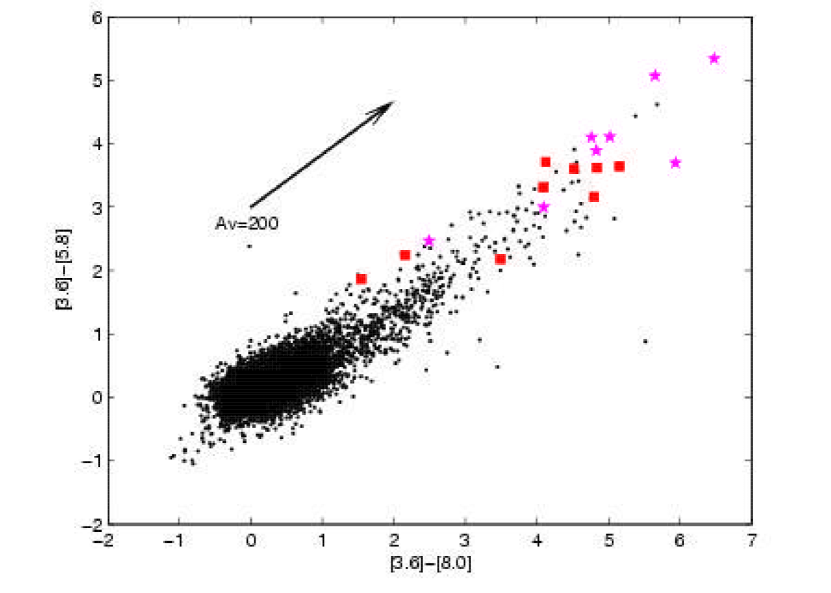
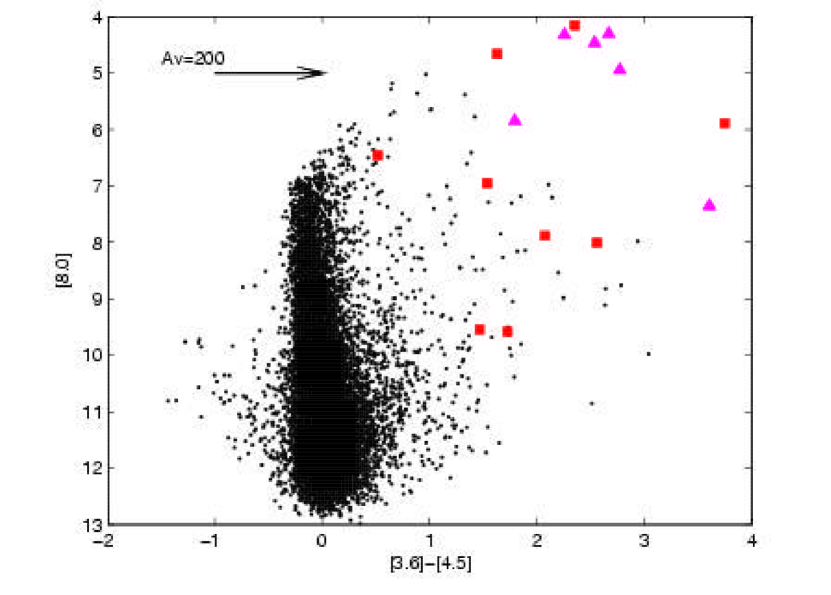
I have constructed color-color and color-magnitude diagrams for the GLIMPSE point sources associated with methanol masers in the Galactic Longitude range = 325°– 326° and compared their distribution to those within a 30′ radius of = 326.5°, = 0.0°. The comparison field contains 108,918 sources. The majority of sources from the GLIMPSE archive contain information from only two bands and few have sufficient information to be plotted in color-color or color-magnitude diagrams. So the color analysis has been restricted to just the masers associated with sources from the point source catalog. The locations of many other methanol maser sites within the GLIMPSE survey region have also been determined to sub-arcsecond precision from ATCA observations. To extend the maser sample size the properties of GLIMPSE point sources associated with 133 methanol masers from Caswell (1996) and Walsh et al. (1998) that lie outside =325°– 335° and within the GLIMPSE survey region were determined. Of these additional 6.7 GHz methanol masers 53 had associated GLIMPSE point sources within 2″. The maser associated sources are clearly offset from the majority of field sources in most of the color-color and color-magnitude diagrams, having colors that are much redder. This can be clearly be seen in Fig. 15 which shows a plot of the [5.8] - [8.0] µm versus [3.6] - [4.5] µm colors, where the masers in general lie above the vast majority of the comparison field sources. Table 2 shows that most of the maser sources have a [3.6] - [8.0] 4.0 mag (corresponding to a flux density ratio of 10), in contrast for the comparison field only 34 of the 22517 sources (0.15%) for which there is 3.6 and 8.0 µm data meet this criterion.
That the methanol masers lie in a distinctive region of GLIMPSE color-color diagrams is interesting, but what can be inferred from it? In principle it is possible to fit a single temperature grey-body spectrum to the GLIMPSE observations, however, we have no data at longer or shorter wavelengths (with comparable resolution) to provide meaningful constraints. The situation is further complicated through the influence of factors such as PAH emission and silicate absorption lines that affect some of the IRAC bands (see Draine, 2003, for an detailed discussion). PAH features at 3.3, 6.2, 7.7 and 8.6 µm lie within the [3.6], [5.8], [8.0] and [8.0] IRAC bands respectively. The diffuse PAH emission that extends throughout much of the inner Galactic Plane is generally of very low intensity, and as such is likely to have a minimal impact on the intensity measured for point sources, except where they are near the sensitivity limit of the observations. Some large star forming complexes, such as RCW49 show significant PAH emission from the region itself (Whitney et al., 2004) which is much stronger than the larger scale diffuse emission. The majority of the methanol masers appear to lie within star formation regions that are less evolved than RCW49 and so probably with correspondingly lesser PAH emission. However, mid-infrared spectroscopy (with an instrument such as the Spitzer Infrared Spectrograph) of a sample of sources with associated methanol masers is clearly required to accurately quantify the influence of PAH emission on the observed IRAC colors. The [8.0] IRAC band may also be affected by the silicate absorption feature at 9.7 µm. Recent mid-infrared spectroscopic observations of a number of high-mass young stellar objects (YSO) by De Buizer et al. (2005a) show significant silicate absorption, the wings of which extend well into the [8.0] IRAC band. In addition, three-dimensional radiative transfer modeling (Whitney et al., 2003) has shown that for low-mass (YSO) the SEDs in the infrared are complex and influenced by many factors including evolutionary status and orientation. These factors mean that until detailed mid-infrared spectroscopy is available, interpretation of the GLIMPSE colors of sources with associated methanol and other masers (e.g. as presented in section 4.5) is to a large degree speculative. However, it is still possible to make meaningful comparisons of the GLIMPSE point sources with and without methanol masers, as having been made with the same instrument they all suffer the same effects and limitations.
The modeling of Whitney et al. (2003) shows that class 0 objects lie in a distinctive region of the GLIMPSE [5.8]-[8.0] vs [3.6]-[4.5] color-color diagram and it is the same area as that occupied by the methanol masers (as can be seen by comparing Fig. 15 with Fig. 7a & 7b of Whitney et al.). The extent to which the class 0-III, low-mass evolutionary scheme can be transferred to high-mass/clustered star formation is very much an open question. However, the similarity of the location in the color-color diagram of the methanol masers to predictions for class 0 objects is striking. The fact that methanol masers are found in IRDC complicates the issue to some degree. Minier et al. (2005) modeled the SED of a number of methanol masers without associated radio continuum emission and determined the to range from 50-240 for the millimetre clumps with associated methanol masers. Figures 15 & 16 each show that the reddening vector of Indebetouw et al. (2005) determined from Spitzer data for the 1.25-8.0 µm range points from the location of the bulk of sources towards the methanol maser region. However, although reddening doubtless contributes to the observed colors, even an of 200 (as shown in Fig. 15 & 16) is insufficient to fully explain them. In Fig. 15 a reddening vector for , can be seen to be responsible for shifting the colors by approximately 1 magnitude in [3.6]-[4.5] and a third of a magnitude in [5.8]-[8.0]. Clearly as such promising candidates for the early stages of high-mass star formation it is important to determine the SED of these sources over a wider wavelength regime. This must be done at as high a resolution as can be achieved to avoid the effects of confusion. Whitney et al. (2003) find class 0 objects are well offset from all other low-mass YSO evolutionary phases in [24]-[70] vs [8.0]-[24] color-color diagrams. It would be very interesting to see if the high-mass protostellar objects associated with methanol masers have similar colours to class 0 objects over this spectral range as well.
4.2 Targeting maser searches using mid-infrared colors
The distinctive properties of the GLIMPSE sources associated with methanol masers also provide an opportunity to use them to target future maser searches. Although there have been a number of untargetted searches covering moderately large areas (Caswell, 1996; Ellingsen et al., 1996; Szymczak et al., 2002), there is much of the region covered by GLIMPSE which has yet to be searched. In developing targeting criteria for methanol masers it is a matter of compromising between detecting the highest possible percentage of the sources, while keeping a managable number of target locations to be searched. The GLIMPSE point source catalog contains more than 30 million objects and so to produce a reasonable list of targets requires criteria which matches of the order of 0.001-0.01% of them. The distinctive characteristics of the methanol maser sources are their very steep mid-infrared spectrum, and that they are bright in the 8.0 µm band (Fig. 15 & 16). Figure 16 shows that the majority of methanol masers have [3.6]-[4.5] 1.3 and an 8.0 µm magnitude less than 10, while relatively few sources in the comparison field share these properties. A search of the GLIMPSE point source catalog matches 5675 sources on these criteria (0.02% of all GLIMPSE sources).
It is possible to estimate the detection rate and efficiency of a methanol maser search targeted towards GLIMPSE point sources with the criteria outlined above through comparison with one of the untargeted searches. Untargeted searches by Ellingsen et al. (1996) and Caswell (1996) have detected forty-six 6.7 GHz methanol masers in the region =325°– 335°, =053 – +053 with a peak flux density greater than 2 Jy. A total of 572 GLIMPSE point sources within this region satisfy the criteria [3.6]-[4.5] 1.3 and an 8.0 µm magnitude 10. For a search with a single dish radio telescope such as the University of Tasmania Mt Pleasant 26m, any targets that lie within half the full width half maximum (FWHM) of the telescope beam of each other could be searched in a single pointing. The Mt Pleasant 26m telescope has a FWHM of approximately 7′ at 6.7 GHz and this reduces the total number of target positions within the selected region of the Galactic Plane to 352. This number of pointings is approximately one third the number required to completely search the region with a telescope of this size. If we assume that any 6.7 GHz methanol maser within the half-power radius of a targeted position will be detected in the search then we would find 38 of the 46 methanol maser sites in this region (it would also detected two of the sites that lie just outside the boundaries). This corresponds to a detection rate of 83% and an efficiency (percentage of target positions that yield a detection) of 11%. Ellingsen et al. (1996) performed a similar analysis for various IRAS-based search criteria and found typical efficiencies in the range 20-30% (with a much smaller number of target sources), but in general detection rates were less than 50% with the best being 59%. So maser searches targeted towards GLIMPSE point sources which meet certain criteria will detect many sources that similar IRAS-based searches cannot, however, at present 20% or so of sources can only be detected through untargeted searches. The clustering of high-mass star formation regions artificially enhances the detection rate of the targeting criteria. I have shown that approximately 50% of 6.7 GHz methanol masers have an associated GLIMPSE point source, yet targeting criteria based on GLIMPSE data is able to detect more than 80% of the masers. So approximately 30% of the detections will be made towards GLIMPSE point sources that are not directly associated with the masers, but are nearby within the same star formation complex.
Applying the same search strategy as outlined above (consolidating targets within half the FWHM to a single pointing) to the entire GLIMPSE catalog reduces the number of target positions from 5675 to 3723. Extrapolating the findings for the =325°– 335° region to the entire GLIMPSE region suggests that 402 methanol maser sources would be found if all sources matching the above criteria were searched. If the detection rate observed in the =325°– 335° region holds throughout the GLIMPSE survey region then it predicts that there are approximately 487 methanol masers within this area with peak flux densities of 2 Jy (the sensitivity limit of the Mt Pleasant survey) or more. The catalog of Pestalozzi et al. (2005) lists 391 6.7 GHz methanol masers in the GLIMPSE region, of which 347 have a peak flux density of greater than 2 Jy. This suggests that the majority of the 6.7 GHz methanol masers in this region have been detected by previous searches targeted towards OH masers and IRAS sources, but that a search based on the criteria listed above would likely yield of the order of 50 new detections.
A large number GLIMPSE sources that meet the criteria outlined above are very close to either the color limit or the magnitude limit and the detection efficiency calculated above could be raised relatively easily by making a small increase to the color limit, or a small decrease to the magnitude limit, however, this would naturally come at the cost of a reduced detection rate. The total number of GLIMPSE sources that satisfy the criteria means that it must include many objects which are not high-mass young stellar objects (since it would imply a rate of high-mass star formation approximately an order of magnitude in excess of that predicted from the IMF). This contamination is most likely from lower-mass young stellar objects and perhaps some evolved low-mass stars. For example the models of Whitney et al. (2003) show that the colors of the GLIMPSE sources associated with methanol masers are very similar to those predicted for class 0 YSO. It may be possible to use cross-correlation with other catalogues such as 2MASS to reduce this level of contamination and develop more refined criteria for targeting high-mass young stellar objects. However, although this will increase the efficiency of any surveys, it is clear from the analysis above that the majority of stronger ( 2 Jy) 6.7 GHz methanol masers from the GLIMPSE region have already been detected.
4.3 Methanol masers and IRDC
A striking feature of the 8.0 µm GLIMPSE mosaics is the diffuse emission present throughout much of the Galactic Plane, this is due to the PAH emission bands at 7.7 & 8.6 µm that fall within this IRAC band. Superimposed upon this diffuse background are dark clouds (IRDC), and when examining the GLIMPSE images on large scales it is clear that the methanol masers are preferentially associated with these. A brief subjective examination of GLIMPSE 8 µm images suggests that approximately 10-20% percent of IRDC have associated methanol masers. A more robust, objective determination of this percentage is beyond the scope of this paper as the level of extinction, foreground emission, sizes and morphologies of the IRDC cover a large range and development and application of consistent criteria to locate IRDC in the GLIMPSE observations is required. At the resolution and sensitivity of the GLIMPSE observations, many IRDC are seen to have one or more point or extended sources embedded within them, typically towards the center. The masers are typically coincident with one of these faint embedded emission sources within the IRDC. The images in Figs. 2-14 have had the contrast increased to highlight this low-level diffuse emission. Only a small number of the methanol masers are associated with prominent, well developed star formation regions such as G and G .
Infra-red dark clouds were discovered in ISO (Pérault et al., 1996) and MSX (Egan et al., 1998) observations and are associated with dense ( cm-2, cm-3), cold ( K) gas (Egan et al., 1998; Carey et al., 1998). These cold clouds are sufficiently dense to be detected in sub-millimeter emission with instruments such as the JCMT, and show similar overall morphology in sub-millimeter emission to that seen in infrared absorption (Carey et al., 2000). The sub-millimeter reveals more details of the structure of the clouds, in particular the location of warmer clumps within the cold dust. The density, temperature and scale of the IRDC have lead to speculation that they represent a very early stage in the star formation process, perhaps prior to the existence of young stellar objects. Recent observations have detected “warm” (40-60K) cores in a number of IRDC (Carey et al., 2000; Ormel et al., 2005; Menten et al., 2005) and masers or young stellar objects associated with some of these cores (Redman et al., 2003; Menten et al., 2005). The warm cores and presence of masers suggests that some IRDC harbor high-mass star formation in its very early stages. The presence of class II methanol masers towards faint emission sources in many IRDC shows that in a sizeable fraction, high-mass star formation has commenced. It also suggests that those IRDC which do not show maser emission from either water or methanol may be the best sites to study still earlier evolutionary phases of high-mass star formation.
The comments on individual sources (section 3.1) show that sometimes the methanol masers are associated with mid-infrared emission from the central regions of the dark cloud (e.g. G ), while in other cases they are offset from the strongest emission (e.g. G , G ). Where they are associated with a region that has moderately bright, extended 8.0 µm emission surrounded by a dark cloud, the masers are typically located at the interface between the two. This suggests that the methanol masers may be marking regions where the interaction of an earlier epoch of star formation with the parent molecular cloud has triggered further high-mass star formation. That multiple epochs of high-mass star formation occur within an individual giant molecular cloud is well established for regions such as Orion (Lada, 1999). The location of the methanol masers within the GLIMPSE images suggests that in many cases star formation commences in the central regions of a molecular core and proceeds outwards.
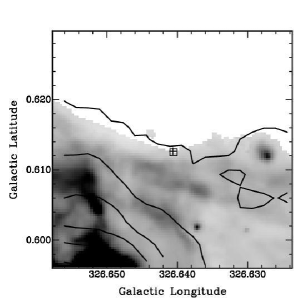
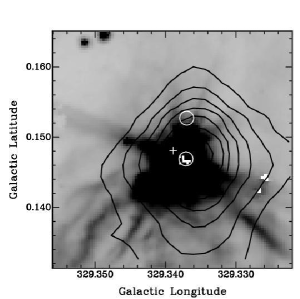
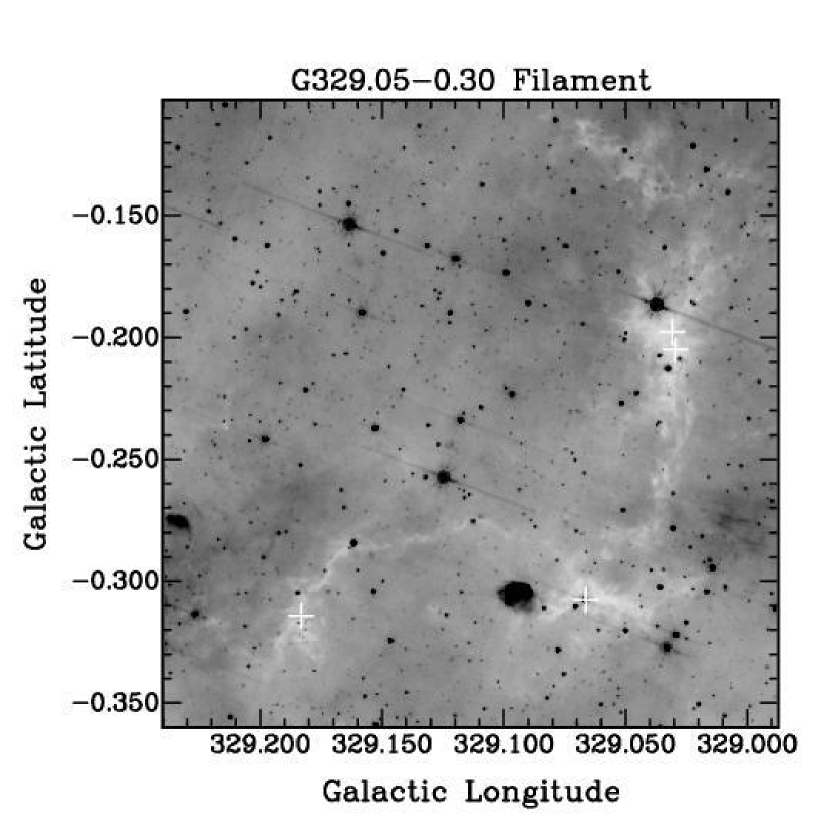
4.4 The dark filament G
The majority of the methanol masers are associated with IRDC which show relatively little elongation. Notable exceptions are the four methanol masers (G , G , G , G ) associated with the dark filament centered on Galactic coordinates =329.05, =0.30 shown in Figure 17. More detailed images of the regions surrounding each of the masers are shown in Fig. 5. The G filament shows a number of similarities to one of the best studied IRDC G (Menten et al., 2005), which has been modeled as a nonmagnetic isothermal filament (Johnstone et al., 2003). VLBI images of the G 6.7 GHz methanol masers shows two sites, the largest of which is aligned north-south, the same as the dark filament (Dodson et al., 2004). Class I methanol and OH masers are found towards each of the four class II sites (Ellingsen, 2005; Caswell, 1998) and water masers are associated with three of the four, the exception being G (Hanslow, 1997). There are three regions along the filament where the 8 µm absorption peaks and width of the filament broadens. At each of these locations there are one or more methanol maser sites. The near kinematic distance determined from the velocity of the peak of the 6.7 GHz methanol maser emission in each of the sources varies from 2.6-3.6 kpc. Using a distance of 3 kpc for the filament, the three clumps of methanol masers are separated by a linear distance of about 6 pc from their nearest neighbouring maser. Assuming the 6.7 GHz methanol masers have a lifetime of years it is improbable that any localised event triggered the fragmentation and subsequent star formation occurring along the filament as it would require any disturbance to propagate at speeds in excess of 60 kms-1.
4.5 Identifying an evolutionary sequence for masers
An important question relating to the common maser species (OH, methanol and water) is whether or not we can use them to help identify an evolutionary sequence in high-mass star formation? Previous attempts (e.g. Ellingsen, 2005) have been hampered by the limitations of earlier generations of infrared catalogs. Many star forming regions show emission in two or more of these maser species, so clearly there is a large degree of overlap in the evolutionary phases, however, there are also many sources where only one of the common maser species is observed. Forster & Caswell (1989) surveyed a large number of star forming regions with the VLA, observing main-line OH masers, water masers and radio continuum emission. They concluded that the water masers are associated with younger regions, with those which show both species being of intermediate age, and those with only OH masers the oldest. Early searches for class II methanol masers towards OH maser sites were very successful. However, untargetted searches, and those targetted towards IRAS sources detected many in regions with no OH masers and as outlined in the introduction there is good evidence from millimeter and submillimeter observations that some methanol masers trace an early stage of the high-mass star formation process (Pestalozzi et al., 2002; Walsh et al., 2003; Minier et al., 2005). This is interpretted similarly to the water/OH relationship with the methanol masers arising prior to the OH phase, but with a significant degree of overlap. The question then naturally arises, which species, methanol or water, traces the earliest phase?
Information on associated water, OH and class I methanol masers (Caswell, 1998; Ellingsen, 2005; Hanslow, 1997) is available for the 6.7 GHz methanol masers from the Mt Pleasant sample in the region =325-335° region, as is outlined in section 3. The water and class I methanol maser observations were both made with single dish radio telescopes and were targeted towards the 6.7 GHz maser position, so a definite association between the two different maser species has not yet been made for these transitions. Future high resolution observations are likely to show that in some cases the two maser species are associated with independent objects within a larger star-forming complex. These “false” associations will add confusion to attempts to find any evolutionary trend, however, they are unlikely to mask it completely.
To investigate whether there is any evidence for the various maser species tracing different evolutionary phases the 29 GLIMPSE point sources associated with 6.7 GHz methanol masers were split into two sub-samples on the basis of whether or not they also had an associated OH maser. A number of color-color and color-magnitude diagrams, including those shown in Fig. 15 & 16 were then constructed to compare the two samples. This procedure was repeated for sub-samples constructed on the basis of water and class I methanol maser association. The total number of 6.7 GHz methanol masers with associated GLIMPSE point sources which had sufficient data to be plotted in Fig. 15 & 16 was around 15 in each case, so typically the sub-samples had less than 10 members in each case. The small numbers in each sample and the possibility of contamination from false associations for the water and class I methanol masers mean that it is not possible to draw any firm conclusions, however, a number of interesting trends worthy of further investigation are evident.
Figure 18 plots a [3.6]-[8.0] versus [3.6-[5.8] color-color diagrams using different symbols for the two sub-samples of GLIMPSE associated methanol masers, it also shows sources from the comparison field. Figure 18 shows that for class II methanol masers with an associated class I methanol maser, there is a trend for the GLIMPSE point sources to be redder than those without an associated class I methanol maser. Figure 19 shows that for class II methanol masers with an associated OH maser, there is a trend for the 8.0 µm magnitude of the GLIMPSE point sources to be less than for those without an associated OH maser. As stated above, these trends could be artifacts of small number statistics, however, they clearly warrent further investigation.
What might these apparent trends mean for a maser evolutionary sequence? Class I methanol masers are created at the interface between molecular outflows and the parent cloud (Plambeck & Menten, 1990; Johnston et al., 1992). Such outflows are expected to be most energetic and prevalent during the infall/accretion phase of star formation and hence it has been speculated that sources with associated class I methanol masers may signpost an earlier phase of high-mass star formation than those without. In general the youngest stellar objects will be the most deeply embedded and coldest and this implies that they will have the steepest mid-infrared spectrum. The trend shown in Fig. 18 appears consistent with this picture, with the youngest maser sources with associated class I methanol masers generally having the redest GLIMPSE colors.
As outlined above, methanol masers with associated OH masers are thought to be typically associated with a more advanced evolutionary phase than those without. Figure 19 shows that methanol masers with associated OH masers are generally brighter at 8.0 µm than those without. All of these sources lie in the same region of the Galactic Plane and so the range of distances for the two sub-samples should be very similar, implying that the sources with associated OH masers really are more luminous at 8.0 µm and not simply closer. There are two possible explanations for this :
-
•
The stellar luminosity range traced by OH masers may cutoff at a higher mass than is the case for methanol masers.
-
•
The sources with associated OH masers have less silicate absorption and/or more PAH emission in the 8.0 µm band than those without.
Both of the above possibilities are consistent with other observed properties of OH and methanol maser sources. A greater percentage of OH masers are associated with ultra-compact Hii regions than are methanol masers Caswell (1997). The more massive the star, the brighter the Hii region and the easier it will be to detect at centimeter wavelengths. Further, if the methanol masers extend to a lower mass range then we would expect there to be more methanol maser sources than OH maser sources, as is observed (Caswell et al., 1995). However, the 6.7 GHz methanol masers typically have a peak flux density an order of magnitude greater than main-line OH masers from the same source (Caswell et al., 1995) and so this may partly be due to the sensitivity of searches for the two maser species. Alternatively, if OH and methanol masers trace similar stellar mass ranges then the observation that OH masers are more often associated with Hii regions implies that they are generally at a later evolutionary phase. As an Hii region forms and evolves it will gradually destroy or clear the surrounding dust reducing silicate absorption and the UV radiation will stimulate PAH emission. Both of these effects will increase the 8.0 µm emission. These two hypotheses can be tested through mid-infrared spectroscopy of the GLIMPSE sources.
5 Conclusions
Data from the GLIMPSE legacy science program of the Spitzer Space Telescope has been used to investigate the properties of the infrared sources associated with class II methanol masers. Approximately 70% of class II methanol masers have a GLIMPSE point source or archive source within 2″, a much higher rate of association than found in previous infrared catalogs such as IRAS or MSX. The colors of the GLIMPSE point sources associated with methanol masers are very red, similar to low-mass class 0 YSO, and consistent with other recent observations (e.g. Pestalozzi et al., 2002; Walsh et al., 2003; Minier et al., 2005) suggesting that they are associated with a very early phase of high-mass star formation. GLIMPSE colors have been used to develop criteria for targeting methanol maser searches which will detect more than 80% of all sources with an efficiency of greater than 10%.
IRDC are considered prime candidates to be the location for the earliest stages of high-mass star formation. GLIMPSE 8.0 µm images show that the majority of class II methanol masers are associated with sources embedded within IRDC, and that a significant fraction of IRDC contain methanol masers. This is consistent with both IRDC and class II methanol masers signposting regions where high-mass star formation is in its early stages and confirms that star-formation has commenced in many IRDC. IRDC without associated methanol and/or water masers may represent regions at a still earlier stage of the high-mass star formation evolutionary sequence (although some may simply be regions where the beaming angle or some other factor is unfavourable for our line of sight).
It appears likely that the properties of GLIMPSE sources associated with masers will allow a qualitative evolutionary sequence for the early stages of high-mass star formation to be developed and tested against models. Comparison of the colors of class II methanol maser sources with and without associated class I methanol masers shows that those with an associated class I methanol maser have redder GLIMPSE colors. This is consistent with class I methanol masers being generally associated with younger objects. While a comparison of the properties of GLIMPSE sources related to class II methanol masers with and without associated OH masers shows that those with an associated OH maser are generally stronger in the 8.0 µm band. This may indicate that the stellar mass range associated with methanol maser extends to lower masses than for OH masers, or alternatively it may show that OH masers are generally associated with a later evolutionary phase.
Acknowledgements
I would like to thank the referee for many useful comments that have improved the paper. I would like to thank John Dickey for stimulating discussions on the GLIMPSE program and the nature of IRDC. Financial support for this work was provided by the Australian Research Council. This research has made use of NASA’s Astrophysics Data System Abstract Service. This research has made use of data products from the GLIMPSE survey, which is a legacy science program of the Spitzer Space Telescope, funded by the National Aeronautics and Space Administration. This research has made use of data products from the Midcourse Space Experiment. Processing of the data was funded by the Ballistic Missile Defence Organization with additional support from the NASA Office of Space Science. The research has made use of the NASA/IPAC Infrared Science Archive, which is operated by the Jet Propulsion Laboratory, California Institute of Technology, under contract with the National Aeronautics and Space Administration.
Facilities: Sa.Sptizer(IRAC).
References
- Benjamin et al. (2003) Benjamin, R. A. et al. 2003, PASP, 115, 953
- Brand & Blitz (1993) Brand, J., Blitz, L. 1993, A&A, 275, 67
- Carey et al. (1998) Carey, S. J., Clark, F. O., Egan, M. P., Price, S. D., Shipman, R. F., Kuchar, T. A. 1998, ApJ, 508, 721
- Carey et al. (2000) Carey, S. J., Feldman, P. A., Redman, R. O., Egan, M. P., MacLeod, J. M., Price, S. D. 2000, ApJ, 543, L157
- Caswell (1996) Caswell, J. L. 1996, MNRAS, 279 , 79
- Caswell (1997) Caswell, J. L. 1997, MNRAS, 289, 203
- Caswell (1998) Caswell, J. L. 1998, MNRAS, 297, 215
- Caswell et al. (1995) Caswell, J. L., Vaile, R. A., Ellingsen, S. P., Whiteoak, J. B., Norris, R. P. 1995, MNRAS, 272, 96
- De Buizer et al. (2000) De Buizer, J. M., Piña, R. K., Telesco, C. M. 2000, ApJS, 130, 437
- De Buizer et al. (2005a) De Buizer, J. M., Osorio, M., Calvet, N. 2005, ApJ, in press
- De Buizer et al. (2005b) De Buizer, J. M., Radomski, J. T., Telesco, C. M., Piña, R. K. 2005, ApJS, 156, 179
- Dodson et al. (2004) Dodson, R., Ojha, R., Ellingsen, S. P. 2004, MNRAS, 351, 779
- Draine (2003) Draine, B. T. 2003, ARA&A, 41, 241
- Egan et al. (1998) Egan, M. P., Shipman, R. F., Price, S. D., Carey, S. J., Clark, F. O., Cohen, M. 1998, ApJ, 494, L199
- Ellingsen (2005) Ellingsen, S. P. 2005, MNRAS, 359, 1498
- Ellingsen et al. (1996) Ellingsen, S. P., von Bibra, M. L., McCulloch, P. M., Norris, R. P., Deshpande, A. A., Phillips, C. J. 1996, MNRAS, 280, 378
- Ellingsen et al. (2005) Ellingsen, S. P., Shabala, S. S., Kurtz, S. E. 2005, MNRAS, 357, 1003
- Forster & Caswell (1989) Forster, J. R., Caswell, J. L. 1989, A&A, 213, 339
- Goedhart et al. (2002) Goedhart, S., van der Walt, D. J., Gaylard, M. J. 2002, MNRAS, 353, 125
- Hanslow (1997) Hanslow, L. A. 1997, Honours Thesis University of Tasmania
- Lee et al. (2001) Lee, J.-K., Walsh, A. J., Burton, M. G., Ashley, M. C. B. 2001, MNRAS, 324, 1102.
- Indebetouw et al. (2005) Indebetouw, R. et al. 2005, ApJ, 619, 931
- Johnston et al. (1992) Johnston, K. J., Gaume, R., Stolovy, S., Wilson, T. L., Walmsley, C. M., Menten, K. M. 1992, ApJ, 385, 232
- Johnstone et al. (2003) Johnstone, D., Fiege, J. D., Redman, R. O., Feldman, P. A., Carey, S. J. 2003, ApJ, 588, L37
- Lada (1999) Lada, C. J. 1999, in The Origin of Stars and Planetary Systems, ed. C. J. Lada & N. D. Kylafis (Dordrecht: Kluwer Academic Publishers), 143
- Lumsden et al. (2002) Lumsden, S. L., Hoare, M. G., Oudmaijer, R. D., Richards, D. 2002, MNRAS, 336, 621
- Menten et al. (1992) Menten, K. M., Reid, M. J., Pratap, P., Moran, J. M., Wilson, T. L. 1992, ApJ, 401, L39
- Menten et al. (2005) Menten, K. M., Pillai, T., Wyrowski, F. 2005, in Massive Star Birth: A Crossroads of Astrophysics, Proceedings of IAU Symposium 227, ed. R. Cesaroni, E. Churchwell, M. Felli & C. M. Walmsley (Cambridge University Press), in press
- Minier et al. (2003) Minier, V., Ellingsen, S. P., Norris, R. P., Booth, R. S. 2003, A&A, 403, 1095
- Minier et al. (2005) Minier, V., Burton, M. G., Hill, T., Pestalozzi, M. R., Purcell, C. R., Garay, G., Walsh, A. J., Longmore, S. 2005, A&A, 429, 945
- Ormel et al. (2005) Ormel, C. W., Shipman, R. F., Ossenkopf, V., Helmich, F. P. 2005, A&A, 439, 613
- Pérault et al. (1996) Pérault, M. et al. 1996, A&A, 315, L165
- Pestalozzi et al. (2002) Pestalozzi, M., Humphreys, E. M. L., Booth, R. S. 2002, A&A, 384, L15
- Pestalozzi et al. (2005) Pestalozzi, M. R., Minier, V., Booth, R. S. 2005, A&A, 432, 737
- Phillips et al. (1998) Phillips, C. J., Norris, R. P., Ellingsen, S. P., McCulloch, P. M. 1998, MNRAS, 300, 1131
- Plambeck & Menten (1990) Plambeck, R. L., Menten, K. M. 1990, ApJ, 364, 555
- Redman et al. (2003) Redman, R. O., Feldman, P. A., Wyrowski, F., Côté, S., Carey, S. J., Egan, M. P. 2003, ApJ, 586, 1127
- Schutte et al. (1993) Schutte, A. J., van der Walt, D. J., Gaylard, M. J., MacLeod, G. C. 1993, MNRAS, 261, 783
- Slysh et al. (1999) Slysh, V. I., Val’tts, I. E., Kalenskii, S. V., Voronkov, M. A., Palagi, F., Tofani, G., Catarzi, M. 1999, A&AS, 134, 115
- Sobolev & Deguchi (1994) Sobolev, A.M., Deguchi, S. 1994, A&A, 291, 569
- Sobolev et al. (1997) Sobolev, A. M., Cragg, D. M., Godfrey, P. D. 1997, MNRAS, 288, L39
- Sutton et al. (2001) Sutton, E. C., Sobolev, A. M., Ellingsen, S. P., Cragg, D. M., Mehringer, D. M., Ostrovskii, A. B., Godfrey, P. D. 2001, ApJ, 554, 173
- Szymczak et al. (2000) Szymczak, M., Hrynek, G., Kus, A. J. 2000, A&AS, 143, 269
- Szymczak et al. (2002) Szymczak, M., Kus, A. J., Hrynek, G., Kȩpa, A., Pazderski, E. 2002, A&A, 392, 277
- Testi et al. (1998) Testi L., Felli M., Persi P., Roth M. 1998, A&AS, 129, 495
- van der Walt et al. (1995) van der Walt, D. J., Gaylard, M. J., MacLeod, G. C. 1995, A&AS, 110, 81
- Walsh et al. (1997) Walsh, A. J., Hyland, A. R., Robinson, G., Burton, M. G. 1997, MNRAS, 291, 261
- Walsh et al. (1998) Walsh, A. J., Burton, M. G., Hyland, A. R., Robinson, G. 1998, MNRAS, 301, 640
- Walsh et al. (1999) Walsh, A. J., Burton, M. G., Hyland, A. R., Robinson, G. 1999, MNRAS, 309, 905
- Walsh et al. (2001) Walsh, A. J., Bertoldi, F., Burton, M. G., Nikola, T. 2001, MNRAS, 326, 36
- Walsh et al. (2003) Walsh, A. J., Macdonald, G. H., Alvey, N. D. S., Burton, M. G., Lee, J. -K. 2003, A&A, 410, 597
- Whitney et al. (2003) Whitney, B. A., Wood, K., Bjorkman, J. E., Cohen, M. 2003, ApJ, 598, 1079
- Whitney et al. (2004) Whitney, B. A. et al. 2004, ApJS, 154, 315
- Wood & Churchwell (1989) Wood, D. O. S., Churchwell, E. 1989, ApJ, 340, 265
| Source | Methanol | Right | Declination | GLIMPSE | Sep. | Kinematic Distance | Assoc. | |
|---|---|---|---|---|---|---|---|---|
| # | Maser | Ascension | Source | (″) | Near | Far | ||
| (J2000) | (J2000) | Name | (kpc) | (kpc) | ||||
| 1 | G | 15:43:16.648 | -54:07:12.71 | GLMA | 1.8 | 2.6 | 11.6 | I,w |
| 2 | G | 15:44:32.938 | -54:05:28.55 | GLMC | 0.6 | 2.9 | 11.3 | I,w |
| 3 | G | 15:45:02.854 | -54:09:03.20 | GLMA | 0.2 | 2.8 | 11.4 | w |
| 4 | G | 15:51:14.190 | -54:58:04.94 | 3.7 | 10.5 | I | ||
| 5 | G | 15:47:32.729 | -53:52:38.90 | GLMC | 0.9 | 5.5 | 8.7 | o,w |
| 6 | G | 15:49:19.523 | -53:45:14.21 | GLMC | 1.7 | 5.2 | 9.1 | o,w |
| 7 | G | 15:50:18.491 | -53:57:06.36 | GLMA | 1.2 | 5.3 | 9.0 | I |
| 8 | G | 15:52:36.824 | -54:03:18.97 | GLMC | 0.7 | 5.4 | 8.9 | |
| 9 | G | 15:52:50.241 | -54:03:00.71 | GLMC | 0.6 | 6.5 | 7.9 | I |
| 10 | G | 15:54:33.917 | -53:50:44.58 | GLMC | 0.2 | 3.4 | 11.0 | |
| 11 | G | 15:57:58.381 | -53:59:23.14 | 3.0 | 11.4 | I,o,w | ||
| 12 | G | 15:57:59.790 | -53:58:00.85 | GLMC | 0.5 | 2.6 | 11.9 | o,w |
| 13 | G | 15:55:48.608 | -52:43:06.20 | 3.0 | 11.5 | I,o | ||
| 14 | G | 16:00:30.326 | -53:12:27.35 | GLMC | 1.6 | 2.9 | 11.7 | I,o,w |
| 15 | G | 16:00:31.799 | -53:12:49.66 | GLMA | 0.7 | 2.6 | 12.0 | I,o,w |
| 16 | G | 16:01:09.940 | -53:16:02.65 | GLMC | 0.3 | 3.0 | 11.6 | I,o |
| 17 | G | 16:01:47.034 | -53:11:44.19 | GLMC | 0.7 | 3.6 | 11.0 | I,o,w |
| 18 | G | 16:00:33.154 | -52:44:40.00 | 7.3 | 7.3 | |||
| 19 | G | 16:03:32.662 | -53:09:26.98 | GLMA | 0.8 | 4.2 | 10.4 | o,w |
| 20 | G | 15:59:40.727 | -52:23:27.70 | 4.5 | 10.1 | I | ||
| 21 | G | 16:02:00.292 | -52:33:59.16 | 3.9 | 10.8 | w | ||
| 22 | G | 16:02:03.103 | -52:35:33.53 | GLMC | 0.4 | 3.9 | 10.8 | |
| 23 | G | 16:09:52.372 | -51:54:57.89 | 5.3 | 9.5 | o,w | ||
| 24 | G | 16:10:23.050 | -51:45:20.10 | GLMC | 0.3 | 5.6 | 9.2 | |
| 25 | G | 16:10:59.743 | -51:50:22.70 | GLMC | 1.4 | 5.2 | 9.7 | I,o,w |
| 26 | G | 16:11:26.596 | -51:41:56.67 | GLMC | 1.1 | 4.8 | 10.1 | o,w |
| 27 | G | 16:12:26.456 | -51:46:16.86 | GLMC | 0.1 | 4.3 | 10.6 | I,o |
| 28 | G | 16:10:09.354 | -51:16:04.60 | GLMC | 1.1 | 5.4 | 9.6 | |
| 29 | G | 16:12:12.478 | -51:35:10.32 | GLMC | 0.3 | 5.4 | 9.6 | I,o,w |
| 30 | G | 16:12:09.020 | -51:25:47.60 | 5.1 | 9.8 | o | ||
| 31 | G | 16:12:27.210 | -51:27:38.20 | 6.3 | 8.7 | o,w | ||
| 32 | G | 16:16:16.487 | -51:18:25.46 | 4.0 | 11.0 | w | ||
| 33 | G | 16:15:45.381 | -50:55:53.85 | 3.2 | 11.8 | I,w | ||
| 34 | G | 16:17:31.560 | -51:08:21.55 | GLMC | 1.8 | 3.6 | 11.5 | |
| 35 | G | 16:17:12.123 | -50:47:12.27 | GLMC | 0.5 | 3.5 | 11.6 | |
| 36 | G | 16:17:29.320 | -50:46:12.51 | GLMC | 1.2 | 3.5 | 11.6 | I |
| 37 | G | 16:21:19.018 | -50:54:10.41 | GLMC | 1.0 | 3.6 | 11.5 | I,w |
| 38 | G | 16:21:22.926 | -50:52:58.71 | GLMC | 0.3 | 3.2 | 11.9 | I |
| 39 | G | 16:18:44.167 | -50:21:50.77 | GLMC | 1.4 | 3.6 | 11.5 | |
| 40 | G | 16:18:56.735 | -50:23:54.17 | 3.6 | 11.5 | I | ||
| 41 | G | 16:20:48.995 | -50:38:40.72 | GLMA | 0.6 | 3.7 | 11.5 | |
| 42 | G | 16:20:59.704 | -50:35:52.32 | 3.4 | 11.8 | I,w | ||
| 43 | G | 16:21:03.300 | -50:35:49.75 | GLMA | 1.9 | 3.1 | 12.0 | I,w |
| 44 | G | 16:21:35.392 | -50:40:56.97 | 3.8 | 11.4 | I,w | ||
| 45 | G | 16:19:42.670 | -50:19:53.20 | 5.7 | 9.5 | I | ||
| 46 | G | 16:19:45.620 | -50:18:35.00 | GLMC | 0.1 | 5.0 | 10.1 | I |
| 47 | G | 16:19:51.250 | -50:15:14.10 | 5.2 | 10.0 | I,o,w | ||
| 48 | G | 16:19:29.016 | -50:04:41.45 | GLMC | 0.1 | 3.1 | 12.1 | I,o |
| 49 | G | 16:21:20.180 | -50:09:48.60 | 3.0 | 12.2 | I,o,w | ||
| 50 | G | 16:21:08.797 | -49:59:48.26 | GLMC | 0.6 | 2.7 | 12.6 | I |
| 51 | G | 16:21:09.140 | -49:52:45.90 | GLMA | 0.6 | 5.3 | 10.0 | |
| 52 | G | 16:23:29.794 | -50:12:08.69 | GLMC | 0.5 | 0.4 | 14.9 | |
| 53 | G | 16:23:14.831 | -49:48:48.87 | GLMA | 0.7 | 2.7 | 12.5 | |
| 54 | G | 16:25:45.729 | -49:13:37.51 | GLMC | 0.5 | 2.3 | 13.0 | |
| 55 | G | 16:27:24.250 | -49:04:11.30 | 1.6 | 13.8 | |||
| 56 | G | 16:29:23.146 | -49:12:27.34 | GLMC | 0.3 | 3.4 | 12.1 | I,o,w |
| Src | GLIMPSE | Magnitudes | Flux Densities | ||||||
|---|---|---|---|---|---|---|---|---|---|
| # | Source | 3.6 µm | 4.5 µm | 5.8 µm | 8.0 µm | 3.6 µm | 4.5 µm | 5.8 µm | 8.0 µm |
| Name | (mag) | (mag) | (mag) | (mag) | (mJy) | (mJy) | (mJy) | (mJy) | |
| 1 | GLMA | 0.61 | 11.3 | 15.7 | 26.0 | ||||
| 2 | GLMC | 1.01 | 0.53 | ||||||
| 3 | GLMA | 474 | 9290 | ||||||
| 5 | GLMC | 275 | 1787 | ||||||
| 6 | GLMC | 1444 | 1435 | ||||||
| 7 | GLMA | 137 | 163.00 | ||||||
| 8 | GLMC | 8.69 | 9.0 | 67.0 | 164.1 | ||||
| 9 | GLMC | 87.3 | 254 | 581 | 863 | ||||
| 10 | GLMC | 160 | 503 | 910 | |||||
| 12 | GLMC | 80.9 | 418 | 938 | 1179 | ||||
| 14 | GLMC | 2.75 | 3.87 | 0.77 | |||||
| 15 | GLMA | 1.01 | |||||||
| 16 | GLMC | 52.9 | 354 | 801 | 1030 | ||||
| 17 | GLMC | 6.7 | 27.4 | 15.2 | |||||
| 19 | GLMA | 84.5 | |||||||
| 22 | GLMC | 70.4 | 397 | 830 | 1377 | ||||
| 24 | GLMC | 3.90 | 26.7 | 50.1 | 39.6 | ||||
| 25 | GLMC | 5.35 | 18.0 | 68 | 289 | ||||
| 26 | GLMC | 9.8 | 23.3 | ||||||
| 27 | GLMC | 51.6 | 391 | 954 | 1196 | ||||
| 28 | GLMC | 4.01 | 10.7 | 48.2 | 105 | ||||
| 29 | GLMC | 1.74 | 31.2 | 77.7 | 72.1 | ||||
| 34 | GLMC | 2.19 | 6.44 | 8.7 | |||||
| 35 | GLMC | 10.3 | 25.6 | 24.0 | 9.6 | ||||
| 36 | GLMC | 0.92 | 3.12 | ||||||
| 37 | GLMC | 197 | 151 | ||||||
| 38 | GLMC | 3.13 | 64.0 | 180.1 | 277.8 | ||||
| 39 | GLMC | 5.59 | 17.7 | 18.5 | 9.26 | ||||
| 41 | GLMA | 95.2 | 834 | 2390 | |||||
| 43 | GLMA | 114 | 73.5 | 50.0 | |||||
| 46 | GLMC | 180 | 135.2 | ||||||
| 48 | GLMC | 36.2 | 300 | 664 | 661 | ||||
| 50 | GLMC | 0.899 | 1.55 | ||||||
| 51 | GLMA | 1.17 | 3.47 | ||||||
| 52 | GLMC | 1.69 | 3.77 | ||||||
| 53 | GLMA | 3.39 | 27.1 | 75.4 | |||||
| 54 | GLMC | 4.50 | 19.6 | 39.8 | 44.4 | ||||
| 56 | GLMC | 164 | 176.4 | ||||||