Type II Quasars from the SDSS: IV. Chandra and XMM-Newton Observations Reveal Heavily Absorbed Sources.
Abstract
We are carrying out sensitive X-ray observations with Chandra and XMM of type II quasars selected from the Sloan Digital Sky Survey based on their optical emission line properties. In this paper we present the first results of our program. We present observations of four objects at redshifts and an analysis of the archival data for four additional objects in the same redshift range. Six of the eight were detected in X-rays; five of them have sufficient signal to derive spectral information. All of the detected sources have intrinsic luminosities erg s-1; the five with sufficient counts for spectral fitting show evidence for significant absorption ( a few cm-2). At least three of the objects likely have cm-2; some may be Compton-thick (). In the five objects for which we could fit spectra, the slopes tend to be significantly flatter than is typically observed in AGN; it is possible that this is due either to reprocessing of the nuclear emission or to a line of sight that passes through patchy absorption.
Subject headings:
galaxies: active — quasars: general — X-rays1. Introduction
Type II Active Galactic Nuclei (AGN) are defined as those AGN lacking broad optical emission lines. In many cases, particularly at low luminosity (i.e., Seyfert galaxies), the absence of broad optical emission lines has been shown to be due to obscuration, i.e., the central regions are blocked from the observer by a high column density of gas and dust. In the standard unification model, the absorbing material is toroidal, resulting in highly anisotropic optical, UV and X-ray emission, while the strong narrow emission lines are produced above and below the obscuring torus in matter illuminated by the central engine. The detection of broad emission lines in polarized, and hence scattered, light shows that at least in some cases the lack of broad lines is due to orientation effects (Antonucci, 1993). Although low-luminosity obscured AGN (type II Seyfert galaxies) are abundant in the local universe (Kauffmann et al., 2004; Hao et al., 2005), until recently only a few type II quasar candidates were known (e.g., Kleinmann et al. 1988).
A key question is therefore to what extent the standard model applies to type II quasars. This is the fourth in a series of papers using a sample selected on the basis of Sloan Digital Sky Survey (SDSS) data to study the numbers and properties of high-luminosity type II AGN, type II quasars. Our method is based on the supposition (as posited in the standard model) that most of the narrow optical line emission originates outside the obscuring torus, and is therefore expected to be roughly isotropic. We have selected several hundred type II quasar candidates from the spectroscopic database of the SDSS based on their narrow emission line properties (Zakamska et al. 2003, hereafter Paper I). We are now conducting sensitive multi-wavelength observations of these objects to determine the range of their properties and to understand how they compare to type II AGN in general. In this paper we present the first results of our Chandra (Weisskopf et al., 2002) and XMM (Jansen et al., 2001) programs. Our main goal is the determination of the X-ray spectral properties of this sample: their X-ray luminosities, continuum spectral slopes, and line-of-sight obscuration.
Other methods have been used recently to search for type II AGN. Deep hard X-ray (i.e., E 2 keV) surveys efficiently detect AGN candidates, including potentially obscured ones. For example, the X-ray background in the 1–6 keV band has been largely resolved into AGN at redshifts around (Hornschemeier et al., 2001). However, while many of these X-ray sources show only narrow emission lines in their optical spectra, a significant number of X-ray sources show broad emission lines or no emission lines whatsoever (e.g., Barger et al. 2003; Szokoly et al. 2004; Barger et al. 2005; Heckman et al. 2005, and Matt 2002 for an earlier review). In addition, many X-ray selected AGN candidates are very faint in the optical (i.e., ). Consequently, it is difficult even to obtain complete redshift information for samples selected in this manner, much less a complete classification of their optical spectroscopic types.
Alternatively Type-2 AGN are often detected in large-area hard X-ray surveys (Della Ceca et al., 2004; Caccianiga et al., 2004; Revnivtsev et al., 2004) and X-ray follow-ups to very hard (E 10 keV) X-ray all-sky surveys (Sazonov et al., 2004). These methods are promising since the detected objects tend to be (or are selected to be) bright in X-rays and often also in the optical, allowing for spectroscopic classification and redshift determination. However, while several Type-2 quasars have been found (i.e., with ), these sources tend to be mostly Seyfert 2 galaxies at low redshifts (particularly in the very hard X-ray surveys since the high background of non-imaging detectors results in high flux limits). Severgnini et al. (2005) discuss a related approach in which a field with known Extremely Red Objects (EROs) was surveyed with XMM-Newton, and several EROs were found to harbor obscurred AGN and quasars. Likewise, a considerable effort is being applied to use mid-IR colors to select AGN (Haas et al., 2004; Lacy et al., 2004; Stern et al., 2004), but the completeness and efficiency of the selection of type II AGN by this method has not yet been established. Along these lines, Martinez-Sansigre et al. (2005) selected type II quasars at using the Spitzer First Look Survey data along with radio fluxes to find type II AGN and exclude starburst galaxies. This study suggests that the type II AGN fraction is at , but the uncertainties are large due to small number statistics and model-dependent assumptions.
In Section 2 we review in detail the properties of the SDSS type II AGN sample. Section 3 describes our observations and data reduction, Section 4 describes the X-ray spectral analysis, Section 5 gives details on individual objects. We discuss our results in Section 6, followed by a brief summary in Section 7. An , , cosmology is assumed throughout. We frequently refer to the [OIII]5007Å optical emission line as simply [OIII]. Objects are identified by their J2000 coordinates in Table 2 (e.g., SDSS J084234.94+362503.1) and shortened to hhmm+ddmm notation elsewhere (SDSS J0842+3625).
2. Sample description
The SDSS (York et al., 2000; Stoughton et al., 2002; Abazajian et al., 2003, 2004, 2005) is an ongoing optical survey to image about 10,000 deg2 and obtain spectra of about 106 galaxies and 105 quasars. Using the spectroscopic database of the SDSS as of July 2002 (about spectra), we identified 291 objects in the redshift range having strong narrow emission lines with high-ionization line ratios characteristic of an underlying AGN continuum (Paper I). Neither broad emission lines nor the strong ionizing UV continuum are seen in these spectra, suggesting that the central engine is blocked from the observer. All these objects are therefore type II AGN candidates based on their optical properties.
Since the narrow lines are presumably illuminated by the central engine similarly in type I and type II AGN, narrow line luminosities can serve as a proxy for the nuclear luminosity. We used the [OIII]5007Å emission line, which is present in all of the SDSS spectra of our objects, and one of the strongest optical emission lines in type II AGN (Osterbrock, 1989). About 50% of the objects in our sample (130/291) have [OIII]5007Å luminosities in excess of , similar to those of luminous unobscured quasars (). Based on this somewhat arbitrary criterion we classified objects with [OIII] as type II quasars; those with lower luminosities we designated type II Seyfert galaxies (Paper I).
Using data from the IRAS all-sky survey we found that the mid-IR luminosities of the objects in our sample reach a few erg s-1 (Zakamska et al., 2004), and therefore we directly confirmed the luminous nature of these objects. We have conducted spectropolarimetry of a subsample of the most luminous objects (Zakamska et al., 2005) and have shown that they harbor luminous blue broad-line quasars in their centers. These results are consistent with the basic orientation-based unification model of toroidal obscuration and off-plane scattering (Antonucci, 1993), implying that the model can be extended to include at least some high-luminosity AGN.
We used the ROSAT All-Sky Survey (RASS; see Voges et al. 1999 and references therein) data to investigate the X-ray properties of the objects in our sample (Zakamska et al., 2004). We found that type II AGN are about 10 times less likely to be soft X-ray sources than are type I AGN with the same redshift and [OIII] luminosity. Furthermore, an unexpectedly high fraction (50%) of the few objects with counterparts in RASS are radio-loud, in which cases the soft X-ray emission may be associated with jet activity rather than with the central engine (Urry, 2004). These findings indicate either that type II AGN are significantly underluminous in X-rays compared to type I AGN, or, more likely, that the soft X-ray emission is absorbed by intervening material in type II AGN, consistent with the standard unification model. Similar conclusions were obtained by Vignali et al. (2004), who investigated pointed ROSAT observations of the fields of 16 objects from our sample and found that the majority of objects are undetected in soft X-rays even in exposures much deeper than those of RASS. Our program of sensitive X-ray observations reaching well into the 210 keV band is intended to provide better understanding of the low ROSAT detection rate of type II AGN, and to measure their absorbing column densities and the X-ray luminosities independently.
3. Observations and Data Reduction
Of the eight objects presented in this paper, two were observed as part of our Chandra proposal (ID 05701043), and two were observed as part of our XMM proposal (ID 020434). In addition, we checked all archival pointings of Chandra and XMM within 15′ of SDSS type II AGN111using the High-Energy Astrophysics Science Archive (HEASARC), http://heasarc.gsfc.nasa.gov and found that an additional four objects from Paper I were observed serendipitously. The list of the objects, observation IDs, exposure times and dates of the observations are given in Table 2. Of the four objects observed serendipitously, two (SDSS J0115+0015 and SDSS J0243+0006) do not meet our quasar luminosity criterion ([OIII]), so we classify them as Seyfert II galaxies. All eight objects in this paper are radio-quiet, as determined by the ratio of their radio and [OIII] luminosities (Zakamska et al. 2004).
We used XAssist (Ptak & Griffiths, 2003) for initial processing of all data. XAssist works similarly for both Chandra and XMM-Newton data, with most operations performed by the software packages CIAO (version 3.2.1 and CALDB 3.0.3) and XMMSAS (version 6.1.0). For each field, the data were reprocessed to take advantage of the latest calibrations, sources were detected, and the exposure was trimmed to remove background flares. The size of each source on the detector was estimated in order to determine appropriate source extraction regions, typically regions (Chandra) or regions (XMM-Newton) for on-axis point sources. For off-axis observations we used larger source extraction regions, as described below for each individual case. Spectral responses were calculated for the source spectra, and background spectra were extracted from annuli centered on the sources, with interloping sources excluded from the background regions.
4. Results of Spectral Analysis
Of the eight objects in our sample, six were detected in X-rays, and all are consistent with being point sources. We defined “detection” as having enough counts in excess of the expected background that the Poisson probability of a spurious source at that location was (corresponding to a criterion in Gaussian statistics). Since we are investigating specific locations rather than sampling a large field, this limit is very conservative. However, as discussed below, in only one case (SDSS J0842+3625) would a lower (yet reasonable) detection limit result in a detection, and in that case the source detection is complicated by the position of the source in the field. For the purpose of estimating error bounds for the luminosity, we treat all three weak sources, whether detected or not, in the same fashion.
Sufficient counts for spectral fitting were detected from five objects (with more than 300 counts; see Table 2). We modeled the spectra with a power-law continuum absorbed by the Galactic column density and an absorber at the redshift of the source, resulting in three free parameters (the column density , X-ray photon index : , and the power-law normalization). The relation between HI column density and opacity assumed solar abundances. Galactic absorption was derived from the HI map (Dickey & Lockman, 1990) using the nh tool provided by the HEASARC. The Galactic neutral hydrogen column density does not exceed cm-2 for any of the objects in our sample.
A simple absorbed power-law model is generally inaccurate for very high column densities of the absorber ( cm-2) because electron scattering significantly modifies the observed spectrum. We therefore used the approximate model by Yaqoob (1997) that allows for scattering (“plcabs” in xspec). When the Compton optical depth is significant, the flux that emerges in any particular direction is strongly dependent on the scatterer’s geometry (Krolik, Madau, & Zycki, 1994; Ghisellini, Haardt & Matt, 1994); the plcabs model assumes spherical symmetry, which is not necessarily appropriate (we expect that the obscuration is toroidal). Our hope is that this model provides a slightly better estimate, particularly for Compton depths that are order unity or less, than ignoring scattering altogether. For low optical depths, this model is equivalent to simple absorbed power-law models.
The XMM-Newton spectra were binned in energy to 20 counts per bin to allow the use of the statistic. For the two Chandra observations, the expected background contribution to the source region is negligible ( counts in both cases), and we used the C statistic (Cash, 1979) for spectral fits, without binning and subtracting the background. The parameter errors were computed at 90% significance for one interesting parameter (). In the case of SDSS J0801+4412, which had only 40 detected photons, we fixed the power-law photon index at (the typical value found in X-ray surveys for AGN fit with an absorbed power-law model; e.g., Nandra et al. 2005; Tozzi et al. 2005). Adopting values of (the photon index of the X-ray background in the 0.5-10.0 keV bandpass), or a steeper slope such as , resulted in similar fit parameters.
The spectral fits are shown in Figures 1 - 5, and Table 3 displays the parameters derived for the objects in our sample. The fits are statistically acceptable for all objects except SDSS J1641+3858. For five of the eight, we were able to constrain the column density of absorption, finding H cm-2 for four of them and roughly ten times that amount in the fifth case (albeit with poor statistics). For four of the eight we were able to constrain the continuum slope, and all four are significantly harder than typical Type I AGN: three have , and the fourth has . After correction for light lost to absorption, the five spectral fits indicate 2–10 keV luminosities between 0.8 and erg s-1.


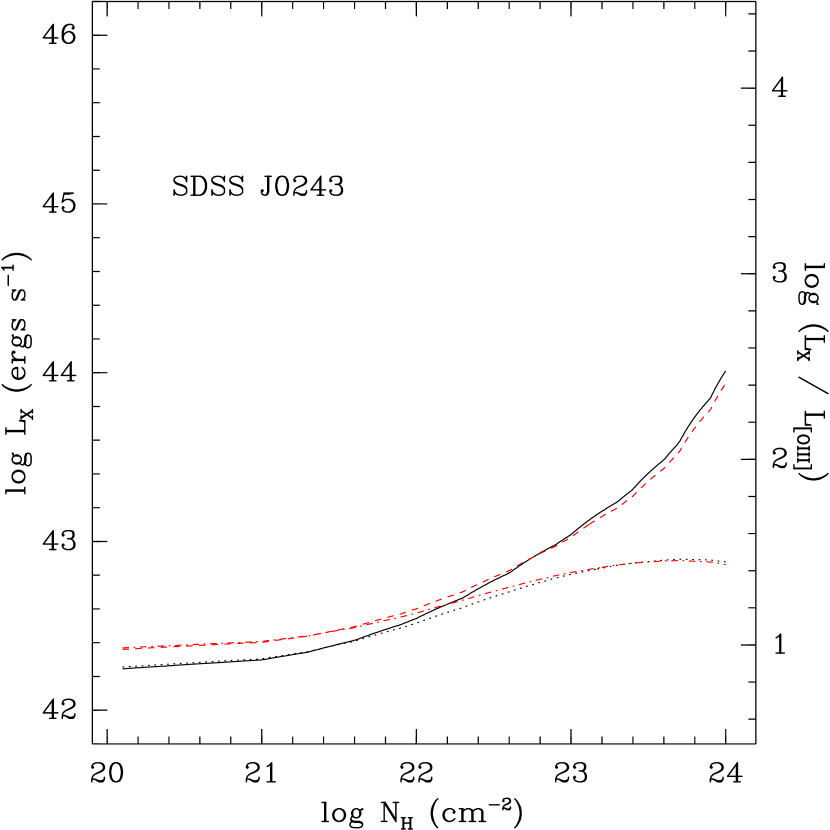
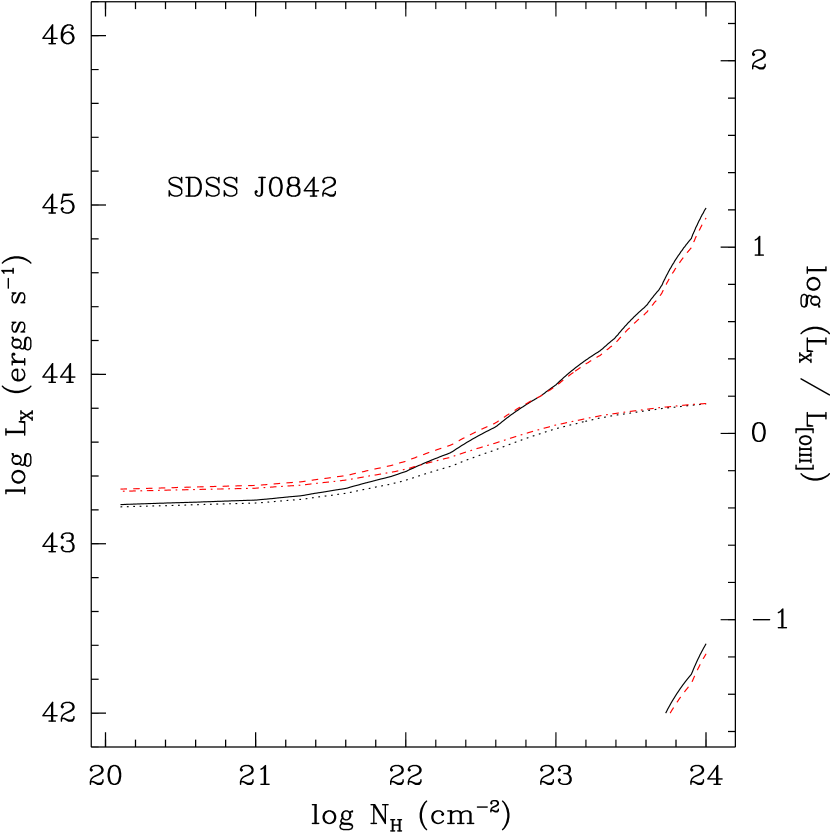
For two objects, SDSS J0243+0006 and SDSS J0842+3625, we regard our data as providing only upper limits on the X-ray flux because the Poisson probability of a spurious source at those locations was greater than 0.3%. Because SDSS J0243+0006 was observed by XMM-Newton, each observation resulted in three separate upper limits. We therefore generalized the approach of Kraft et al. (1991), where upper limits are derived for (single) observations in the Poisson statistical regime, to account for the different responses of the MOS and PN detectors as described in Appendix A. The results of this analysis are shown in Figure 6, which shows 99.7% confidence regions in the plane for assumed to be either 1.4 or 1.7. These regions are unbounded toward higher values of since no flux would be expected if cm-2 (in the Compton-thick case, i.e., when the line-of-sight material is optically thick to Thompson scattering, Comastri 2004). We plot the regions for both the absorbed and intrinsic X-ray luminosities. For comparison with the spectral fitting results, in Table 3 we also list the upper limits corresponding to fixing the column density at .
We find it intriguing that the continuum slopes of the objects in our sample are consistently shallower than in type I AGN, e.g., in citetrisa05, based on an XMM serendipitous survey of photometrically-selected SDSS quasars. It may be that this is because the spectral complexity often seen in surveys of Seyfert II galaxies (Turner et al., 1997; Risaliti, 2002) may be masked by our comparatively poor photon statistics. One possible complication is “reprocessing”, in which X-ray photons are reflected from optically-thick material located out of the line of sight (e.g., the accretion disk or the opposing side of the putative torus) or scattered by optically-thin, highly-ionized gas (e.g., the matter that creates the polarization signature). Alternatively, the obscuring material may not uniformly cover the X-ray source. In both cases, the observed X-rays are absorbed by a range of column densities, which tends to flatten the observed X-ray spectrum.
To investigate this possibility, we have explored fitting a two-absorber model (both at the redshift of the source) to the two sources with the best photon statistics (SDSS J1226+0131 and SDSS J1641+3858). That is, in the limit of negligible Compton scattering (), our model reduces to the form
where is the observed photon energy, is the absorption cross section per H atom, gives the fraction of the source obscured by column density , while the remainder of the source is covered by matter with column density . The two-absorber model is an approximation to either the case of partial covering or the case of some X-ray flux being scattered into the line of sight around a higher column-density absorber. The results of the fits (i.e., the two column densities and the covering fraction for the smaller column density) are shown in Table 4. For both objects, the best-fit column density on the line-of-sight of greater covering fraction increased, by a modest amount for SDSS J1641+3858, and by at least an order of magnitude for SDSS J1226+0131. In both cases the smaller column density covers of the source. As expected, the derived intrinsic continuum slope grew significantly steeper in both cases (for SDSS J1641+3858, the resulting value of is nominally larger than in the single-absorber case, but is not well-constrained). The results of fitting a two-absorber model should be treated with caution, because in the case of SDSS J1226+0131 the single-absorber model is statistically satisfactory (/dof, which can be rejected at a confidence level of only 70%), so there is no requirement to introduce a more complex model in that case. However we note that these covering fractions (1-f, or ) are similar to the values observed in nearby Seyfert 2 galaxies (Turner et al., 1997). On the other hand, in the case of SDSS J1641+3858, while the quality of fit is improved, it is still not entirely satisfactory (/dof, which can be rejected at the 97% confidence level). We discuss this latter object in more detail in the following section.
5. Notes on Individual Objects
SDSS J0115+0015: This AGN is located behind the cluster Abell 168 and was covered serendipitously by a Chandra observation of this cluster, 1.75′ off-axis. The X-ray source was detected with counts, with a negligible background ( counts in the source aperture of 2”). Both its [OIII] luminosity ([OIII]) and the intrinsic X-ray luminosity ( erg s-1) place this object somewhat below the quasar luminosity cut-off (we adopted [OIII] as the optical definition of a quasar from Paper I, and erg s-1 as the X-ray definition, Szokoly et al. 2004). Nevertheless, this is still a luminous AGN and is therefore included in the sample. In addition to the fit to the unbinned spectrum, we also fit this spectrum after binning to 20 counts bin-1, which resulted in very similar fit parameters. The single-absorber fit (Figure 1) resulted in a column density of .
SDSS J0210-1001: This object was observed as part of our XMM-Newton program. Its observed column density is (the absorbed power-law fit is shown in Figure 2), however the observed spectral slope is very flat (). This may be a case in which reprocessing, patchy absorption or other effects are important (as described in Section 4), but there are insufficient counts to justify any such model.
SDSS J0243+0006: This object is within the field of view of two XMM-Newton observations of NGC 1068, located ′ off-axis. Like SDSS J0115+0015, its [OIII] luminosity is not great enough for it to be labeled a quasar. It was not detected in any of the six exposures (using a source aperture of 21″), and the upper limits on the luminosity were obtained by combining the six exposures as discussed above and in the Appendix (see Figure 6). Even summing the counts, the nominal Poisson probability of no real source at this location was 15%.
SDSS J0801+4412: This object was detected with counts in a pointed Chandra observation from our program, too few to constrain the continuum slope. Less than background counts are expected in the source aperture, so we used the C statistic with no binning and without background subtraction in our spectral fitting (Figure 3). The resultant column density was for assumed photon indices of either 1.4 or 1.7.
SDSS J0842+3625: This object has the second highest [OIII] luminosity, after IRAS 09104+4109, of all known type II quasars (Kleinmann et al., 1988; Crawford & Vanderriest, 1996; Franceschini et al., 2000; Iwasawa et al., 2001) at redshifts . Like IRAS 09104 (Hines & Wills, 1993), SDSS J0842+3625 is 16% polarized in the optical (Zakamska et al., 2005). Unlike IRAS 09104, which is a double-lobed radio source, SDSS J0842+3625 has only a weak point-like radio counterpart and is radio-quiet, as determined by the radio-to-[OIII] ratio. The source was imaged by Chandra ACIS-I on two occasions, in Oct 1999 (observation ID 532, 8 ks exposure) and in Dec 2002 (observation ID 4217, 20 ks exposure) because it lies 6′ away from the center of the cluster Abell 697. Unfortunately, in the latter exposure SDSS J0842+3625 happens to lie between the ACIS-I detectors; we therefore discuss only the 8 ks observation. In that image, SDSS J0842+3625 is 6′ off-axis, where the point-spread function of Chandra is rather larger than on-axis. We used a 4″ extraction radius around the SDSS position, in which we found six counts. To estimate the background, we used two circular regions 25” in radius offset from the source position, from which we estimated there would be 1.0 0.2 and 1.5 0.2 background counts in the source region. This variation, while significant at less than the 2 level, may be due to the cluster emission. The count-to-background ratio from the higher background estimate implies that the source is detected with 99.5% confidence (Kraft et al., 1991). We therefore conservatively consider the observation to be an upper-limit (see Figure 6). This source is described as undetected by Vignali et al. (2004) based on the same data.
SDSS J1226+0131: This object was serendipitously covered by an XMM-Newton observation of an extragalactic gas-rich system, HI1225+01. A significant fraction of the exposure () was affected by strong flaring, and the data collected during the flares were excluded from the analysis. The single-absorber fit resulted in a column density of cm-2 (Figure 4). The spectrum of this object was also presented by Vignali et al. (2004), who obtained similar spectral parameters.
SDSS J1232+0206: This object was a target in our Chandra program. Six counts were detected within a 2” aperture at the position of the source and the background estimate in the source aperture is counts. This means that the source was marginally detected (Poisson probability of a false detection ). Since we have only barely enough counts for a detection, we follow the procedure discussed in the Appendix. We find that the 99.7% confidence contours (equivalent to in Gaussian statistics) define a band in the luminosity-column density plane (Figure 7). Because it is detected, albeit weakly, we can exclude the very low luminosity and high column density corner of this plane. We do not consider X-ray luminosities below because starburst X-ray emission can dominate over low-luminosity AGN emission at this level (e.g., see Ptak et al. 1998). In addition, we demonstrated in our earlier work (Zakamska et al. 2005) that scattering in the interstellar material in the host galaxy on kpc scales can be a significant effect, and around 1% of the intrinsic optical emission can thus reach the observer. If scattering is primarily by electrons, then the same scattering efficiency applies to the X-ray emission, and an apparent X-ray luminosity of erg s-1 can be dominated by the scattered light that has not been subject to circumnuclear obscuration. Therefore, for , our upper limit effectively becomes erg s-1. This object was listed by Zakamska et al. (2004) as having a potential counterpart in the RASS catalog, with a nominal offset between the SDSS position and the RASS position of 0.75′. Our Chandra data indicate that this is likely a mismatch, as there is a much brighter source in the field closer to the nominal RASS position.

SDSS J1641+3858: This object was observed by XMM-Newton as part of our program, and counts were detected. As mentioned above, a single absorber fit (Figure 5) is statistically unacceptable. The addition of a second absorber resulted in a marginally acceptable fit. Residuals remained at an observed energy of keV, which corresponds to 6.4 keV in the rest frame, the energy of the neutral Fe K emission line. We added a narrow (0.01 keV physical width) Gaussian to the fit, which reduced by for 2 additional parameters, but this does only slightly improves the confidence level of the fit. The rest-frame energy of the line was 6.69 (6.60-6.80) keV and the equivalent width (EW) was 0.16 (0.05-0.35) keV. This line energy is signicantly higher than 6.4 keV, which is expected from “neutral” Fe (less ionized than Fe XVII) and is consistent with He-like Fe-K emission. Nandra et al. (1997) and Reeves & Turner (2000) found evidence for a luminosity dependence in the Fe-K emission of AGN, possibly due to the putative accretion disk becoming ionized at high accretion rate. However, Jimenez-Bailon et al. (2005) found no correlation between Fe-K line energy and X-ray luminosity in a sample of PG quasars. The observed EW is similar to values observed in Type-1 radio-quiet AGN (Reeves & Turner, 2000), suggesting that the continuum we are observing at 6 keV is not obscured. This fit is shown in Figure 8.

6. Discussion
The primary goal of our study was to determine the X-ray spectral characteristics of a sample of type II quasars which were selected based on their narrow emission lines. Because our sources were all identified exclusively on the basis of optical properties, our sample should be free of any X-ray selection bias. The four in our program were chosen as those having the greatest [OIII] flux; SDSS J0842+3625 would have been in our program but for the fact that it had already been observed in a cluster observation; the other three were observed serendipitously.
6.1. The column density distribution
All five of our type II quasars with enough counts to constrain absorption showed column densities of at least cm-2. As we will argue below on the basis of its X-ray/[OIII] luminosity ratio, we believe it likely that SDSS J0842+3625 was undetectable because its obscuration is Compton-thick. Thus, while our sample is small, we have nonetheless shown it is very likely that type II quasars are in general strongly absorbed.
Our sample can be compared to X-ray observations of nearby Seyfert II galaxies, with the caveat that archival X-ray surveys of nearby AGN suffer from an X-ray selection bias because the AGN were usually observed at least in part on the basis of their X-ray flux. In addition, it should be kept in mind that at lower luminosities the soft X-ray band can be dominated by starburst emission. Several such surveys exist in the literature.
In an ASCA survey of Seyfert II galaxies, Turner et al. (1997) found somewhat steeper continua, but very similar column densities, to those encountered in our sample: the mean power-law index and absorbing column in their study were and . However, often the absorbed power law fits were poor. Fitting their data with more complex models, such as partial covering with neutral or ionized material, a thermal plasma component (representing starburst emission below 2 keV), or reflection (off neutral, Compton-thick material out of the line of sight), improved the fits. In the case of partial covering by neutral material, the mean photon index increased to and the mean column density increased to , although in a number of cases a double power-law model (in which the two power-laws were allowed to have different slopes and the absorption for one power-law was fixed at the Galactic value) provided better fits.
Risaliti (2002) presented a BeppoSAX survey of Compton-thin Seyfert II galaxies, where the simplest model fit to the data was a double power-law model. The mean spectral index and column density (for the absorbed power-law) from this analysis were and , similar to the ASCA results. Note that the partial-covering fits to the ASCA data resulted in a slightly steeper slope () than found here, probably due to the inclusion of PDS data at higher energies, where reflection effects become significant.
The previous work most nearly comparable to ours was that of Risaliti et al. (1999), who studied the X-ray column density distribution of a sample of type II Seyfert galaxies, likewise selected on the basis of [OIII] flux. These authors found that 75% had column densities cm-2 and 50% were Compton-thick. Thus, if anything, the evidence in hand suggests that while the incidence of absorption in type II Seyferts and quasars is similar, its thickness may be somewhat greater in the Seyferts. However the statistics are very limited and a larger sample is necessary to confirm the trend and to determine whether this contrast (if real) is primarily due to luminosity or redshift.
6.2. Spectral slopes
We were able to constrain the continuum slope in four objects and achieve an acceptable fit for three of the spectra. As we have already remarked, in general we find rather harder continuum slopes than are commonly found in type I AGN, whether Seyfert galaxies or quasars. As mentioned in the previous subsection, our slopes are also harder than those found in previous studies of type II Seyfert galaxies.
This contrast in slopes may not be genuine. Studies of type II Seyfert galaxies with better photon statistics have shown that more complicated models than a power-law with a single absorber are often required to adequately describe the data (Turner et al., 1997).
By fitting the two objects with the best statistics with more complex spectral models, we have seen indications that these hard spectra (and possibly also our modest column densities) are indeed artifacts of fitting low signal-to-noise data with a model simpler than is appropriate. However, we do not have sufficient signal to properly test this speculation.
6.3. [OIII] emission as an indicator of X-ray luminosity
Tables 3 and 4 list the [OIII] ratios. The [OIII] luminosities of the objects in our sample are not corrected for possible reddening of the narrow-line region, since the H emission line is redshifted out of the optical range for all objects in our sample, and thus we are not able to compute the narrow-line Balmer decrement. These ratios may be compared with those found in the study of Heckman et al. (2005), who analyzed the hard X-ray and [OIII] luminosities of nearby AGN. They found that when a sample of type II Seyferts is selected by [OIII] flux, the mean [OIII] with standard deviation 1.1. All our detected objects (and the upper limit for one of our undetected objects) fall well within the extrapolation of this distribution to higher luminosities (Figure 9). In this respect, our type II quasars fall nicely in line with the behavior of type II Seyfert galaxies.

Heckman et al. (2005) found in addition that the mean X-ray/[OIII] ratio of hard X-ray-selected type II Seyferts is rather larger than when the selection is based on [OIII] flux, and is then quite similar to the ratio for similarly-selected type I Seyferts: [OIII]. The most natural interpretation of this result is that many type II Seyferts identifiable through [OIII] emission are absent from hard X-ray-selected samples, presumably because even hard X-rays are entirely blocked by Compton-thick obscuration. A similar conclusion was found by Bassani et al. (1999), where it was shown that the Fe-K emission line equivalent width in Seyfert 2 galaxies increases strongly with decreasing X-ray/[OIII] ratio, with Compton-thin AGN mostly exhibitng X-ray/[OIII] . This also suggests that the X-ray continuum is largely becoming absorbed when the observed X-ray/[OIII] ratio is low. Because our upper bound on [OIII] for SDSS J0842+3625 (assuming a column density of cm-2) is nearly two orders of magnitude below the typical ratio for hard X-ray selected AGN, we suggest that it may be such a case of Compton-thick obscuration.
In fact, although our detected objects are roughly consistent with the distribution of /[OIII] ratios for [OIII]-selected type II AGN, they fall systematically below the mean relationship for X-ray selected AGN. This, too, suggests that we may be underestimating the true absorption even in these cases.
7. Summary
Our results have in large part confirmed that the standard unification model satisfactorily describes optically-selected type II quasars. Six of the eight are strong X-ray sources, and all five with enough counts to fit spectra show substantial absorbing columns. Outstanding questions include: Is the contrast in continuum slopes that we find between typical type I quasars and these objects real? Is the column density distribution of type II AGN a function of redshift or luminosity, as hinted by this small sample? Observations of larger samples with greater signal-to-noise ratios will be necessary to make progress.
Appendix A Multi-Detector Luminosity and Column Density Limits
As discussed in Kraft et al. (1991) and Van Dyk et al. (2001), Bayesian statistics are particularly useful for the interpretation of data with low numbers of counts. We begin by computing the Bayesian posterior probability for X-ray luminosity (), column density (), photon index and background within the source aperture (), based on flat (i.e., constant) priors on and :
| (A1) |
where is the likelihood of observing total counts in the source aperture from observation , given a count estimate , and is the likelihood of observing counts in the background region (with area ) when the background estimate is in the source region (with area ). The product is over the individual observations , with each XMM detector being considered a separate observation since the responses differ. Both likelihoods are Poisson distributions. is the number of counts expected given the spectral model parameters, which is computed for the response (calculated at the position of the source) using xspec. is the assumed prior distribution of photon indices, however here we fix at the values of 1.7 and 1.4 (i.e., equivalent to a -function prior).
We estimate using an annulus around the source or a source-free region close to the source.C normalizes the posterior probability to unity. The background counts estimates are nuisance parameters which can be marginalized from the posterior (hereafter dropping the notation for the posterior):
| (A2) |
The posterior can then be used to compute confidence contours in the plane, which would be the smallest regions that encompass the desired confidence level. In practice, when we have an upper limit on the count rate, the most probable values will be near the highest allowed and lowest allowed , and the confidence contour will be unbounded.
References
- Abazajian et al. (2003) Abazajian, K., et al. 2003, AJ, 126, 2081
- Abazajian et al. (2004) Abazajian, K., et al. 2004, AJ, 128, 502
- Abazajian et al. (2005) Abazajian, K., et al. 2005, AJ, 129, 1755
- Antonucci (1993) Antonucci, R. 1993, ARA&A, 31, 473
- Barger et al. (2003) Barger, A.J., et al. 2003, 126, 632
- Barger et al. (2005) Barger, A.J., et al. 2005, AJ, 129, 578
- Bassani et al. (1999) Bassani, L., Dadina, M., Maiolino, R., et al. 1999, ApJS, 121, 473
- Caccianiga et al. (2004) Caccianiga, A. et al. 2004, A&A, 416, 901
- Cash (1979) Cash, W. 1979, ApJ, 228, 939
- Comastri (2004) Comastri, A. 2004, in Supermassive Black Holes in the Distant Universe, ed. A.J. Barger (Dordrecht, The Netherlands: Kluwer), 245
- Crawford & Vanderriest (1996) Crawford, C.S. & Vanderriest, C. 1996, MNRAS, 283, 1003 Lub, J. 1987, A&AS, 70, 95
- Della Ceca et al. (2004) Della Ceca, R., et al. 2004, A&A, 428, 383
- Dickey & Lockman (1990) Dickey, J.M. & Lockman, F.J. 1990, ARA&A, 28, 215
- Franceschini et al. (2000) Franceschini, A., Bassani, L., Cappi, M., Granato, G. L., Malaguti, G., Palazzi, E., & Persic, M. 2000, A&A, 353, 910
- Ghisellini, Haardt & Matt (1994) Ghisellini, G., Haardt, F., & Matt, G. 1994, MNRAS, 267, 743
- Haas et al. (2004) Haas, M., et al. 2004, A&A, 419, L49
- Hao et al. (2005) Hao, L., et al. 2005, AJ, 129, 1795
- Heckman et al. (2005) Heckman, T., et al. 2005, ApJ, submitted
- Hines & Wills (1993) Hines, D.C. & Wills, B.J. 1993, ApJ, 415, 82
- Hornschemeier et al. (2001) Hornschemeier, A., et al. 2001, ApJ, 554, 742
- Jansen et al. (2001) Jansen, F. et al. 2001, A&A, 365, L1
- Iwasawa et al. (2001) Iwasawa, K., Fabian, A.C, Ettori, S. 2001, MNRAS, 321, L15
- Jimenez-Bailon et al. (2005) Jimenez-Bailon, E., Piconcelli, E., Guainazzi, M., Schartel, N., Rodriquez-Pascual, P., & Santos-Lleo, M. 2005, A&A, 435, 449
- Kauffmann et al. (2004) Kauffmann, G., et al. 2004, MNRAS, 353, 713
- Kleinmann et al. (1988) Kleinmann, S.G., Hamilton, D., Keel W.C., Wynn-Williams, C.G., Eales, S.A., Becklin, E.E., & Kuntz, K.D. 1988, ApJ, 328, 161
- Kraft et al. (1991) Kraft, R.P., Burrows, D.N., & Nousek, J.A. 1991, ApJ, 374, 344
- Krolik, Madau, & Zycki (1994) Krolik, J., Madau, P. & Zycki, P. 1994, ApJ, 420, L57
- Lacy et al. (2004) Lacy, M., et al. 2004, ApJS, 154, 166
- Osterbrock (1989) Osterbrock, D. E. 1989, Astrophysics of Gaseous Nebulae and Active Galactic Nuclei (Mill Valley: University Science Books)
- Martinez-Sansigre et al. (2005) Martinez-Sansigra, A. et al. 2005, Nature, in press, astro-ph/0505486
- Matt (2002) Matt, G. 2002, Phil.Trans.Roy.Soc.Lond., A360, 2045
- Nandra et al. (1997) Nandra, K., George, I., Mushotzky, R., Turner, T., & Yaqoob, T. 1997, ApJ, 488, L91
- Nandra et al. (2005) Nandra, K., et al. 2005, MNRAS, 356, 568
- Ptak & Griffiths (2003) Ptak, A. & Griffiths, R. 2003, in ASP Conf. Ser. 295, Astronomical Data Analysis Software and Systems XII, eds. H.E. Payne, R.I. Jedrzejwski, & R.N. Hook (San Francisco: ASP), 465
- Reeves & Turner (2000) Reeves, J. & Turner, M. 2000, MNRAS, 316, 234
- Revnivtsev et al. (2004) Revnivtsev, M., Sazonov, S., Jahoda, K., & Gilfanov, M. 2004, A&A, 418, 927
- Risaliti et al. (1999) Risaliti, G., Maiolino, R. & Salvati, M. 1999, ApJ, 522, 157
- Risaliti (2002) Risaliti, G. 2002, A&A, 386, 379
- Risaliti & Elvis (2005) Risaliti, G. & Elvis, M. 2005, ApJ, 629, L17
- Sazonov & Revnivtsev (2004) Sazonov, S. & Revnivtsev, M. 2004, A&A, 423, 469
- Sazonov et al. (2004) Sazonov, S., Churazov, E., Revnivtsev, M., Vikhlinin, A., & Sunyaev, R. 2005, A&A, submitted, astro-ph/0508593
- Severgnini et al. (2005) Severgnini, P. et al. 2005, A&A, 431, 87
- Stern et al. (2004) Stern, D., et al. 2004, ApJ, submitted, astro-ph/0410523
- Stoughton et al. (2002) Stoughton, C., et al. 2002, AJ, 123, 485
- Szokoly et al. (2004) Szokoly, G.P., et al. 2004, ApJS, 155, 271
- Tozzi et al. (2005) Tozzi, P. et al. 2005, ApJ, submitted
- Turner et al. (1997) Turner, T., George, I., Nandra, K., & Mushotzky, R. 1997, ApJS, 113, 23
- Urry (2004) Urry, C. M. 2004, in ASP Conf. Ser. 311, AGN Physics with the Sloan Digital Sky Survey, eds. G.T. Richards & P.B. Hall (San Francisco: ASP), 49
- Vignali et al. (2004) Vignali, C., Alexander, D.M., & Comastri, A. 2004, MNRAS, 354, 720
- Voges et al. (1999) Voges, W. et al. 1999, A&A, 349, 389
- Weisskopf et al. (2002) Weisskopf, M. C., Brinkman, B. Canizares, C.; Garmire, G., Murray, S., Van Speybroeck, L. P. 2002, PASP, 114, 1
- Yaqoob (1997) Yaqoob, T. 1997, ApJ, 479, 184
- York et al. (2000) York, D.G., et al. 2000, AJ, 120, 1579
- Zakamska et al. (2003) Zakamska, N.L., et al. 2003, AJ, 126, 2125 (Paper I)
- Zakamska et al. (2004) Zakamska, N.L., Strauss, M.A., Heckman, T.M., Ivezić, Ž., & Krolik, J.H. 2004, AJ, 128, 1002
- Zakamska et al. (2005) Zakamska, N.L., et al. 2005, AJ, 129, 1212
| J2000 | Galactic | Observation | Exposure | Date | off-axis | ||
|---|---|---|---|---|---|---|---|
| coordinates | ( cm-2) | z | [OIII]/ | ID | (ks) | mm/dd/yy | angle (′) |
| SDSS J011522.19+001518.5 | 3.4 | 0.390 | 8.14 | Chandra-3204 | 37.6 | 11/01/02 | 2.0 |
| SDSS J021047.01100152.9 | 2.2 | 0.540 | 9.79 | XMM-0204340201 | 9.7(P),11.6(M1),11.6(M2) | 01/12/04 | |
| SDSS J024309.79+000640.3 | 3.6 | 0.414 | 7.95 | XMM-0111200101 | 35.3(P),38.7(M1),35.6(M2) | 07/29/00 | 10.8 |
| XMM-0111200201 | 33.0(P),37.8(M1),34.9(M2) | 07/30/00 | 10.4 | ||||
| SDSS J080154.24+441234.0 | 4.8 | 0.556 | 9.58 | Chandra-5248 | 9.8 | 11/27/03 | |
| SDSS J084234.94+362503.1 | 3.4 | 0.561 | 10.10 | Chandra-532 | 7.3 | 10/21/99 | 5.4 |
| SDSS J122656.48+013124.3 | 1.8 | 0.732 | 9.66 | XMM-0110990201 | 9.0(P),15.3(M1),15.4(M2) | 06/23/01 | 6.0 |
| SDSS J123215.81+020610.0 | 1.8 | 0.480 | 9.69 | Chandra-4911 | 9.5 | 04/20/05 | |
| SDSS J164131.73+385840.9 | 1.2 | 0.596 | 9.92 | XMM-0204340101 | 12.2(P),16.8(M1),17.1(M2) | 08/20/04 |
Note. — J2000 coordinates, redshifts and [OIII]5007Å luminosities are from Paper I. The Galactic absorption was derived from the HI map by Dickey & Lockman (1990) using the nh tool provided by the HEASARC. For XMM-Newton observations, the exposure times are listed separately for PN (P) and MOS1,2 (M1,2) instruments. The date of the observation is given in the next column. The off-axis angle is given in arcmin only for those four objects that were observed serendipitously. The remaining four objects were the primary targets of the observations.
| ID | Counts | /dof | [OIII] | [OIII] | ||||
|---|---|---|---|---|---|---|---|---|
| ( cm-2) | () | () | ||||||
| SDSS J0115+0015 | 339 | 2.0 (1.3-2.8) | 1.39 (1.09-1.73) | 471/523 | 0.71 | 0.82 | 134 | 155 |
| SDSS J02101001 | 300 | 2.3 (0.4-5.5) | 0.46 (-0.07 – 0.72) | 9.1/9 | 1.8 | 2.0 | 7.5 | 8.3 |
| SDSS J0243+0006 | 10 (fixed) | 1.7 (fixed) | ||||||
| SDSS J0801+4412 | 40 | 16 (9.7-27) | 1.7 (fixed) | 221.9/524**Fitting was performed using the C statistic with unbinned data. | 0.87 | 1.9 | 6.0 | 13. |
| SDSS J0842+3625 | 10 (fixed) | 1.7 (fixed) | ||||||
| SDSS J1226+0131 | 574 | 2.0 (1.4-2.7) | 1.41 (1.16-1.69) | 28.1/25 | 4.0 | 4.6 | 23 | 26 |
| SDSS J1232+0206 | 5.7 | 10 (fixed) | 1.7 (fixed) | 0.25 | 0.45 | 1.3 | 2.4 | |
| SDSS J1641+3858 | 1624 | 2.8 (2.2-3.4) | 1.33 (1.19-1.51) | 113.5/77 | 5.7 | 6.7 | 18. | 21 |
Note. — The counts given in the case of XMM data are the net counts from the three detectors combined. In the case of SDSS J0243+0006, no counts value is given since the upper limit on counts combined from disparate detectors is not meaningful. The errors on fit parameters (hydrogen column density at the redshift of the source) and (photon index, ) are based on . is the rest-frame keV luminosity and is the rest-frame keV luminosity after correction for absorption.
| ID | /dof | / | [OIII]/[OIII] | ||||
|---|---|---|---|---|---|---|---|
| ( cm-2) | ( cm-2) | () | |||||
| SDSS J1226+0131 | 3.6 (3.1-5.1) | 87 (53-150) | 2.83 (1.96-3.81) | 0.091 | 19.6/23 | 4.0 / 40. | 23 / 230 |
| SDSS J1641+3858 | 0.41 (0.10-1.8) | 4.6 (3.4-8.7) | 1.56 (1.39-1.78) | 0.071 | 99.8/75 | 5.7 / 7.6 | 17.9 / 23.8 |
Note. — Results of fitting a model consisting of two absorbers plus a power-law to the highest signal-to-noise ratio spectra. The quantity is the fraction of flux intercepted by the absorber with the lower column density. See text for details.