Radio Bubbles in Clusters of Galaxies
Abstract
We extend our earlier work on cluster cores with distinct radio bubbles, adding more active bubbles, i.e. those with radio emission, to our sample, and also investigating “ghost bubbles,” i.e. those without radio emission. We have determined , which is the ratio of the total particle energy to that of the electrons radiating between and . Constraints on the ages of the active bubbles confirm that the ratio of the energy factor, , to the volume filling factor, lies within the range . In the assumption that there is pressure equilibrium between the radio-emitting plasma and the surrounding thermal X-ray gas, none of the radio lobes has equipartition between the relativistic particles and the magnetic field. A Monte-Carlo simulation of the data led to the conclusion that there are not enough bubbles present in the current sample to be able to determine the shape of the population. An analysis of the ghost bubbles in our sample showed that on the whole they have higher upper limits on than the active bubbles, especially when compared to those in the same cluster. A study of the Brightest 55 cluster sample shows that 17, possibly 20, clusters required some form of heating as they have a short central cooling time, , and a large central temperature drop, . Of these between 12 (70 per cent) and 15 (75 per cent), contain bubbles. This indicates that the duty cycle of bubbles is large in such clusters and that they can play a major role in the heating process.
keywords:
galaxies: clusters: general – X-rays: galaxies: clusters1 Introduction
Radio lobes which emit synchrotron radiation contain relativistic electrons and magnetic fields and tradiationally equipartition (minimum energy) has been assumed to obtain the pressures of each component (Burbidge, 1959), When the radio source is found in a cluster the radio emitting lobes can correspond to decrements in the X-ray emission, which have been interpreted as bubbles in the Intra Cluster Medium (ICM). This allows the degeneracy to be removed by measuring the thermal pressure of the ICM and assuming pressure equilibrium between these bubbles and the surrounding X-ray gas. The lack of strong shocks supports the assumption that the bubbles are not strongly overpressured. Many moderate power radio sources in low redshift clusters imaged with Chandra show holes in the X-ray emission (e.g. Hydra A, (McNamara et al., 2000); Perseus, (Fabian et al., 2000); A2052, (Blanton et al., 2001); A2199, (Johnstone et al., 2002); Centaurus, (Sanders & Fabian, 2002)), the first of which was discovered in the Perseus cluster with ROSAT (Böhringer et al., 1993). Recent compilations were given by Bîrzan et al. (2004) and Dunn & Fabian (2004).
Here we perform a follow up study, extending the sample out to higher redshifts where possible, and also including some nearby ellipticals which harbour radio sources and have bubble-like structures observed in the X-ray emission as well as known cluster ghost bubbles. We attempt to include all bubbles for which both the X-ray data available to us shows clearly evident bubbles and where there is high resolution radio data. Following the approach first detailed in Fabian et al. (2002) and developed in Dunn & Fabian (2004), we determine in the condition of pressure balance, where is the ratio of the total relativistic particle energy to that in electrons emitting synchrotron radiation between and , and is the volume filling factor of the relativistic plasma in the bubble.
The bubbles analysed here now include ones which have no current GHz radio emission – so-called ’Ghost Lobes’ or ’Ghost Bubbles.’ In some cases these ghost bubbles occur in clusters where there are active bubbles and so the evolution of the bubbles’ within one cluster can be traced. The distribution of the limits on is also extended and the suggestion that the underlying population distribution is bimodal (Dunn & Fabian, 2004) is no longer present in these extended data; however the wide spread in remains.
In Section 2 we describe the calculations and assumptions used to obtain upper limits on and in Section 3 we give the basic results from this analysis. The present sample is combined with that presented in Dunn & Fabian (2004) in Section 4 where the Monte-Carlo simulations are considered along with the effect of the shape of electron energy spectrum. The results from the analysis of the ghost bubbles are presented in Section 5 and an analysis of the number of bubbles present in clusters is described in Section 6. Our conclusions are presented in Section 7. We use throughout.
2 Data Analysis
We follow the analysis presented in Dunn & Fabian (2004) and Fabian et al. (2002) to quantify the properties of the particles present in the bubbles using standard synchrotron theory. We give some of the relevant formulae below; for full details of the calculations see Dunn & Fabian (2004).
The total energy in a bubble which is emitting synchrotron radiation between and , with a spectral index () is given by
where is the energy in relativistic electrons and is the bubble volume (). is the factor which accounts for additional energy from particles accompanying those inferred from the synchrotron emission and electron energy distribution, and is the volume filling fraction of the relativistic plasma.
For simple equipartition between the energy in particles and that in the bubbles, the magnetic field strength is
Relaxing the condition for equipartition and assuming that there is pressure equilibrium between the relativistic gas and the thermal ICM surrounding the bubbles then can be calculated from
| (1) |
where the pressure, , was obtained from temperature and density profiles of the cluster.
The minimum value for which is for an electron-positron plasma which fills all of the bubble. A maximum value for can be determined by differentiating Equation 1 with respect to , giving , which is per cent greater than the equipartition value. The field for is the limit up to which the in Equation 1 term can be ignored. Further increases in causes this term to become dominant and decreases until it equals one. At this point the magnetic field is 1.53 times greater than the magnetic field at , and 1.15 times the equipartition magnetic field.
Any further increase in the magnetic field and the magnetic pressure would be such that the bubble would be over pressured, even with . Hence for pressure equilibrium fewer particles than observed would be required. One explanation of this is that the assumptions of the electron energy spectrum used are wrong, see Section 4.2.
As there is current radio emission observed throughout the bubble, the synchrotron cooling time of the relativistic electrons can be used to estimate the ages of the bubbles.
As there are no strong shocks observed in the ICM of these clusters, the bubbles must expand slower than the sound speed. Therefore the age of the bubbles must be greater than where is the radius of the bubble.
Detached bubbles have been observed in a variety of clusters, and they are assumed to rise upwards at their buoyancy velocity, , where is the cross-sectional area of the bubble, is the volume, for the bubble (centre) being at from the cluster core and is the drag coefficient (Churazov et al., 2001). Therefore the age of the bubble can be estimated as , the travel time to their current position. The age of the bubble can also be estimated from the time required to refill the displaced volume as the bubble rises upward (McNamara et al., 2000), .
The value obtained for the magnetic field from the bubble timescale shows whether the equipartition solution is possible. The limits obtained for may be higher than the one predicted for equipartition as the equipartition condition is determined from the magnetic field strength; Fig 7. of Fabian et al. (2002) shows that it is possible that limits on are larger than the equipartition value even though the magnetic field is less than its equipartition value.
From observations of the H filaments in the Perseus cluster the flow behind the western “ghost” bubble has been assumed to be laminar (Fabian et al., 2003b). This implies a Reynolds number of less than 1000, and a value of was obtained for the kinematic viscosity. The Reynolds number, , was calculated for each bubble analysed, assuming the viscosity was the above value, and also a lower bound on the viscosity was calculated from the limit on the Reynolds number of 1000 assuming that the flow is laminar in each cluster.
2.1 Ghost Bubbles
Ghost Bubbles are those which do not have any current GHz radio emission, the clearest examples being those found in Perseus. These were analysed in Dunn & Fabian (2004), but were not included in any of the conclusions presented there, nor were the results interpreted at any great length. In this work a larger number of ghost bubbles have been analysed, though the numbers of them are still small.
In some cases archival low frequency radio data from the Very Large Array (VLA) of the NRAO111The National Radio Astronomy Observatory is operated by Associated Universities, Inc., under cooperative agreement with the National Science Foundation. with sufficient resolution has been obtained in order to obtain the radio fluxes of regions corresponding to these bubbles at . If this has not been possible, then the value obtained for the region of interest at frequencies has been used as an upper limit. Those sources which have low frequency measurements are indicated in Table 1. In A2597 (Clarke et al., 2005) and the Perseus cluster (Fabian et al., 2002) spurs of low-frequency radio emission extend into some of the ghost bubbles.
The Perseus Halo analysed here results from the interpretation of a high abundance ridge, which corresponds to the edge of the mini-halo emission, as an ancient bubble (Sanders et al., 2005). There is no clear depression in the X-ray emission, but the interpretation that this high-abundance gas has been pushed out of the centre of the cluster by a buoyantly rising bubble is plausible. There is, of course, the possibility that this feature is not the result of a bubble and is due to some other phenomenon.
| Cluster | Lobe(1) | Redshift | References | |||||||
| (kpc) | (kpc) | (kpc) | ( | (keV) | () | |||||
| Active Bubbles | ||||||||||
| 3C401 | N, R | 0.2010 | 25.0 | 22.0 | 14.0 | 4.40 | 2.9 | 0.0062 | 1 | |
| S, R | 34.0 | 23.0 | 13.0 | 8.80 | 2.9 | 0.0050 | ||||
| 4C55.16 | N, R | 0.24 | 26.5 | 11.2 | 14.3 | 3.0 | 2.8 | 0.052 | 2, 3,4 | |
| S, R | 31.9 | 17.4 | 14.4 | 4.1 | 3.0 | 0.042 | ||||
| A262 | E, R | 0.016 | 5.78 | 4.93 | 2.72 | 0.61 | 1.2 | 0.021 | 5,6, 7, 8, 9 | |
| W, R | 4.75 | 4.75 | 2.82 | 0.50 | 1.2 | 0.021 | ||||
| A478 | NE, R | 0.088 | 2.20 | 2.20 | 2.20 | 1.1 | 2.0 | 0.10 | 9,10 | |
| SW, R | 3.40 | 3.40 | 3.40 | 1.1 | 2.0 | 0.10 | ||||
| A1795 | NW, R | 0.063 | 3.80 | 4.10 | 3.10 | 0.12 | 2.7 | 0.060 | 11, 12, 13, 14 | |
| S, R | 5.20 | 4.80 | 2.80 | 0.20 | 2.7 | 0.060 | ||||
| A2029 | NW, R | 0.077 | 9.36 | 7.20 | 2.16 | 0.30 | 4.0 | 0.076 | 13, 15, 16,17 | |
| SE, R | 9.36 | 6.48 | 2.88 | 0.30 | 4.0 | 0.076 | ||||
| M87 | E-CJ, R | 0.004 | 1.50 | 1.70 | 1.30 | 0.080 | 1.6 | 0.20 | 13, 18 | |
| NGC4472 | E, R | 0.004 | 4.03 | 2.09 | 1.55 | 0.20 | 0.82 | 0.0590 | 19,20,21 | |
| W, R | 3.18 | 2.09 | 1.71 | 0.20 | 0.76 | 0.0800 | ||||
| NGC4636 | NE, R | 0.004 | 0.67 | 0.54 | 0.32 | 0.010 | 0.60 | 0.1100 | 19,22,23 | |
| SW, R | 0.65 | 0.62 | 0.25 | 0.010 | 0.60 | 0.1100 | ||||
| Ghost Bubbles | ||||||||||
| A85 | N, X | 0.0555 | 14.0 | 5.260 | 7.00 | 5.7 | 3.0 | 0.055 | 24,25 | |
| S, X | 22.0 | 6.42 | 8.64 | 8.9 | 3.0 | 0.040 | ||||
| A2597 | NE, X | 0.083 | 21.0 | 7.80 | 7.80 | 3.7 | 2.2 | 0.050 | 9,13,26,27,28,29 | |
| SW, X | 25.0 | 12.0 | 7.80 | 4.5 | 2.3 | 0.050 | ||||
| Centaurus 3 | N,X | 0.0104 | 6.1 | 3.5 | 3.0 | 0.4 | 1.5 | 0.03 | 13,30 | |
| Perseus Ghost | W, X | 0.018 | 28.0 | 3.30 | 14.0 | 2.0 | 3.2 | 0.033 | 13,31,32, 33 | |
| S, X | 36.0 | 7.00 | 12.0 | 2.9 | 3.6 | 0.027 | ||||
| Perseus Halo | SW, R | 0.018 | 73.0 | 19.0 | 15.0 | 9.3 | 4.7 | 0.016 | 33 | |
| RBS797 | W, X | 0.354 | 40.0 | 20.0 | 20.0 | 4.0 | 4.0 | 0.21 | ||
| E, X | 40.0 | 20.0 | 20.0 | 4.0 | 4.0 | 0.21 | 34,35 | |||
References:
1. Reynolds et al. (2005) 2. Iwasawa et al. (2001); 3. Iwasawa et al. (1999); 4. Taylor, G.B., unpublished.; 5. Blanton et al. (2004); 6. Parma et al. (1986); 7. Fanti et al. (1987); 8. White (2000); 9. Reiprich & Böhringer (2002); 10. Sun et al. (2003); 11. Ettori et al. (2002); 12. Voigt & Fabian (2005); 13. Taylor et al. (2002); 14. Fabian et al. (2001); 15. Clarke et al. (2004); 16. Taylor et al. (1994); 17. Lewis et al. (2003); 18. Forman et al. (2003); 19. Kronawitter et al. (2000) 20. Ohto et al. (2003) 21. Jones et al. (2002) 22. Ekers & Kotanyi (1978) 23. Biller et al. (2004) 24. Durret et al. (2005a) 25. Durret et al. (2005b) 26. McNamara et al. (2001); 27. Sarazin et al. (1995); 28. Clarke et al. (2005); 29. Pollack et al. (2005); 30. Fabian et al. (2005); 31. Fabian et al. (2003a); 32. Fabian et al. (2003b); 33. Sanders et al. (2005); 34. Schindler et al. (2001); 35. de Filippis et al. (2001).Notes:
(1) The codes for the Lobes are N—Northern, S—Southern, E—Eastern, W—Western etc. , X—sizes from X-ray image, R—sizes from Radio image. CJ—Counter Jet cavity in M87.
(2) All the values given in the above table except the radio power have an uncertainty associated with them. Except for the spectral index, they are not quoted as they have limited effect on the calculated values. The effect of the uncertainties in on the resultant uncertainties in is large and so are stated here. For further discussion see text.
(3) The sources in italics have radio data at .
3 Results
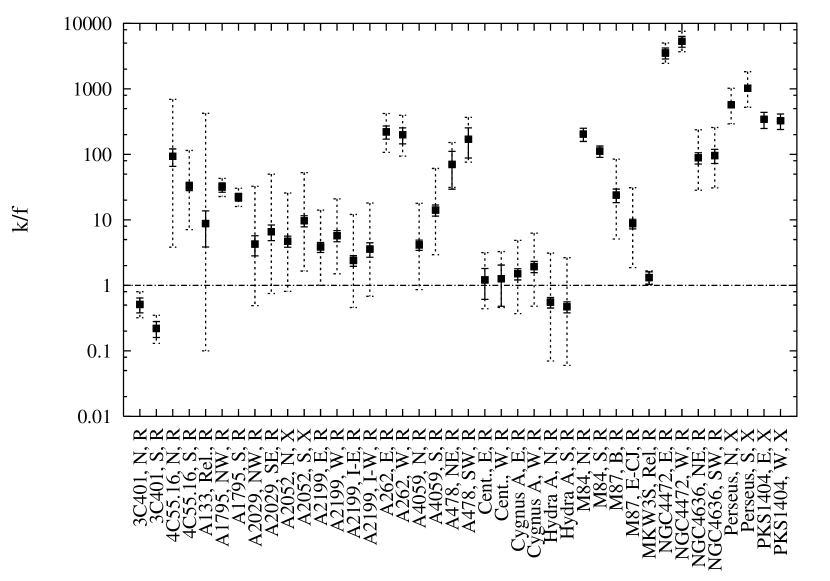
The individual source parameters are listed in Table 1, and the resulting values for in Table 2. The uncertainties presented for the upper limit on the values of arise from uncertainties in the spectral index, , of the radio emission from the bubble. As appears as the exponent in the equation for the energy in synchrotron emitting elections, any uncertainty in its value has a large effect on the range of allowed values. In some cases a value has not been able to be determined accurately, resulting in the choice of a range which is large enough to encompass most of the plausible values. In Fig. 1 the solid error bars show the range of values for the upper limit on which arise from uncertainties in all other parameters used, and they are on the whole, less than the ones resulting from uncertainties in (dotted error bars).


In this sample there is good agreement between limits on from different timescale (Fig. 2). Any disagreement between the limits arises from the differences in the timescales calculated for the bubbles (for further discussion see Section 3.1). In this sample only A1795 and A478 had radio images at two frequencies analysed, and the agreement between the limits obtained at the different frequencies is very good. The agreement between bubbles within one cluster is also very good.
Some limits on fall below the line corresponding to the minimum possible , e.g. 3C401 here and Hydra A in Dunn & Fabian (2004). The interpretation of is that for pressure balance fewer particles than those observed are required, which could be as a result of using an inaccurate form of the electron energy spectrum (Section 4.2). In Hydra A the radio source seems to have blown very large cavities in the ICM (Nulsen et al., 2004), and so it may be over-pressured. As such the assumptions used in the calculation of the limits may not hold. In 3C401 although there is evidence for interaction between the radio source and the ICM (Reynolds et al., 2005), there are no clear cavities in the X-ray emission, however the central regions of the cluster are not spherically symmetric, and the bar of X-ray emission could be as a result of cavities in the cluster. As such the uncertainties in the limit on are probably larger than shown.
3.1 Timescales
The differences between the methods for estimating the timescales (ages) of the lobes are important in this sample. The sound-speed timescale is the timescale for the expansion of the bubble at a speed less than the sound speed of the medium it is observed to be in currently, as there are no strong shocks observed at the edges of the bubbles. However it is possible that the expansion is still slightly supersonic; Blanton et al. (2001) state that in A2052 speeds of up to are allowed if there are not strong shocks. Also, as the bubbles are assumed to be created from a relativistic jet, there would have been some supersonic expansion in the past. This timescale estimate is probably the most appropriate one for the young, powered bubbles. Some sources, especially those with hotspot emission, e.g. Cygnus A, are likely to be expanding much faster than the local sound speed. In this case the sound speed timescale would be much too small and the upper limit on would rise significantly.
The buoyancy timescale is the time taken for a bubble of the observed size to rise buoyantly to its current position in the cluster assuming a uniform medium, with properties as observed at its current location. However, as the bubble is likely to be expanding as it is rising, as well as the fact that the medium is non-uniform, means that there are some uncertainties on this timescale beyond those arising from the uncertainties in the measured parameters. This timescale is probably the most appropriate for the ghost bubbles, which presumably have detached from the jet that formed them a long time ago and so are rising buoyantly. The refilling timescale is also a rise-time-like timescale, as it gives the time taken to refill the displaced volume. Some of the ghost bubbles are at a much larger distance from the centre of the cluster than young ones, but they are not that much larger in radius.
These differences in the type of timescales calculated can explain the fact that, for example, the sound speed timescales for the Perseus Ghost bubbles and the Halo are much less than the other two estimates. The sound speed timescale measures the expansion of the ghost bubble at the sound speed of the medium, which increases as the temperature (and hence distance from the centre of the cluster) increases.
The form for the synchrotron lifetime is only valid for sufficiently large magnetic fields. Inverse Compton (IC) losses dominate when the energy density of the Cosmic Microwave Background exceeds that of the magnetic field, , which corresponds to . Although all the clusters analysed are in the local Universe, it was checked whether the inferred magnetic field was larger than . The lifetime determined from this limiting magnetic field for electrons () was also calculated and is tabulated in the Appendix. The only cluster where any timescale exceeds the value of is RBS797 for the refilling timescale estimate.
| Cluster | Lobe(1) | Pressure | Viscosity(2) | Energy(3) | |||||
| Active Bubbles | |||||||||
| 3C401 | N, R | 39.6 | 1938 | 7.75 | 3.36 | 1.72 | |||
| S, R | 31.9 | 1990 | 7.96 | 2.44 | 0.65 | ||||
| 4C55.16 | N, R | 320 | 879 | 3.54 | 14.4 | 776 | |||
| S, R | 277 | 1227 | 4.91 | 19.7 | 364 | ||||
| A262 | E, R | 55.4 | 301 | 1.20 | 0.040 | 352 | |||
| W, R | 55.4 | 330 | 1.32 | 0.041 | 308 | ||||
| A478 | NE, R | 440 | 471 | 1.88 | 0.092 | 177 | |||
| SW, R | 440 | 585 | 2.34 | 0.34 | 653 | ||||
| A1795 | NW, R | 356 | 190 | 0.76 | 0.28 | 107 | |||
| S, R | 356 | 191 | 0.76 | 0.26 | 88.4 | ||||
| A2029 | NW, R | 669 | 153 | 0.61 | 0.44 | 33.1 | |||
| SE, R | 669 | 170 | 0.68 | 0.71 | 45.8 | ||||
| M87 | E-CJ, R | 704 | 106 | 0.42 | 0.040 | 26.8 | |||
| NGC4472 | E, R | 106 | 83 | 0.33 | 0.011 | 4807 | |||
| W, R | 134 | 115 | 0.45 | 0.016 | 8727 | ||||
| NGC4636 | NE, R | 145 | 12.6 | 0.051 | 61.5 | ||||
| SW, R | 145 | 12.4 | 0.050 | 71.0 | |||||
| Ghost Bubbles | |||||||||
| A85 | N, X | 363 | 758 | 3.03 | 1.86 | 19462 | |||
| S, X | 264 | 802 | 3.21 | 2.46 | 40635 | ||||
| A2597 | NE, X | 242 | 604 | 2.41 | 2.3 | 268109 | |||
| SW, X | 253 | 801 | 3.20 | 3.6 | 445843 | ||||
| Centaurus | N,X | 99 | 58.6 | 0.23 | 0.062 | 152.7 | |||
| Perseus Ghost | W, X | 232 | 242 | 9.70 | 3.0 | 16522 | |||
| S, X | 206 | 381 | 1.52 | 4.1 | 17254 | ||||
| Perseus Halo | SW, R | 172 | 894 | 3.58 | 14.5 | 49178 | |||
| RBS797 | W, X | 1848 | 1353 | 5.41 | 29.2 | 920472 | |||
| E, X | 1848 | 1353 | 5.41 | 29.2 | 920472 | ||||
Notes:
(1) The codes for the Lobes are N—Northern, S—Southern, E—Eastern, W—Western etc., X—sizes from X-ray image, R—sizes from Radio image. CJ—Counter Jet cavity in M87.(2) The viscosity is estimated assuming that the flow is laminar and has a Reynolds number of
(3) The energy quoted here is , so the values have to be multiplied by the appropriate .
(4) The range on the limits on from the uncertainty in the spectral index are given by the maximum values (superscript) and minimum values (subscript). The uncertainties from other parameters are shown in Fig. 1.
3.2 NGC4472
NGC 4472 is an elliptical galaxy in the Virgo Cluster. As can be seen from Fig. 1 the value is much higher (by a factor of 10) than the other new clusters, and from Fig. 4 is much higher than all of the clusters in the sample. The radio emission seen from the radio source at the centre of NGC 4472 is only just above the background, and as such the bubbles may be more akin to Ghost rather than Active ones. The results for this galaxy are still included with the active bubbles in the subsequent analysis as there is still current radio emission from the lobes.
4 Discussion
As can be seen in Fig. 1, the spread in the upper limits on reported in Dunn & Fabian (2004) is also present in these bubbles. As in Dunn & Fabian (2004), the limits placed on the magnetic field during the course of this calculation means that there cannot be simple equipartition between the particles and the field present in the bubble. The magnetic fields estimated from the sound speed timescale are times the equipartition values. If the particles and field present in the bubbles were in equipartition, then the pressure in the bubbles would be much less than the pressure from the surrounding ICM, ranging from 1.5 times (Centaurus) to 160 times (Perseus) too low, with an average of around 20 times. Radio sources in clusters often appear distorted, confined and have steep spectra, which argues for conditions close to pressure equilibrium. Interactions may have increased the internal pressure of these sources (Pollack et al., 2005).
Recent studies of radio galaxies which are not in cluster environments also imply that the radio lobes are not at equipartition. Croston et al. (2003) amongst others find that the pressure of the lobes are too low if equipartition is assumed, if and , the lobes being under-pressured by ; Hardcastle & Worrall (2000) state that there is little concrete evidence for the assumption that the radio lobes are near to their minimum pressures. Inverse Compton X-ray emission would allow a check as to whether lobes were at or close to equipartition, but the emission from several sources (e.g. 3C120, Harris et al. 1999) is inconsistent with being at equipartition. The presence of the ICM, constraining the expansion of the lobes may cause the energy in particles to dominate over the energy in the magnetic field.
4.1 Total Sample
Combining the data from the sample presented here with that from Dunn & Fabian (2004) allows confirmation that there appears to be no strong correlation between and any physical parameter of the cluster or radio source for bubbles from different clusters. There is a possibility that the Rotation Measure (RM) of the radio source may give some indication of (Fig. 3). However not all of the bubbles in the sample have values for the Rotation Measure of their radio source and there is a large scatter in for a given Rotation Measure. The radio source 3C84 in the Perseus Cluster is completely depolarised and as such the rotation measure is expected to be large, yet it has a high so it would not fit the the trend implied by Fig. 3.
Recent measurements of the Rotation Measure of A2597 by Pollack et al. (2005) give values for the inner radio source of . The for the outer ghost bubbles is which, if the rotation measure were the same for both, sits far above the other sources in Fig. 3. As the Rotation Measure of the radio source probes the surrounding ICM, so higher RMs indicate higher cluster magnetic fields and/or densities. A higher external magnetic field could contribute to the pressure acting on the bubbles, but the thermal pressure will dominate. If the RM comes from the magnetic field in the ICM, then it will also depend on the impact parameter through the cluster. Deeply embedded, new, bubbles will acquire high RMs and those which have risen up would acquire lower RMs. In this case, as the bubbles rise up through the ICM, their increases (see Section 5) and the RM decreases. This interpretation may be the explanation for the location of the points in Fig. 3, and as such there is no direct correlation between and RM. Also, an RM measured in the center of the cluster towards a relatively young source may not have much to do with an old outer bubble from the same source.

As there is a large variation in physical parameters between clusters, any correlation that might have with any given parameter could be wiped out by inter-cluster differences in other parameters. To try and remove this effect, the values for the distance of the bubble from the cluster centre (), the timescales, the luminosities and the temperature of the ICM surrounding the bubbles were scaled using values for , , and from Peres et al. (1998), converted to our cosmology. However, there were no resultant clear correlations.
Fig. 4 shows the limits for all the active bubbles in the combined sample. The frequency distribution of is shown in Fig. 5. It can be clearly seen from the frequency distribution that a single population is the most likely explanation of the data. This is contrary to what was presented in Dunn & Fabian (2004). The binning presented in Fig. 5 does not take into account the uncertainties present on .
For many of the clusters analysed here, there are two bubbles per cluster, and hence two limits on . For a statistical analysis this poses a problem as the two limits are not independent as they are drawn from the same cluster. To remove this difficulty a “cluster-average” was created for each cluster. If there are two bubbles per cluster then the two values for all the quantities calculated during the course of the analysis were averaged. The uncertainties on the values were also just averaged. The resultant data were then binned up as before. It was also checked at this stage as to whether this “double counting” could have hidden some correlation, but there was no such case. The resulting frequency distribution is shown in Fig. 6 (top).
To determine the form of underlying distribution for a Monte Carlo simulation of the data was performed to obtain errors on the frequency distribution. The resulting frequency distribution is shown in Fig. 6 (bottom).


As can be seen in the figure, there is no clear choice for a distribution of . There are only 20 clusters (the Inner bubble pair of A2199 are counted separately from the outer pair, making 21 in the cluster averaged data) whose values for the limit on spread over a few orders of magnitude. This limits the scope of any conclusions which can be drawn from the distribution, and many, many more bubbles would need to be added to this sample such that any underlying distribution could be determined. All that can be said from this data is that there is a definite spread in the limits on , which for bubbles with active radio emission spreads over .
This large spread in is the result of a signification population of non-relativistic particles present in some of the bubbles. The origin of these particles is unknown; one suggestion is that the jets may intrinsically contain protons when they are formed. On the other hand, if the jets produced by the central black hole are pure electron-positron, as they travel out into the ICM they may pick up material (probably thermal protons). This entrainment is stochastic, depending on the environment of the jet in the first few kpc around the radio source. This varies from cluster to cluster and as such there is a large range in the values of . It would be expected that powerful jets would punch through the ICM and not entrain much material, so ending up with lower , for example Hydra A and Cygnus A; those sources which are less powerful would pick up more material (given the same ICM). There are just too many differences in the physical conditions in clusters which result in there being no correlation with only one parameter.
We assume that has most effect on in these bubbles and that is not thought to vary much. Schmidt et al. (2002) analysed the in Perseus and rule out at the 3 sigma level of gas cooler than 11keV filling the entire hole, and at the same level, 6.5keV gas filling 1/3 of the hole. It is unlikely that will change much during the evolution of the bubble as even though the electrons age, they are still relativistic.
4.2 Low-Energy Electron Population & Spectral Indices
As was discussed in Dunn & Fabian (2004) the spectral index of the radio emission is the overwhelming uncertainty on the calculated value of . The value of the spectral index is vital as it is used when extrapolating the electron energy spectrum from frequencies down to frequencies. The assumption so far has been that the spectral index is smooth between and . However it is very difficult to obtain observations with sufficient resolution at these lower frequencies, and so it is uncertain what happens to the electron population.
In ghost lobes spectral steepening as a result of spectral ageing is of importance, especially if there is no re-acceleration. The spectral indices in the Perseus ghost lobes, the mini-halo and in Centaurus are steep, , suggesting that the electrons have aged in these regions, implying that there is minimal re-acceleration present in these lobes (Fabian et al., 2005). However, this spectral index causes problems when calculating , as extrapolating the electron population with such a steep index will undoubtedly over-estimate the low energy electron population (with the assumption that the un-aged spectrum is ).
Harris (2004) discusses various possibilities for the low end of the relativistic electron spectrum:
-
1.
steepens with decreasing frequency so that extrapolation under-estimates the low energy electron population.
-
2.
remains essentially constant.
-
3.
flattens towards 0, so that there are fewer low energy electrons as are predicted by extrapolation.
-
4.
There is a low energy cut-off so that there are no low energy electrons.
We now briefly discuss the implications of these possibilities for the electron spectrum.
-
1.
If steepens with decreasing frequency then the total energy in electrons radiating between and will increase as there are more particles present. This means that will be lower than we have calculated here. This makes sense as a which is high means that the particles observed (and inferred) from the synchrotron radiation are not enough to create pressure balance with the surrounding thermal gas. If were to rise at low frequencies then we would “find” more particles and hence need fewer unobserved particles to obtain pressure balance.
-
2.
This is what has been assumed in the calculations.
-
3.
If flattens out at lower frequencies, then the energy in the synchrotron emitting particles would be less, and so would rise as from the calculated limit on as there would be the necessity for more unobserved particles to be present in the bubble in order to maintain pressure balance.
-
4.
If there was a cut-off in then this would cause to rise, but to an even greater extent than in situation 3, as there are now no low energy particles, rather than just fewer than before. Our calculations assume a low-energy cut-off of , this case is for a cut-off at higher energies than this.
Using the spectral energy distributions from the NASA/IPAC Extragalactic Database the spectral indices for most of the sources remain constant, or flatten slightly at lower frequencies. None were seen to steepen, though the data points may be for the entire source, and not just the extended emission. Most sources were detected down to , and some down to , so there does not appear to be a low-energy cut-off before . No data-points were found at lower frequencies, so the shape of the very low-energy electron population is still unclear; however the model used to quantify the energy present in synchrotron emitting particles is likely to be correct over the range it has been applied.
4.2.1 Re-acceleration
As was discussed at length in Dunn & Fabian (2004) the effect of any re-acceleration in the bubbles could be large and difficult to quantify. However, the observation that, in the case of some of the bubbles, the radio emission does not completely fill the decrement in the X-ray emission, or that the strength of the radio emission falls off towards the edge of the lobes leads to the conclusion that there is little re-acceleration in these bubbles, for example Perseus South and A2052 South. In the Centaurus Cluster the spectral index steepens towards the edge of the bubbles (Fabian et al., 2005; Taylor et al., 2002), which also implies that there is little re-acceleration as the electrons appear to have aged.
5 Ghost Bubbles

The limits on for the ghost bubbles can be lower limits as, if there is no active emission from the bubbles, the synchrotron cooling time must be shorter than the age of the bubbles. In the cases where low frequency radio emission has been used and there is some emission from the bubbles, the limit obtained on is still an upper one. With some of these bubbles there is insufficient radio data, and so the spectral index of the emission has been estimated to fit in with aged sources.
What can be seen from Fig. 7 is that all the limits are much higher than those obtained for active bubbles. This means that the oldest bubbles require more unobserved particles for pressure support than the youngest ones. Fig. 8 shows more clearly the change in with bubble age. The limits have been plotted against distance from the cluster centre rather than a timescale because of the differences in assumptions between the types of timescale (see Section 3.1). Fig. 8 (top) and Fig. 8 (bottom) show the limits for the Perseus and Centaurus Cluster respectively. Dunn & Fabian (2004) stated that they did not believe that there was any dependence of on any physical parameter of the cluster or radio source. However, when looking at a number of bubbles in a single cluster this appears not to be the case; appears to rise as the bubbles age.
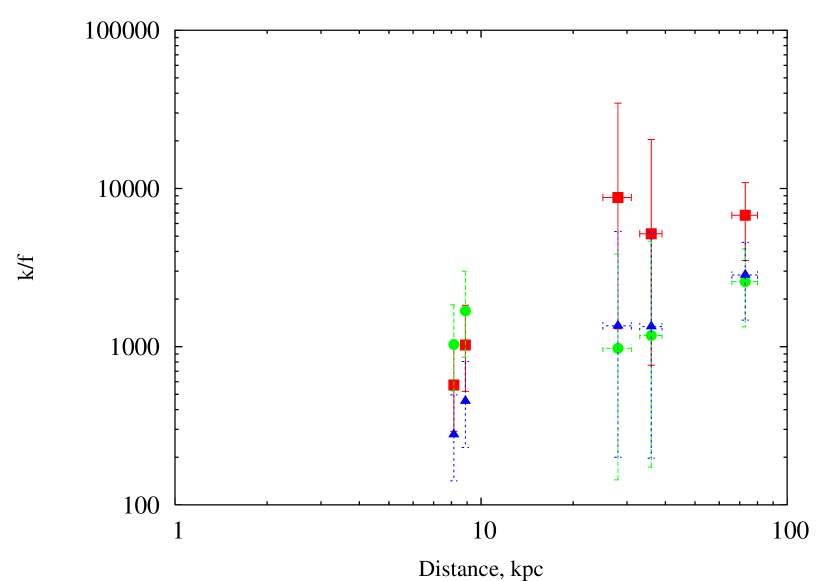
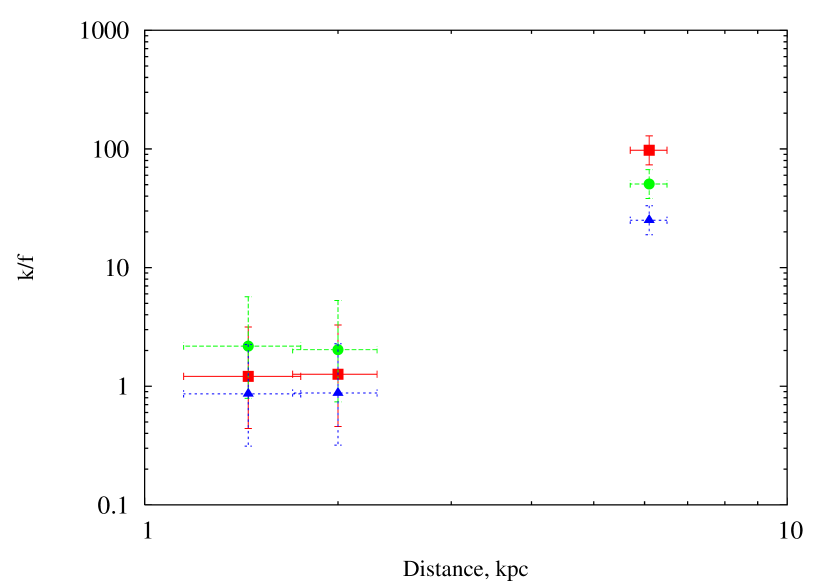
As the electrons in the bubbles age, the energy present in the bubble inferred from the observed synchrotron emission decreases. So, in order to maintain pressure balance, must rise and so would also be expected to rise, which is what is observed. This implies that there is little ongoing reacceleration in the bubble. There may be an effect on from the change in shape of the bubble from a spheroid to a very oblate – spherical-cap-like shape. We have taken the shapes of the Ghost Bubbles to be as oblate spheroids when calculating their volumes and distances from the centre of the cluster which should account for most of this change.
The pressure of the ICM falls as the bubbles rise up through it. Therefore it could be expected that, in the absence of any change in or the electron population, that would fall as fewer particles would be required to maintain pressure balance. However the drop in the number of particles inferred from the synchrotron emission, even when there is low-frequency radio data, has a greater effect. When there is no low-frequency radio data then many fewer particles are inferred and this will dominate over the effect of the drop in pressure which is of order a factor of two.
6 Clusters with Bubbles
In order to obtain a limit on the fraction of clusters which contain bubbles the Brightest 55 (B55) sample studied by Peres et al. (1998) has been used. The B55 sample is a flux-limited sample of X-ray clusters which are all close enough to have been imaged with sufficient resolution by previous X-ray instruments (e.g. ROSAT) and is nearly complete.
For the clusters in the sample we determined those which have a short cooling time and a large temperature drop to the centre of the cluster, and as such require some form of heating to avoid having a cooling flow. We convert the cooling times listed in Peres et al. (1998) to our cosmology and take those which have a cooling time of and a temperature drop to the centre () of greater than a factor of two. There are 55 clusters in the sample, of which 23 have a , and 19 have a large temperature drop. For five clusters there was no data on the cooling times in Peres et al. (1998) and these have not been included here. There are 17 clusters which have both, of which 12 have had depressions identified in the X-ray emission. Therefore at least 70 per cent of clusters which need some form of heating at the centre host radio bubbles. There are another three clusters which contain clear bubbles whose cooling times and temperature drops miss the cut-offs.
Out of the remaining five requiring some form of heating, one (2A 0335+096) has a complicated X-ray core (Mazzotta et al., 2003), which could conceal the presence of bubbles as radio emission has been detected from this cluster; another (PKS 0745-191) has an amorphous radio source at the centre (Hicks et al., 2002), which may be under-pressured. The central nucleus is also very weak. Another two clusters have detected radio sources at their centres, A496 from NVSS and A2204 has an extended source and as such may have bubbles (Sanders et al., 2005), but lack the X-ray/radio resolution to see them clearly. AWM7 has no central radio source (as detected by NVSS), but Furusho et al. (2004) find two high metallicity blobs which could be produced by bubbles lifting up high metallicity material from the centre of the cluster. Burns et al. (1981) find radio emission from the direction of AWM7 but identify all sources as background ones and as such there are no known radio sources associated with the cluster.
What is surprising is that some clusters which have known bubbles fall outside of the cut-offs that we have taken. Hydra A and M87 both have short central cooling times however Hydra A has a small temperature drop into the centre, from to ; however the temperature map in Nulsen et al. (2002) shows that the core is hotter than the surrounding gas and as such there could be a drop of greater than a factor of two. M87 has only a slightly larger drop ( to , Forman et al. (2003)), just missing the cut-off; however XMM-NEWTON observations give a temperature drop of to (Böhringer et al., 2001) and so it could fall within the cut-off. They may have recently gone through an outburst and as such the central gas has been heated by the radio source and has not had a chance to cool again. MKW3s only just makes the cooling time cut-off, however the temperature structure at the centre of this cluster is complex (Mazzotta et al., 2004), and could easily contain a temperature drop of greater than factor of two. This means that there could be 20 clusters out of the B55 sample which require some form of heating; 15 (75 per cent) of which host bubbles.
The above results match the proportion of clusters containing radio sources presented in Eilek (2004); who, using the B55 sample with and matching these clusters to the NVSS Condon et al. (1998), finds 25 out of 30 clusters (83 per cent) have a currently active radio source in the centre. Marković et al. (2004) using the ROSAT All Sky Survey clusters which contain a massive galaxy at the centre, coincident with the X-ray peak, and performing VLA follow-up observations find that all 22 clusters have a currently active central radio source.
In the recent survey of clusters by Bîrzan et al. (2004), out of a set of around 80 clusters taken from the Chandra archive, they only found 16 which contained clear bubbles. Without discriminating between cooling and non-cooling clusters, only 20 per cent of clusters contained bubbles at any one time; interpreted as a duty cycle of 20 per cent. Our analysis shows that out of the clusters with short , and as such appear to need some form of heating at the centre, at least 70, if not 75, per cent host radio bubbles. Out of the total B55 sample of clusters only 30 per cent of the clusters host bubbles, similar to the fraction presented in Bîrzan et al. (2004), but those clusters which contain bubbles are likely to have a central radio source with duty cycle of close to 100 per cent. The full list of which clusters have a short cooling time, large central temperature drops and radio sources or bubbles is shown in Table 4. Clusters which exhibit the cooling flow problem commonly have an active central radio source, blowing bubbles in the surrounding medium. Further work is required to test whether such activity is sufficient to stem radiative cooling or if bouts of greater activity or some other processes are required.
| and | or | |||
| R & B | R, no B | no R, no B | R & B | R, no B |
| A85 | 2A 0335+096 | AWM 7 | Hydra A | 3C129.1 |
| A262 | A496 | M87 | A399 | |
| A426 | A2204 | MKW 3s | A401 | |
| A478 | PKS 0745-191 | A576 | ||
| A1795 | A754 | |||
| A2029 | A1644 | |||
| A2052 | A1650 | |||
| A2199 | A3112 | |||
| A2597 | A3391 | |||
| A4059 | Klem44 | |||
| Centaurus | ||||
| Cygnus A | ||||
| 12 | 4 | 1 | 3 | 10 |
Notes: B = Bubble; R = Radio emission (may just be NVSS source).
7 Conclusions
Extending the sample of low-redshift clusters with clear decrements in the X-ray emission presented in Dunn & Fabian (2004), we obtained limits on , where is the ratio of the total relativistic particle energy to that in electrons radiating between and , and is the volume filling fraction of the relativistic plasma. For all of the bubbles analysed there cannot be simple equipartition between the particles and the magnetic field present in the plasma. The combined sample showed no strong dependence of with any physical parameter of the source – the Rotation Measure of the radio lobes shows some correlation but not all of the bubbles have measured values for the RM. In the next few years is should be possible to measure the RMs from sources behind the cluster using EVLA. The correlation of the upper limits on with magnetic field would then be an interesting possibility.
In the combined sample there is now no reason to prefer two populations over one, and because of the large spread in the values obtained on no conclusion about the underlying population distribution can be made.
It was possible to trace the evolution of within a single cluster in the cases of Perseus and Centaurus. The older a bubble is the larger its value of which is mainly as the result of the aging of the relativistic electrons.
A simple study of the Brightest 55 cluster sample showed that 17, possibly 20, clusters required some form of heating ( and ). Of these at least 12 (70 per cent), possibly 15 (75 per cent), contained bubbles.
Acknowledgements
We thank Steve Allen for help with the statistical analysis, Roderick Johnstone for computing help and the referee for helpful comments and suggestions. ACF and RJHD acknowledge support from The Royal Society and PPARC respectively. GBT acknowledges support for this work from the National Aeronautics and Space Administration through Chandra Award Numbers GO4-5134X and GO4-5135X issued by the Chandra X-ray Observatory Center, which is operated by the Smithsonian Astrophysical Observatory for and on behalf of the National Aeronautics and Space Administration under contract NAS8-03060.
References
- Bîrzan et al. (2004) Bîrzan L., Rafferty D. A., McNamara B. R., Wise M. W., Nulsen P. E. J., 2004, ApJ, 607, 800
- Böhringer et al. (2001) Böhringer H. et al., 2001, A&A, 365, L181
- Biller et al. (2004) Biller B. A., Jones C., Forman W. R., Kraft R., Ensslin T., 2004, ApJ, 613, 238
- Blanton et al. (2004) Blanton E. L., Sarazin C. L., McNamara B. R., Clarke T. E., 2004, ApJ, 612, 817
- Blanton et al. (2001) Blanton E. L., Sarazin C. L., McNamara B. R., Wise M. W., 2001, ApJ, 558, L15
- Böhringer et al. (1993) Böhringer H., Voges W., Fabian A. C., Edge A. C., Neumann D. M., 1993, MNRAS, 264, L25
- Burbidge (1959) Burbidge G. R., 1959, ApJ, 129, 849
- Burns et al. (1981) Burns J. O., White R. A., Hough D. H., 1981, AJ, 86, 1
- Churazov et al. (2001) Churazov E., Brüggen M., Kaiser C. R., Böhringer H., Forman W., 2001, ApJ, 554, 261
- Clarke et al. (2004) Clarke T. E., Blanton E. L., Sarazin C. L., 2004, ApJ, 616, 178
- Clarke et al. (2001) Clarke T. E., Kronberg P. P., Böhringer H., 2001, ApJ, 547, L111
- Clarke et al. (2005) Clarke T. E., Sarazin C. L., Blanton E. L., Neumann D. M., Kassim N. E., 2005, astro-ph/0503274
- Condon et al. (1998) Condon J. J., Cotton W. D., Greisen E. W., Yin Q. F., Perley R. A., Taylor G. B., Broderick J. J., 1998, AJ, 115, 1693
- Croston et al. (2003) Croston J. H., Hardcastle M. J., Birkinshaw M., Worrall D. M., 2003, MNRAS, 346, 1041
- de Filippis et al. (2001) de Filippis E., Castillo-Morales A., Schindler S., Schwope A., Wambsganss J., 2001, in Clusters of Galaxies and the High Redshift Universe Observed in X-rays
- Dunn & Fabian (2004) Dunn R. J. H., Fabian A. C., 2004, MNRAS, 351, 862
- Durret et al. (2005a) Durret F., Lima Neto G. B., Forman W., 2005a, A&A, 432, 809
- Durret et al. (2005b) Durret F., Lima Neto G. B., Forman W., 2005b, astro-ph/0501214
- Eilek (2004) Eilek J. A., 2004, in The Riddle of Cooling Flows in Galaxies and Clusters of galaxies
- Ekers & Kotanyi (1978) Ekers R. D., Kotanyi C. G., 1978, A&A, 67, 47
- Ettori et al. (2002) Ettori S., Fabian A. C., Allen S. W., Johnstone R. M., 2002, MNRAS, 331, 635
- Fabian et al. (2002) Fabian A. C., Celotti A., Blundell K. M., Kassim N. E., Perley R. A., 2002, MNRAS, 331, 369
- Fabian et al. (2003a) Fabian A. C., Sanders J. S., Allen S. W., Crawford C. S., Iwasawa K., Johnstone R. M., Schmidt R. W., Taylor G. B., 2003a, MNRAS, 344, L43
- Fabian et al. (2003b) Fabian A. C., Sanders J. S., Crawford C. S., Conselice C. J., Gallagher J. S., Wyse R. F. G., 2003b, MNRAS, 344, L48
- Fabian et al. (2001) Fabian A. C., Sanders J. S., Ettori S., Taylor G. B., Allen S. W., Crawford C. S., Iwasawa K., Johnstone R. M., 2001, MNRAS, 321, L33
- Fabian et al. (2000) Fabian A. C. et al., 2000, MNRAS, 318, L65
- Fabian et al. (2005) Fabian A. C., Sanders J. S., Taylor G. B., Allen S. W., 2005, astro-ph/0503154
- Fanti et al. (1987) Fanti C., Fanti R., de Ruiter H. R., Parma P., 1987, A&AS, 69, 57
- Forman et al. (2003) Forman W. et al., 2003, astro-ph/0312576
- Furusho et al. (2004) Furusho T., Yamasaki N. Y., Ohashi T., 2004, Advances in Space Research, 34, 2530
- Hardcastle & Worrall (2000) Hardcastle M. J., Worrall D. M., 2000, MNRAS, 319, 562
- Harris et al. (1999) Harris D. E., Hjorth J., Sadun A. C., Silverman J. D., Vestergaard M., 1999, ApJ, 518, 213
- Hicks et al. (2002) Hicks A. K., Wise M. W., Houck J. C., Canizares C. R., 2002, ApJ, 580, 763
- Iwasawa et al. (1999) Iwasawa K., Allen S. W., Fabian A. C., Edge A. C., Ettori S., 1999, MNRAS, 306, 467
- Iwasawa et al. (2001) Iwasawa K., Fabian A. C., Allen S. W., Ettori S., 2001, MNRAS, 328, L5
- Johnstone et al. (2002) Johnstone R. M., Allen S. W., Fabian A. C., Sanders J. S., 2002, MNRAS, 336, 299
- Jones et al. (2002) Jones C., Forman W., Vikhlinin A., Markevitch M., David L., Warmflash A., Murray S., Nulsen P. E. J., 2002, ApJ, 567, L115
- Kronawitter et al. (2000) Kronawitter A., Saglia R. P., Gerhard O., Bender R., 2000, A&AS, 144, 53
- Laing & Bridle (1987) Laing R. A., Bridle A. H., 1987, MNRAS, 228, 557
- Lewis et al. (2003) Lewis A. D., Buote D. A., Stocke J. T., 2003, ApJ, 586, 135
- Marković et al. (2004) Marković T., Owen F. N., Eilek J. A., 2004, in The Riddle of Cooling Flows in Galaxies and Clusters of galaxies
- Mazzotta et al. (2004) Mazzotta P., Brunetti G., Giacintucci S., Venturi T., Bardelli S., 2004, Journal of Korean Astronomical Society, 37, 381
- Mazzotta et al. (2003) Mazzotta P., Edge A. C., Markevitch M., 2003, ApJ, 596, 190
- McNamara et al. (2000) McNamara B. R. et al., 2000, ApJ, 534, L135
- McNamara et al. (2001) McNamara B. R. et al., 2001, ApJ, 562, L149
- Nulsen et al. (2002) Nulsen P. E. J., David L. P., McNamara B. R., Jones C., Forman W. R., Wise M., 2002, ApJ, 568, 163
- Nulsen et al. (2004) Nulsen P. E. J., McNamara B. R., Wise M. W., David L. P., 2004, astro-ph/0408315
- Ohto et al. (2003) Ohto A., Kawano N., Fukazawa Y., 2003, PASJ, 55, 819
- Parma et al. (1986) Parma P., de Ruiter H. R., Fanti C., Fanti R., 1986, A&AS, 64, 135
- Peres et al. (1998) Peres C. B., Fabian A. C., Edge A. C., Allen S. W., Johnstone R. M., White D. A., 1998, MNRAS, 298, 416
- Pollack et al. (2005) Pollack L. K., Taylor G. B., Allen S. W., 2005, astro-ph/0503250
- Reiprich & Böhringer (2002) Reiprich T. H., Böhringer H., 2002, ApJ, 567, 716
- Reynolds et al. (2005) Reynolds C. S., Brenneman L. W., Stocke J. T., 2005, MNRAS, 357, 381
- Sanders & Fabian (2002) Sanders J. S., Fabian A. C., 2002, MNRAS, 331, 273
- Sanders et al. (2005) Sanders J. S., Fabian A. C., Dunn R. J. H., 2005, astro-ph/0503318
- Sanders et al. (2005) Sanders J. S., Fabian A. C., Taylor G. B., 2005, MNRAS, 356, 1022
- Sarazin et al. (1995) Sarazin C. L., Burns J. O., Roettiger K., McNamara B. R., 1995, ApJ, 447, 559
- Schindler et al. (2001) Schindler S., Castillo-Morales A., De Filippis E., Schwope A., Wambsganss J., 2001, A&A, 376, L27
- Schmidt et al. (2002) Schmidt R. W., Fabian A. C., Sanders J. S., 2002, MNRAS, 337, 71
- Sun et al. (2003) Sun M., Jones C., Murray S. S., Allen S. W., Fabian A. C., Edge A. C., 2003, ApJ, 587, 619
- Taylor et al. (1994) Taylor G. B., Barton E. J., Ge J., 1994, AJ, 107, 1942
- Taylor et al. (2002) Taylor G. B., Fabian A. C., Allen S. W., 2002, MNRAS, 334, 769
- Voigt & Fabian (2005) Voigt L. M., Fabian A. C., 2005, in prep
- White (2000) White D. A., 2000, MNRAS, 312, 663
Appendix
The bubble timescales and derived powers are presented in Table 5.
| Cluster | Lobe(1) | ||||||||
| Active Bubbles | |||||||||
| 3C401 | N ,R | 8.445 | 5.57 | 1.58 | 4.52 | 1.91 | 6.73 | 2.36 | 0.62 |
| S ,R | 8.445 | 5.82 | 2.03 | 4.27 | 1.33 | 3.82 | 1.81 | 0.60 | |
| 4C55.16 | N ,R | 7.64 | 2.89 | 2.99 | 5.18 | 15.8 | 15.3 | 8.81 | 9.57 |
| S ,R | 7.64 | 4.32 | 3.00 | 5.80 | 14.5 | 20.8 | 10.8 | 7.32 | |
| A262 | E, R | 13.9 | 1.94 | 0.48 | 1.27 | 0.065 | 0.26 | 0.10 | 1.25 |
| W, R | 13.9 | 1.87 | 0.36 | 1.15 | 0.070 | 0.36 | 0.11 | 1.28 | |
| A478 | NE, R | 11.4 | 0.67 | 0.078 | 0.29 | 0.44 | 3.77 | 1.00 | 2.53 |
| SW, R | 11.4 | 1.04 | 0.15 | 0.56 | 1.04 | 7.25 | 1.92 | 1.90 | |
| A1795 | NW, R | 12.2 | 1.08 | 5.13 | 1.90 | 0.82 | 1.71 | 0.46 | 1.85 |
| S, R | 12.2 | 1.26 | 6.88 | 2.00 | 0.67 | 1.22 | 0.42 | 1.67 | |
| A2029 | NW, R | 11.7 | 1.55 | 1.49 | 2.89 | 0.90 | 0.94 | 0.49 | 1.45 |
| SE, R | 11.7 | 1.40 | 1.57 | 3.12 | 1.61 | 1.43 | 0.72 | 1.55 | |
| M87 | E-CJ, R | 14.4 | 0.58 | 0.15 | 0.59 | 0.22 | 0.83 | 0.21 | 2.79 |
| NGC4472 | E, R | 14.5 | 0.99 | 0.63 | 1.11 | 0.034 | 0.053 | 0.030 | 1.95 |
| W, R | 14.5 | 1.03 | 0.39 | 0.90 | 0.049 | 0.13 | 0.056 | 1.90 | |
| NGC4636 | NE, R | 14.5 | 0.30 | 0.15 | 0.39 | 0.0017 | 0.0033 | 0.0013 | 4.33 |
| SW, R | 14.5 | 0.34 | 0.13 | 0.36 | 0.0010 | 0.0026 | 0.0010 | 3.95 | |
| Ghost Bubbles | |||||||||
| A85 | N, X | 12.4 | 1.32 | 0.89 | 1.39 | 4.47 | 6.62 | 4.23 | 1.61 |
| S, X | 12.4 | 1.59 | 1.63 | 1.95 | 4.90 | 4.80 | 4.00 | 1.42 | |
| A2597 | NE, X | 11.5 | 2.27 | 2.05 | 2.87 | 3.17 | 3.50 | 2.50 | 1.13 |
| SW, X | 11.5 | 3.41 | 2.12 | 3.33 | 3.38 | 5.44 | 3.47 | 0.86 | |
| Centaurus | N,X | 13.9 | 1.23 | 2.48 | 5.10 | 0.16 | 0.079 | 0.038 | 1.69 |
| Perseus Ghost | W, X | 13.9 | 0.80 | 7.53 | 5.42 | 11.8 | 1.25 | 1.73 | 2.26 |
| S, X | 13.9 | 1.59 | 7.15 | 6.27 | 8.16 | 1.81 | 2.07 | 1.43 | |
| Perseus Halo | SW, R | 13.9 | 3.78 | 10.0 | 9.07 | 12.2 | 4.60 | 5.07 | 0.80 |
| RBS797 | W, X | 5.90 | 4.31 | 4.46 | 8.41 | 214 | 207 | 110 | 0.73 |
| E, X | 5.90 | 4.31 | 4.46 | 8.41 | 214 | 207 | 110 | 0.73 | |
Notes:
(1) The codes for the Lobes are N—Northern, S—Southern, E—Eastern, W—Western etc. , X—sizes from X-ray image, R—sizes from Radio image. CJ—Counter Jet cavity in M87.
(2) The timescale for the bubble calculated from the magnetic field which produces the same energy density as that of the CMB at the redshift of the cluster for electrons radiating at .
(3) The power is the PV/t work only, with not accounted for. Therefore, for a fully relativistic plasma the values for the powers need to be multiplied by four, and for a non-relativistic plasma, by .