Pixie Dust: The Silicate Features in the Diffuse Interstellar Medium
Abstract
We have analyzed the 9.7 and “18” µm interstellar silicate absorption features along the line of sight toward four heavily extincted galactic WC-type Wolf-Rayet (WR) stars. We construct two interstellar extinction curves from 1.25 to 25 µm using near-IR extinction measurements from the literature along with the silicate profiles of WR 98a (representing the local ISM) and GCS 3 (representing the Galactic Center). We have investigated the mineralogy of the interstellar silicates by comparing extinction profiles for amorphous silicates with olivine and pyroxene stochiometry to the 9.7 and “18” µm absorption features in the WR 98a spectrum. In this analysis, we have considered solid and porous spheres and a continuous distribution of ellipsoids. While it is not possible to simultaneously provide a perfect match to both profiles, we find the best match requires a mixture of these two types of compounds. We also consider iron oxides, aluminosilicates and silicate carbide (SiC) as grain components. Iron oxides cannot be accommodated in the observed spectrum, while the amount of Si in SiC is limited to %. Finally, we discuss the cosmic elemental abundance constraints on the silicate mineralogy, grain shape and porosity.
1 Introduction
Astronomical observations are often hampered by the confusing presence of foreground dust. These data are then adjusted using vaguely understood correction procedures, which are perhaps best described as “faith, trust, and pixie dust.” In this, astronomers follow notions which are widely spread in society because the term “pixie dust” is often used to refer to a technology that seemingly does the impossible. In this paper, we address one aspect of interstellar pixie dust: the nature of interstellar silicates and the infrared extinction “correction” procedure.
The presence of silicate dust in the interstellar medium has been known for some four decades, but its precise mineralogy remains uncertain. Silicates in the interstellar medium (ISM) are thought to be the product of mass-losing oxygen-rich Asymptotic Giant Branch (AGB) stars. Amorphous silicates are found in the circumstellar environments of almost all evolved oxygen-rich mass-losing stars (Kemper 2002). Crystalline silicates are found around AGB stars with high mass-loss rates, although it’s possible these silicates exist but are undetectable around low mass-loss AGB stars (Kemper 2002). In the ISM, crystalline silicates are not detected and, recently, a stringent limit of % of the total silicate population by mass has been placed (Kemper, Vriend, & Tielens 2004, 2005).
Amorphous silicates in the ISM exhibit absorption features with smooth profiles at 9.7 and µm. These profiles can be fitted with extinction features based on laboratory derived optical constants. This procedure results in estimates for abundances in solid form of Si, Mg and Fe, which depend on the assumed porosity, particle shape, and the adopted silicate material (olivine or pyroxene-glass, Mathis 1998). Typically, such estimated require most or all of the available solar abundance of Si, Mg, and Fe.
Bright late-type WC Wolf Rayet stars and IR sources at the Galactic center have been used to probe interstellar silicates in the diffuse interstellar medium (Aitken et al. 1980; Roche & Aitken 1985). The Galactic center lines of sight have the advantage of copious extinction ( magnitudes), but the disadvantage of being a crowded field where emission and absorption components can complicate the analysis of interstellar features. Late-type carbon-class (WC 8-9) Wolf-Rayet stars that are extincted by 6 to 12 magnitudes of interstellar visual extinction, provide an opportunity to study interstellar absorption features within the solar circle. Although these stars are known to have circumstellar dust, very little of the visual extinction arises in the circumstellar environment (Roche & Aitken 1984).
In this paper, we present the 2.38 to 40 µm spectra from the Infrared Space Observatory’s (ISO) Short Wavelength Spectrometer (SWS) of four WC-type Wolf-Rayet stars. The data reduction is discussed in §2. In §3 we describe our method of fitting the spectral energy distribution of the WR stars. This estimated continuum is used to extract the silicate absorption features. In §4 we outline the calculations for the extinction profiles. These calculated profiles are compared to the best S/N observed profile in §5. Section 5 also compares our observed diffuse ISM profiles to observed silicate features in different environments. Section 6 gives an overview of the evolution of silicates from their production sites to their incorporation into young star environments. In §7 we discuss abundance constraints for the silicate minerals considered and in §8 we discuss other possible contributors to the absorption. Extinction curves from 1.25 to 25 µm are constructed for the “local” interstellar medium and the Galactic center in §9. Finally, we summarize our results in §10.
2 Observations and Data Reduction
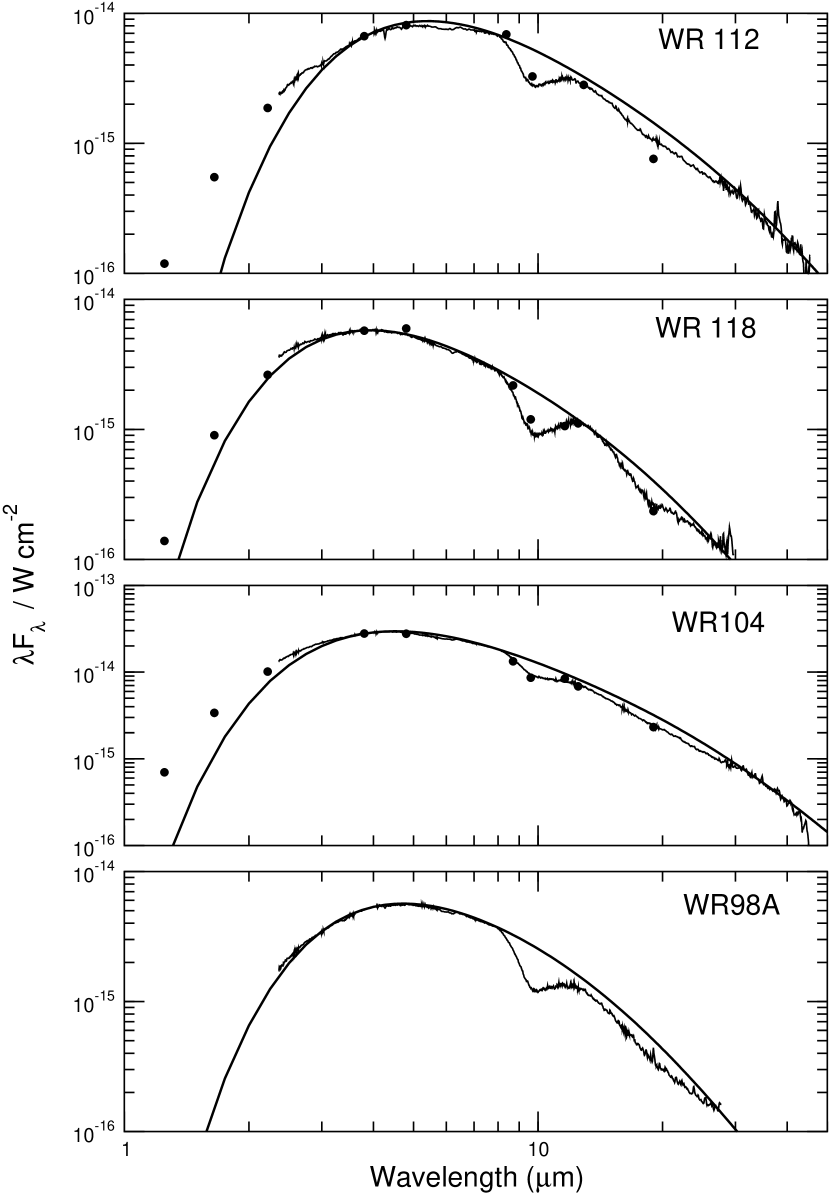
We present the 2.38-40 µm spectra of the four late-type WC stars, WR 112, WR 118, WR 104 and WR 98a from the Short-Wavelength Spectrometer (SWS, de Graauw et al. 1996) on the Infrared Space Observatory (ISO, Kessler et al. 1996). These spectra were acquired with the Astronomical Observing Template (AOT) 01 speed 2 with an average resolving power () between 250 and 600, and were first presented by van der Hucht et al. (1996). ISO-TDT numbers are given in Table 1.
Off-line processing (OLP) version 10.1 data were reduced starting at the Standard Processed Data (SPD) level using IA3. For each band, the twelve individual detector scans were normalized (“flat-fielded”) to a constant or a first order polynomial. Points that deviated more than 3 sigma from the average were cut, and the resulting spectra were then rebinned to the average resolving power for each band (Leech et al. 2002). Band 2C (7–12µm) spectra suffer from residuals caused by incomplete removal of the relative spectral response function. For these data, an extra reduction step using the “fringes” routine in IA3 was carried out after rebinning the individual detector scans. The WC spectra have low flux at long wavelengths, so band 4 data (29–45 µm) have low signal-to-noise and have not been included in the final spectra shown in Fig. 1.
3 Analysis
The spectral energy distributions of the late-type WC stars are complicated by emission from heated carbon dust arising in their circumstellar environment (e.g., Williams, van der Hucht & Thé 1987; van der Hucht et al. 1996). Modeling their spectral energy distribution in detail is beyond the scope of this paper. Instead, we will adopt a physical, albeit simplistic, model for their continuum dust emission in order to extract the interstellar silicate absorption features.
Following Williams et al. (1987), we assume that the WR stars’ mass loss can be modeled by optically thin spherical shells of amorphous carbon dust. We assume that the heating of the dust is dominated by visual/UV photons from the central star and that the dust absorbs these with unit efficiency. The IR emission efficiency, , of carbon dust is well-represented by a -law with (e.g., ; Bussoletti et al. 1987, Mennella et al. 1995). The temperature is then described by,
| (1) |
where is the temperature at the inner radius . The contribution to the flux by a shell is given by
| (2) |
For the grain density distribution, we will adopt a power-law density distribution, . The flux is then given by,
| (3) |
with and . is the integral,
| (4) |
where the integral limits apply to the inner and outer boundary of the shell. For a constant outflow and , we have When is very small and is very large, the integral approaches the Rieman zeta function and is independent of the exact boundary values. The frequency dependence of the flux is then contained within the pre-integral factor, .
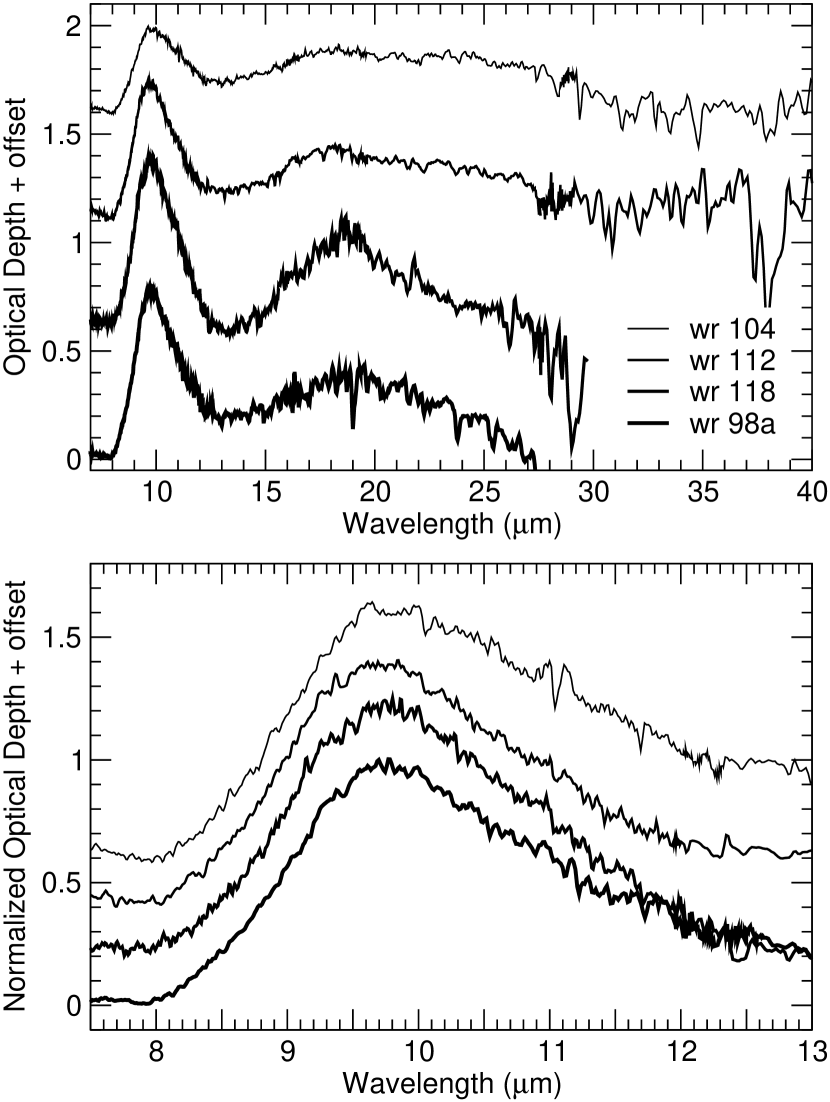
There are four parameters in the fit, , , , and . We have adopted and and allowed and to vary, then evaluated the integral. We have used this model to “fit” continua to the observed spectra. The values of the parameter fits for each of the WR star spectra are given in Table 2. The model “fits” are shown in Fig. 1 and the resulting optical depth spectra are shown in Fig. 2. The optical depths, their ratios and the visual extinctions (from van der Hucht 2001) are listed in Table 3. The lower panel in Fig. 2 shows the spectra normalized to one at their peak in order to compare the 9.7 µm profiles. The 9.7 µm profiles are similar from 8 to 11.3 µm, while there is some variation in the absorption between features, from about 11.3 to 15.5 µm, with the spectra of WR 104 and WR 118 being the outliers. The central wavelength of the 18 µm feature and the ratio of the features is similar for 3 out of 4 sources. The outlier, in terms of the ratio of the silicate features, is the spectrum of WR 104. This could be due to uncertainties in the continuum that are a result of low S/N data for µm, rather than a physical difference in the environment along the line of sight.
4 Calculating the Silicate Extinction Profiles
In order to compare the laboratory derived silicate minerals to the observed absorption spectrum, one needs to calculate extinction profiles from the available optical constants. We assume that the size of the silicate grains is much smaller than the wavelength (Rayleigh limit). For spherical particles in the Rayleigh limit, the absorption efficiency can be approximated as
| (5) |
where and is the particle size. The cross section per unit volume for absorption is
| (6) |
For a continuous distribution of ellipsoids (CDE), assuming that all shapes are equally probable, the average absorption cross section per unit volume is
| (7) |
The above equations are valid for uniform solid particles. To calculate the dielectric function for silicates with inclusions, we used the Bruggeman rule (Bohren & Huffman 1983):
| (8) |
where is the average dielectric constant to be substituted into equations 6 or 7, is the dielectric function of the matrix (silicate) and is the filling factor. For grains will high porosity, the filling factor () above is replaced with the correction derived by Ossenkopf (1991) for spherical inclusions :
| (9) |
The cross-sections per unit volume () for the silicate minerals and shapes considered here are listed in Table 4.
5 The Silicate Features
5.1 The Profile of the Interstellar Silicate Features
In this section we will compare the 9.7 and 18 µm profiles observed toward the WC stars, representative of (local) diffuse ISM dust, with silicate profiles in different environments.
5.1.1 The Cephei profile
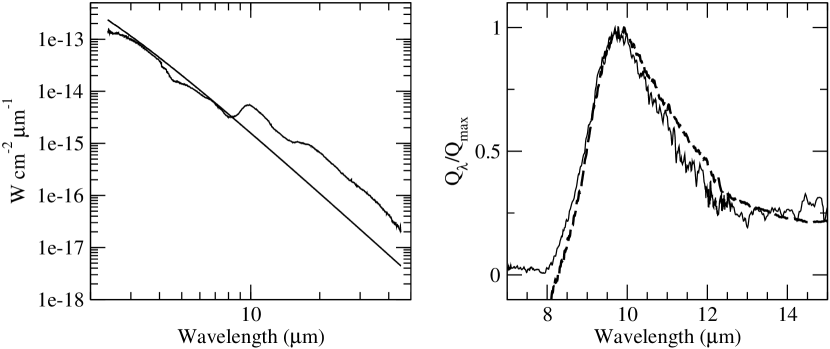
The emissivity curve for the red supergiant Cephei has historically been used to represent and model interstellar extinction in the 8–13 µm region (e.g., Roche & Aitken 1984). The silicates around Cep were presumably formed in the outflow of the star. We have re-examined the Cep spectrum in light of the identification of photospheric lines in the full ISO-SWS spectrum (Tsuji 2000). The photospheric model by Tsuji (2000) shows that an absorptive SiO component, whose onset is just shortward of the 9.7 µm silicate emission feature, partially underlies it. We first subtract the stellar continuum represented by a 3600 K blackbody curve (Fig. 3, left panel). The resulting excess emission is fitted with a 250 K blackbody curve, representing the underlying dust emission. An emissivity curve is created by dividing the Cep emission spectrum by the 250 K blackbody curve. The final result is shown in the right panel of Fig. 3 along with the absorption spectrum of WR 98a. The Cep emissivity curve provides a reasonable representation of the diffuse ISM absorption feature.
5.1.2 The Galactic Center Quintuplet Profile
The line of sight toward the Galactic center has long been used to probe the properties of diffuse ISM dust. Studies of the ISM silicate absorption features toward the central sources are complicated by dust emission (Roche & Aitken 1985; Smith, Aitken & Roche 1990). Northeast of the proper center is the Quintuplet Cluster, whose bright sources have also been used to study general ISM dust characteristics. The nature of the IR sources remains enigmatic, however it is thought that they could be dusty WC stars (Figer et al. 1999; Chiar & Tielens 2001; Monieti et al. 2001), much like the sources discussed in this paper. Spectropolarimetry of a few of the brightest IR sources (GCS 3-II, III, IV) in the Quintuplet Cluster shows that these lines of sight are dominated by pure absorptive polarization across the 9.7 µm silicate feature (Smith et al. 2000), making them excellent probes of the ISM absorption feature.
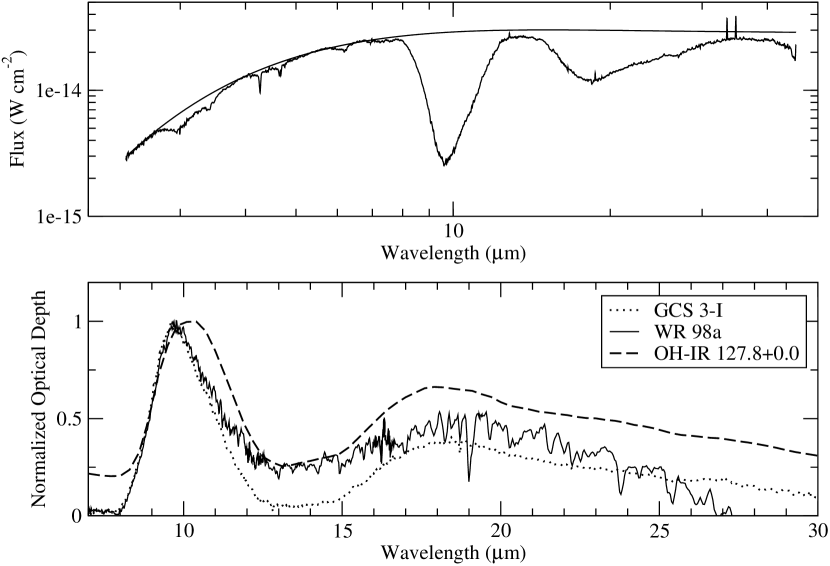
Here we use the Infrared Space Observatory’s Short Wavelength Spectrometer spectrum of GCS 3 to compare the silicate absorption profiles toward the Quintuplet with those seen toward WR 98a. We derived the optical depth spectrum for GCS 3 by fitting a fourth order polynomial to the flux spectrum (Fig. 4, top). Fig. 4 (bottom) shows that the relative depths of the 9.7 and 18 µm silicate features are similar for GCS 3 and WR 98a. The spectra deviate from each other most noticeably in the wavelength region between the two silicate absorption features. This could be a result of the difficulty in defining the continuum for the WR 98a spectrum longward of the 18 µm feature. Otherwise, the spectra have similar characteristics, including the ratio, implying a similar silicate mineralogy for the local ISM (WR 98a) and the Galactic center (GCS 3).
5.1.3 The Asymptotic Giant Branch Star Profile
Interstellar silicates are thought to be formed through condensation in the outflows of Asymptotic Giant Branch (AGB) stars. As an example of the profiles of silicates formed in such environments, we compare the 9.7 and 18 µm profiles of silicates obtained for diffuse ISM with those derived from observations of OH-IR 127.8+0.0 (Fig. 4, bottom). The model 9.7 µm extinction profile for the oxygen-rich AGB star OH-IR 127.8+0.0 (Kemper et al. 2002) is broader on the red wing compared to the ISM (WR 98a and GCS3 I) profiles. This additional absorption has been attributed to the presence of crystalline silicates (Demyk et al. 2000). The 18 µm OH-IR star silicate absorption feature peaks at 17.5 µm (Demyk et al. 2000; Kemper et al. 2002), shortward of the diffuse ISM feature which peaks at 18.5 µm. Demyk et al. (2000) suggest that the difference in peak wavelength of the 18 µm feature is due to the relatively low pyroxene-glass content of the OH-IR star silicates compared to those in the ISM (Demyk et al. 2000).
5.1.4 The Orion profile
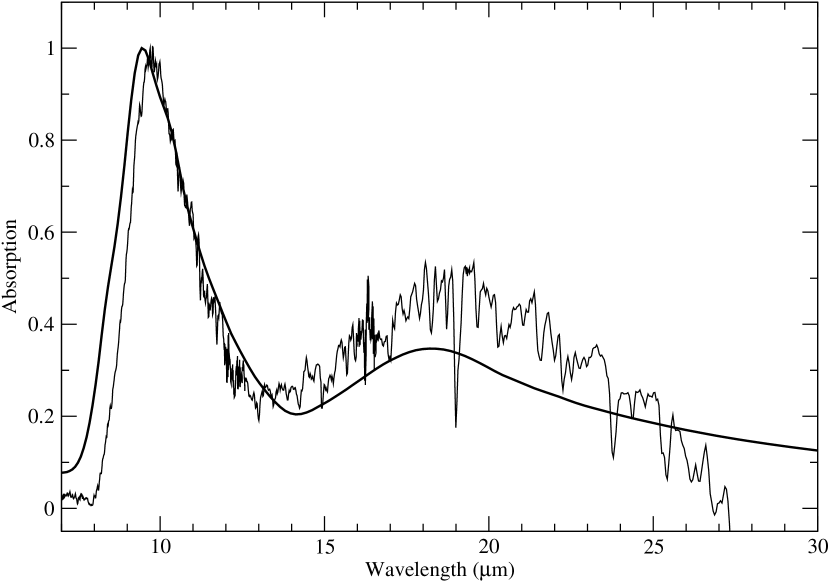
The inner regions of the Orion HII region (Trapezium region) show a 9.7 µm silicate emission feature (Forrest, Gillett, & Stein 1975) that is similar to the absorption feature observed in the cold dense interstellar medium (e.g., molecular cloud sources; Gillett et al. 1975). This 9.7 µm profile has been used by Draine & Lee (1984; DL) as constraints on their model of interstellar silicates. Figure 5 shows that the DL “astronomical” silicate profile does not match the observed central wavelength or width of the 9.7 µm absorption. The observed diffuse ISM 9.7 µm profile peaks longward of the Trapezium profile. Draine and Lee (1984) did not attempt a detailed fit of an observed “20” m silicate feature but only constrained it to peak at 18m and to be 40% of the 9.7 m feature in strength. The feature in the diffuse interstellar medium peaks at slightly longer wavelengths and is slightly stronger (deeper) than the DL feature.
5.1.5 The Dense Interstellar Medium Profile
The 9.7 µm Trapezium profile has been shown to be more similar to the absorption feature observed in dense clouds rather than that in the diffuse ISM. (e.g., Whittet et al. 1988; Bowey, Adamson & Whittet et al. 1998). Bowey et al. (1998) ascribe the differences in the diffuse ISM and dense cloud silicate absorption profiles to excess absorption, due to a non-volatile grain component, on the long-wavelength wing of the dense cloud feature. Similarly, Demyk et al. (1999) find that for deeply embedded massive protostars, which probably also have dense cloud dust along the line of sight, the silicate absorption profile peaks shortward of that in the diffuse ISM and has additional absorption on the long wavelength wing. However, for these sources, absorption in the long-wavelength wing is attributed to simple ice species (Demyk et al. 1999). This explanation for the profile difference between the diffuse ISM as measured toward the WC stars and the Galactic center versus the dense cloud profile would not work well for the Trapezium region. First, volatile ices are not expected to survive long in the ionized gas of the HII region. In addition, this dust has to be fairly warm in order to emit at 10 µm and ice already evaporates at K in the ISM.
5.2 Comparison with Laboratory Derived Profiles
The key to identifying the silicate mineral(s) responsible for the observed absorption features is finding the combination of mineral(s), shape and porosity that reproduces the observed peak wavelengths, widths and relative depths of the observed features. Laboratory studies show that the profiles of the silicate features depend on the composition and structure of the silicate material. We will focus here on the results for amorphous silicates since it has been shown that crystalline silicates are not prevalent in the diffuse ISM (Kemper, Vriend & Tielens 2004). Silicates are an important component of interstellar dust accounting for a major fraction of the interstellar dust volume. Given the observed interstellar silicate dust volume, we will focus on silicates based upon the abundant elements, magnesium and iron (see also §7). We will only consider here magnesium-iron silicates with an olivine or pyroxene stoichiometry. The general chemical formulae for olivines and pyroxenes are [(Mg,Fe2-2y)SiO4] (with between 0 and 1) and [Mgx,Fe1-xSiO3], respectively. Generally, it is thought that interstellar silicates are formed in the ejecta of Asymptotic Giant Branch stars through reactions with gaseous species (Salpeter 1977). Magnesium silicate compounds are calculated to be the first major condensates in a gas with solar system composition cooling down from a high temperature (Grossman & Larimer 1974). For the pressures relevant to these outflows, at slightly lower temperatures, iron is then expected to react with these magnesium silicates rather than condense as separate iron grains, forming iron-magnesium silicates. While the magnesium silicates are formed at relatively high temperatures and may well have a crystalline structure - after all, crystalline forsterite (Mg2SiO4) and enstatite (MgSiO3) are observed to be abundant in these stellar ejecta, the reaction with gaseous iron occurs below the glass temperature of these compounds and, hence, due to kinetics, an amorphous structure will result (Tielens & Allamandola 1987; Tielens 1990). While strictly speaking the terms olivines and pyroxenes are reserved for crystalline silicates with definite mineral structures and hence not appropriate for amorphous silicates, for ease of discussion, we will loosely call these amorphous compounds “olivine” and “pyroxene” glasses in the subsequent sections. Because of their formation history, these silicates likely have the stoichiometry corresponding to olivines and pyroxenes not only on a global level but also on a microscopic level and the amorphous nature of these grains reflects small variations in the nearest-neighbor bond angle and/or bond distance which destroys all long range order.
The 10 µm feature in olivine-glass silicates peaks at somewhat longer wavelengths than that for pyroxene glasses. At 18 µm, the olivine-glass feature is somewhat sharper and peaks at somewhat shorter wavelengths than the pyroxenes. In addition, for both minerals, the extinction profile of the 9.7 and 18 µm features broadens and the strength of the 18 µm feature relative to the 9.7 µm feature increases as the Mg:Fe ratio decreases (Dorschner et al. 1995). The Fe:Mg ratio ranges from 0 to 1.5 and 1 to 1.5 for the pyroxene and olivine glasses, respectively, considered by Dorschner et al. (1995). The extinction profiles also depend on the shape of the absorbing grains and the porosity of the grains. In the remainder of this section, we will make a detailed comparison between the observed silicate profiles and theoretically calculated profiles based upon the laboratory measured optical properties (Henning et al. 1999).111Optical constants for amorphous olivine and pyroxene glasses from the Laboratory Astrophysics Group of the Astrophysical Institute and University Observatory in Jena (http://www.astro.uni-jena.de/Laboratory/Database/odata.html)
5.2.1 Solid Spheres
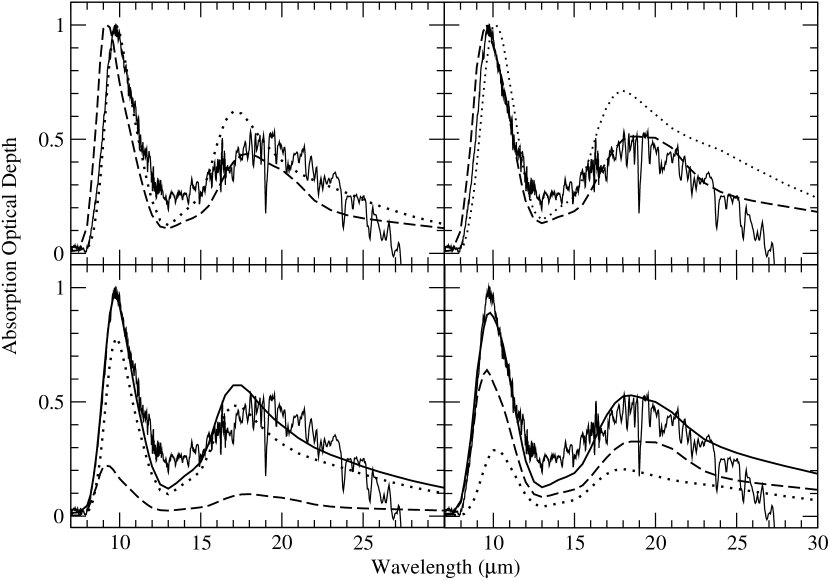
Amorphous olivine-glass is generally used to represent the ISM silicate absorption feature at 9.7 µm. However, while amorphous olivine-glass spheres provide a reasonable match to the 9.7 µm absorption feature, the observed 18.5 µm feature is not well matched in either central wavelength or relative depth. As shown in Fig. 6 (top left panel), the spectrum of olivine-glass spheres peaks near 17 µm and is too deep relative to the observed feature. The spectra of amorphous pyroxene-glass spheres peak near 9.3 µm and therefore do not provide a good match to the observed 9.7 µm feature. On the other hand, the relative depths of the 9.7 and 18 µm features, as well as the central wavelength of the 18 µm feature are well-reproduced by amorphous pyroxene glasses (Fig. 6, top left panel).
Thermodynamic equilibrium calculations show that, for temperatures less than about 1300 K222The exact temperature where this conversion sets in depends somewhat on the pressure., solid forsterite is converted into solid enstatite with excess gaseous SiO (Grossman and Larimer 1974). The extent to which this reaction proceeds before grain formation freezes out in the stellar ejecta depends on the timescale and density/temperature structure in the outflow and, hence, is difficult to constrain observationally. For this reason, we attempted to reproduce the astronomical features by a mix of these two components (assuming separate populations). The bottom left panel in Fig. 6 shows that the match using an arbitrary pyroxene-glass/olivine-glass mixture is improved over considering only one silicate species. However, the match between the pyroxene-glass/olivine-glass “mixture” and the observed spectrum is less than ideal between 11 and 15 µm. In addition, the peak wavelengths of both features are somewhat blueward of the observed feature. One way to shift the peak wavelengths redward is to incorporate vacuum into the grains. We discuss such porous grains below.
5.2.2 Porous Spheres
Observations of dust in dense clouds suggest that grain growth is dominated by coagulation (Jura 1980), thus grains are likely to be porous. Porous grains have larger extinction cross sections relative to their solid counterparts and therefore require less of a given element to account for, e.g., the silicate interstellar absorption features. Mathis (1998) argues that the cosmic abundance requirements can be met if 25% of the grain volume is vacuum. An upper limit of 60% on the porosity is given by the width of the interstellar polarization law (Wolff, Clayton, & Meade 1993).
We used the Bruggeman rule (Bohren & Huffman 1983) to calculate the extinction profiles for porous silicates, assuming that the vacuum is in the form of spherical inclusions (§4). In general, increasing the vacuum volume has the effect of decreasing the 9.7 µm to 18 µm ratio and shifting the peak absorption of both bands redward. Fig. 6 (top right panel) demonstrates how the extinction profiles of pyroxene-glass and olivine-glass spheres are modified by 50% vacuum. pyroxene-glass spheres that are 50% porous do a fair job at reproducing the astronomical spectrum, although they provide too much extinction on the blue side of the 9.7 µm feature. Porous olivine-glass spheres (50% vacuum) do not reproduce the observed spectrum, the biggest problem is the 18 µm to 9.7 µm band ratio that is too high to match the observations. The extinction profile of a mixture of porous (50% vacuum) olivine-glass and pyroxene-glass spheres is shown in the bottom right panel of Fig. 6. In this case, the 9.7 µm band is somewhat broader than the observed feature and the 18.5 µm to 9.7 µm band ratio is overestimated, although not significantly.
5.2.3 Continuous Distribution of Solid Ellipsoids
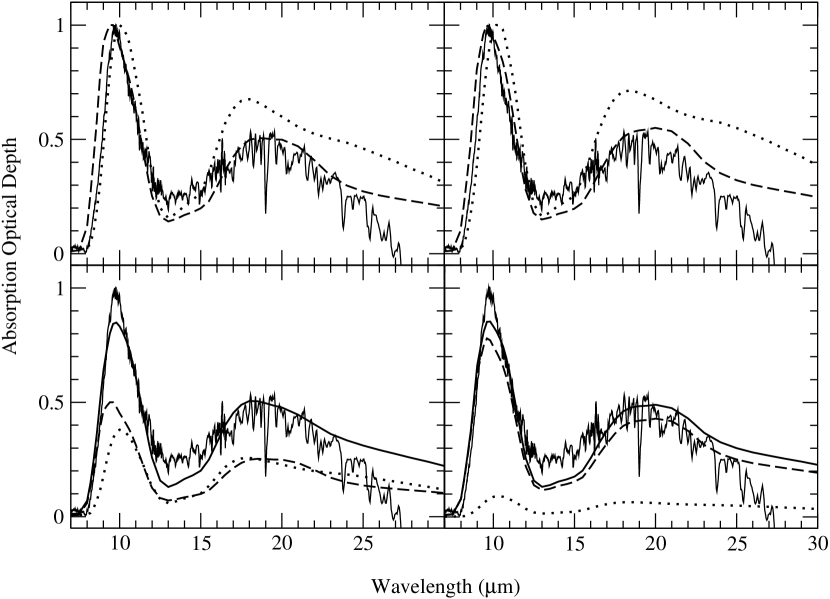
A continuous distribution of ellipsoids (CDE) where each shape occurs with equal probability could reflect the characteristic grain population in the ISM. Figure 7 (left panels) shows the calculated extinction profiles, using equation 7, for solid CDE. The extinction profiles for CDE are somewhat broader and are shifted redward relative to those for spheres. As shown in Fig. 7, the extinction profile for olivine-glass CDE is broader on the red side of the 9.7 µm profile, and produces a stronger 18.5 µm feature, relative to the observed profile. On the other hand, the profiles calculated for pyroxene-glass CDE match the relative strengths of the 9.7 and 18.5 µm features well, but are broader than the observed 9.7 µm profile on the blue side. Co-adding the extinction profiles of pyroxene-glass and olivine-glass CDE improves the match to the wings of the 9.7 µm profile, however, the relative strength of the 9.7 µm feature is underestimated (Fig. 7, bottom left panel).
5.2.4 Continuous Distribution of Porous Ellipsoids
We use the Bruggeman rule again to calculate the extinction profile for porous CDE with 50% porosity. The extinction profiles for porous CDE result in a somewhat increased 18 µm to 9.7 µm feature ratio compared to solid CDE. In addition, both profiles are broader than those for solid CDE.
5.2.5 Aluminosilicates
Aluminum is heavily depleted in the interstellar medium (Whittet 2003), and as such, is likely to be incorporated into silicate dust. Aluminosilicates were considered for circumstellar silicates around oxygen-rich stars because they provide much-needed opacity in the trough region between the 9.7 and 18 µm features (Mutschke et al. 1998). We considered Fe- and non-Fe- containing aluminosilicates for the diffuse ISM absorption features. Extinction profiles for porous and solid spheres and CDE were compared with the observations based on the optical constants by Mutschke et al. (1998). Fitting the observed silicate profiles with aluminosilicates (with and without Fe) with Si:Al equal to 2:1 requires more Al than available in the ISM independent of grain shape and porosity. The Fe-containing aluminosilicates provide more opacity in the trough region compared to aluminosilicates with no Fe. In general, for the alumino-silicates considered, the relative depths of the observed absorption features are matched by the extinction profiles for porous spheres, or solid or porous CDE; solid spheres result in a larger 9.7µm/18 µm ratio than observed. The observed 18 µm profile shape is also well-matched by the extinction profiles for porous spheres, or solid or porous CDE. Aluminosilicates look less promising in the spectral region of the observed 9.7 µm absorption feature. Here, the calculated extinction profiles do not provide a good match to the observed peak wavelength and the profile width, simultaneously. Thus, it is unlikely that aluminosilicates can account for the observed silicate profiles on their own, but they may still be present as a component of the interstellar silicate dust.
5.2.6 Iron Oxides
Theoretical calculations under conditions appropriate for the cooling solar nebula (e.g., high pressures as compared to stellar ejecta) predict that iron oxide forms by oxidation of metallic iron with excess H2O at about 600 K (Barshay & Lewis 1976). The fate of condensing iron is less clear in the ejecta of asymptotic red giant branch stars. Depending on temperature, pressure, and oxygen partial pressure, iron condensation can shift from metallic iron, to iron-magnesium silicates, to ferrous iron (FeO, wuestite), mixed ferrous-ferric oxide (Fe3O4; magnetite), to ferric iron (Fe2O3; hematite) in thermodynamic equilibrium calculations. Of course, kinetic factors may hamper the formation of some of these compounds (eg., metallic iron). In interstellar and circumstellar medium settings, the simplest iron oxide, ferrous oxide (FeO), has at times been considered as an important contributor to the extinction in the infrared (Hennning et al. 1995; Demyk et al. 2000; Kemper et al. 2002). The presence of circumstellar magnesio-wuestite grains has been inferred from the 19 µm emission feature in the spectra of AGB stars with low mass loss rates (Cami 2002; Posch et al. 2002; Heras & Hony 2005). However, those grains are considered to be largely magnesium-rich. On Earth, wuestite (FeO) is considered an important constituent of the lower mantle and natural samples of wuestite are available. In the laboratory, wuestite is routinely made using a gel method and its optical properties have been measured for astronomical purposes. Of course, in the presence of excess oxygen, ferrous oxide burns explosively at temperatures exceeding 600 K, but - in view of kinetic considerations - that may not be very relevant for interstellar conditions (where temperatures seldomly reach such high values), anyway. Here, in view of these discussions in the literature, we merely examine the effect of small FeO inclusions in silicate grains on the 9.7 and 18 µm silicate profiles if they were present in the ISM.
Spherical inclusions of FeO are considered here for interstellar silicates using the Bruggeman rule. As discussed by Henning et al. (1995), the presence of FeO in silicates has the affect of increasing the 18µm/9.7µm ratio and broadening both bands. The 9.7 µm and 18 µm features shift blueward and redward, respectively, as the volume of FeO inclusions is increased. Thus, adding FeO (spherical) inclusions to solid olivine-glass or pyroxene-glass spheres would worsen the match to the interstellar spectrum. For solid olivine-glass spheres, FeO inclusions increases the depth of the 18 µm band, and for solid pyroxene-glass spheres, the 10 µm band is shifted to even shorter wavelengths. Similarly, adding FeO to porous spheres does not improve the fit. Therefore, iron oxides are probably not a significant grain component in ISM dust.
5.2.7 Summary
Considering the parameter space investigated here, we find two equally good matches to the 9.7 and 18 µm silicate absorption profiles. Our criteria for a good match are as follows: the extinction profile should fit the relative depths, the central wavelengths, and the wings of both the 9.7 and 18 µm absorption features. One good match is achieved by co-adding the extinction profiles of olivine-glass and pyroxene-glass spheres with 50% porosity. An equally good match is given by the co-addition of pyroxene-glass and olivine-glass solid CDE. Both these fits require a greater contribution by mass from pyroxene-glass relative to olivine-glass. This differs from the conclusion reached by Kemper, Vriend & Tielens (2004) that olivine glasses account for the majority of the mass of diffuse ISM silicates. However, these authors consider only the 9.7 µm feature which we also find is best matched with olivine glasses if considered by itself.
Several of the calculated extinction profiles shown result in unsatisfactory fits to the observed silicate profiles. While the extinction profile for solid olivine-glass spheres matches the observed 9.7 µm silicate profile well, it does not match the central wavelength or relative depth of the 18 µm feature (Fig. 6, top left). On the other hand, solid pyroxene-glass spheres match the 18 µm feature, but not the 9.7 µm feature. Co-adding the pyroxene-glass and olivine-glass profiles for solid spheres does not improve the fit (Fig. 6, bottom left). Fig. 6 (top right) shows that adding porosity improves the fit for pyroxene-glass spheres, though the blue wing of the 9.7 µm feature is not well-matched. Porous olivine-glass spheres do not match either the 9.7 or 18 µm profiles. Neither the solid CDE or porous CDE extinction profiles for pyroxene or olivine glasses on their own result in satisfactory fits to the observed silicate features (Fig. 7).
Aluminosilicates are good candidates for the opacity in the trough region between the two silicate absorption features. Many of the calculated extinction profiles also match the 18 µm profile and the relative depths of the features well. However, these minerals do not provide a good match to the 9.7 µm profile shape or peak wavelength. Thus, we conclude that these minerals are unlikely to account for the observed features on their own, but could partially contribute to the observed absorption. We also find that the presence of iron oxides cannot be accounted for in the observed ISM spectrum.
6 The Lifecycle of Interstellar Silicates
The lifecycle of interstellar silicates starts with the nucleation and chemical growth at high densities and temperatures in the ejecta from stars such as Asymptotic Giant Branch stars and supergiants. This ejected material is rapidly mixed with other gas and dust in the interstellar medium. In the interstellar medium, dust cycles many times between the intercloud and cloud phases until it either is destroyed by fast ( km/s) supernova shocks or is incorporated into newly formed stars or planetary systems.
Infrared observations with the Infrared Space Observatory have revealed that crystalline silicates are abundant (% by volume) in the initial stages – the ejecta from stars – as well as in the last stages of its life cycle – circumstellar disks around Herbig AeBe stars and T-Tauri stars – but are absent in the middle portion of this evolutionary scenario (Sylvester et al. 1999; Kemper et al. 2004, 2005; Malfait et al. 1999; Waters & Waelkens 1998). Indeed, the smooth profile of the 9.7 µm silicate feature implies that the crystalline-to-amorphous silicate fraction is less than 1% in the interstellar medium (Kemper et al. 2004, 2005). Likely, the crystalline silicates injected in to the interstellar medium by stars are amorphized by high energy galactic cosmic rays on a timescale (70 million years; Bringa et al. 2005) which is short compared to interstellar dust evolution timescales ( million years; Jones et al. 1996). The observed high abundance of crystalline silicates in circumstellar disks surrounding young stars must then reflect subsequent processing of grains in these environments. Recent mid-infrared spectroscopic interferometry on AU-scale-sizes has revealed the presence of a strong gradient in the crystallinity of silicates in the disks of the three objects investigated (van Boekel et al. 2004). Likely this reflects the rapid annealing in the hot inner regions of these disks coupled with turbulent diffusion outward of the crystalline grains.
7 Elemental Abundances
The fraction of the elements locked up in interstellar dust grains provides a key test for any realistic dust model (e.g. Snow & Witt 1996; Mathis 1996). Interstellar abundances have recently been reviewed by Sofia & Meyer (2001) who show that young ( Gyr) F and G stars and the Sun provide the best representations of the interstellar abundances.
We calculate the silicate abundance per unit hydrogen atom for both solid and 50% porosity silicate (olivine-glass and pyroxene-glass) spheres and CDE, and tabulate the results in Table 5. The final row in Table 5 lists the silicate abundance using a mixed population of olivine-glass and pyroxene-glass grains. We assume an average total hydrogen column density per unit extinction () of cm-2 mag-1, with a typical scatter of less than 30% over a wide range of (Bohlin et al. 1978). We take , determined for the interstellar medium (Roche & Aitken 1984). Then, the abundance of silicate atoms relative to hydrogen locked up in solid form is,
| (10) |
where and are the specific density and the atomic mass per silicon atom of the silicate material. Our discussion on elemental abundances will be based on the evaluation by Sofia & Meyer (2001). They conclude that the atomic Si available to be incorporated into dust is between per H atom, enough to alleviate the Si underabundance problem proposed by Snow & Witt (1996), for many (but not all) silicate dust models. Using solid olivine-glass and/or pyroxene-glass spheres to account for the observed silicate profiles requires 5 to 49% more than the available Si. Similarly, modeling the silicate absorption features with solid pyroxene-glass CDE requires somewhat more than the available Si. Assuming that interstellar silicate grains are porous allows the interstellar features to be accounted for without using up the available Si. There is enough available Mg and O to be incorporated into silicate grains. The elemental abundance of Fe, on the other hand, poses a problem for olivine-glass grains unless porous grains are used (Table 5).
Comparison of elemental abundances in the cold neutral medium as compared to the warm neutral medium suggests that a fraction of 0.3 of the elemental Si is locked up as a dust component which is not as refractory as silicate materials and is more readily destroyed by interstellar shocks (Sembach & Savage 1996; Tielens 1997). If we assume that we only have Si per H-atom available for interstellar silicate dust, all models would fail the test (Table 5). However, porous spheres and CDE models would come the closest. The small discrepancy may just reflect a small difference in the elemental abundance of silicon in the direction of the inner Galaxy due to the elemental abundance gradient of the galaxy. From other elements, we estimate that this may amount to an increase in the Si abundance of a factor of 1.2 over the typical distance (2 kpc) for which the local value of was determined.
8 Other dust components
Silicon carbide is produced in the outflows of carbon-rich low-mass asymptotic giant branch stars (Blanco et al. 1994; Groenewegen 1995; Speck et al. 1997) and is incorporated into meteoritic dust (Anders & Zinner 1993 and references therein). It should be prevalent in ISM dust, but limits of % have been placed on its abundance (Whittet, Duley, & Martin 1990).
There is no evidence for SiC grains in the observed spectra. We put a limit on the amount of SiC present in the ISM using the (uncorrected) extinction efficiencies given by Borghesi et al. (1987) for -SiC since it peaks near the observed carbon-star emission feature. Its extinction efficiency is ( cm-1. Assuming a specific density g cm-3, the mass absorption coefficient, is calculated to be 7780 cm2 g-1. To calculate the column density of Si atoms contained in SiC grains, we use the equation (Whittet et al. 1990)
| (11) |
where is equal to 0.7, the mass-fraction of Si in SiC. The optical depth is calculated from the spectra of WR 98a and WR 112. We do not use the WR 104 spectrum since, at wavelengths longer than 11 µm, it significantly deviates from the mean of the other 3 spectra. For WR 118, olivine-glass and pyroxene-glass already slightly overcompensate for the absorption around 11.3 µm.
We use a -fitting routine to determine the maximum allowable depth of -SiC in the WR 98a and WR 112 spectra using a three-component fit (-SiC, olivine-glass and pyroxene-glass solid spheres). We determine 0.016 and 0.019 for WR 98a and WR 112, respectively. Thus, the limit on the fraction of Si in SiC with that in silicates is 0.03 and 0.04 for WR 98a and WR 112, respectively. The results of our calculations are tabulated in Table 6.
9 Extinction Curve
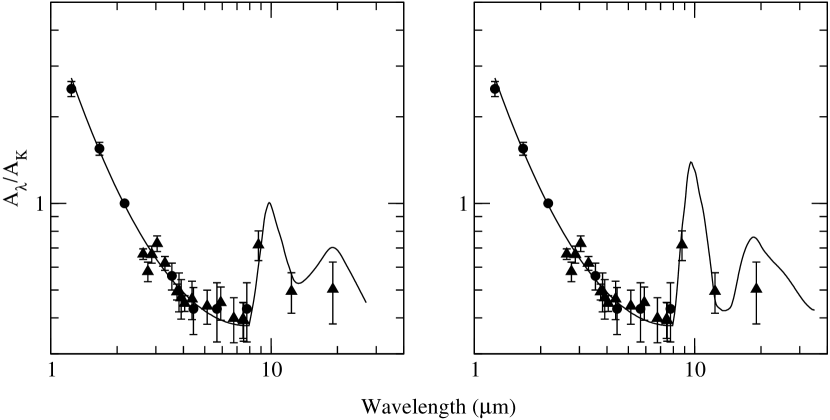
The extinction curve in the infrared is generally accepted to be uniform between 0.9 and 5 µm. Based on an extensive compilation of photometric data for dense clouds and diffuse ISM sightlines, Martin & Whittet (1990) suggest a universal interstellar extinction curve from 0.35 to 5 µm, represented by a power law, . Recently, Indebetouw et al. (2005) used photometric data from 1.25 to 8 µm of the Galactic plane from both the Spitzer-GLIMPSE program and 2MASS to investigate the interstellar extinction curve and extend its validity to 8 µm. They deduce the extinction law, , that is valid for the dense and diffuse ISM within the solar circle. These authors show that their extinction curve provides a reasonable match to the Lutz (1999) Galactic center (GC) values that were deduced from hydrogen recombination lines, demonstrating that, at least in the near-IR, the extinction in the local ISM and the GC are similar. We plot both data sets in Fig. 8, renormalizing the Lutz (1999) points to the K-band extinction, assuming magnitudes and magnitudes (Figer, McLean & Morris 1999). Given the good agreement of the Indebetouw et al. (2005) and the Lutz (1999) extinction points, we combined them and carried out a least-squares fit assuming the same functional form as Indebetouw et al. (2005) and find . We use this equation to represent the continuum extinction, assuming that at µm, the continuum remains constant and the silicate extinction dominates.
It is well-known that there is more silicate per unit of visual extinction toward the GC compared to the local ISM (e.g., Roche & Aitken 1984, 1985). Thus, longward of 8 µm, we need to construct individual extinction curves for the local ISM and the GC. To create the “GC extinction curve” we first normalize the silicate optical depth spectrum to the average visual extinction to silicate optical depth ratio, , determined by Roche & Aitken (1985) for the Galactic Center. The spectrum was then normalized to using the Figer et al. (1999) and values for the Galactic Center (see above). Finally, this curve was added to our continuum extinction curve assuming that the “continuum” remains constant longward of 8 µm. The final GC extinction curve is shown in Fig. 8 (left panel) and partially tabulated in Table 7. A complete downloadable version of the table is available in the electronic edition of the Journal.
To create a complete extinction curve for the local ISM, we carry out the same set of steps as for the GC, but this time we use , appropriate for the local ISM (Roche & Aitken 1984; Rieke & Lebofsky 1985). In order to normalize this to the extinction in the K band, we use = 0.09 (Whittet 2004). Finally, we add the normalized WR 98a silicate profile to the continuum extinction. The complete local interstellar extinction curve is shown in Fig. 8 (right panel). A partial list of tabulated values is shown in Table 7; a complete downloadable version of the table is available in the electronic edition of the Journal.
10 Summary and Discussion
In this paper, we examined the silicate absorption features observed in the diffuse ISM toward WC-type WR stars. As earlier work has shown, the observed 9.7 µm feature is most similar to the Cephei profile, and differs from the Trapezium profile. The latter is used by Draine & Lee (1984) to compute their “astronomical” silicate profile, and is found to be more similar to the silicate absorption features observed in dense clouds. We have produced infrared extinction curves appropriate for the GC and local ISM. These two curves, which range from 1.25 to about 30 µm are available for download in the electronic version of the Journal.
We find that pyroxene-glass silicates dominate by mass in the diffuse ISM silicates. Pyroxene-glass silicates are also found to dominate the spectra of YSOs (Demyk et al. 1999; Dorschner et al. 1995 and references therein; Jaeger et al. 1994). In contrast, for evolved stars, it has been estimated that no more than 10% of the amorphous silicates (by mass) are pyroxene-glass. It is unlikely that this reflects a genuine conversion of olivine to pyroxene glasses at the low temperatures of the diffuse interstellar medium. Rather, we attribute this difference to an incomplete sampling of the stellar sources that inject silicate dust into the interstellar medium. In particular, supernovae are conceivably an important source of interstellar dust. However, because of their scarcity in the solar neighborhood, infrared spectra of SN dust ejecta are virtual non-existing. With the launch of Spitzer and, particularly, its sensitive infrared spectrometer, IRS, this situation will hopefully quickly be remedied.
We note that, in our fits, interstellar amorphous silicates contain an appreciable fraction of iron. In contrast, crystalline silicates injected by late-type stars are in the form of forsterite and enstatite – the magnesium rich end members of the olivine (Mg2SiO4) and pyroxene (MgSiO3) families. Theoretically, the condensation behavior of iron in the ejecta of late-type stars is somewhat different than for the Solar Nebula. Indeed, at the low pressures of AGB winds, iron may not condense out until after the magnesium rich silicates have formed. In that case, because of the high super-saturation required for nucleation of metallic iron, rather than condensing as separate iron-metal grains, iron may react with these silicates to form mixed iron-magnesium silicates. Because this reaction occurs below the glass temperature of these silicates, this reaction would be expected to lead to the formation of glassy silicates (Tielens 1989). Within this scheme, the crystalline silicates would form at higher temperatures, well above the glass temperatures, by direct condensation from the gas phase.
As remarked above, the profile of the 9.7 µm feature in dense clouds and toward YSO’s has additional absorption in the wing compared to that of the diffuse ISM. While the profiles differ, the amorphous silicates in these different environments are generally assumed to be mineralogically similar. The additional absorption in dense clouds is generally attributed to a non-volatile dust species, whereas for the YSO’s the additional absorption is accounted for by simple ice species. Such fits are however not unique. Some processing of silicates may occur in the protoplanetary disks around protostars, resulting in a different mineralogy. This material may then be deposited into the surrounding molecular cloud through the powerful protostellar winds and hence the general interstellar medium (Tielens 2003). However, how much processing occurs in these environments and how well this material is mixed into molecular clouds and the general interstellar medium is presently not well understood.
Recently, genuine silicate stardust grains have been isolated in interplanetary dust particles(IDPs) (Messenger et al. 2003). Some of these grains are crystalline while others are amorphous. While most presolar grains found in this study of IDPs contain abundant O, Si, and Mg, their mineralogy is currently unknown. Only one grain is identified as forsterite. Moreover, some interstellar dust may have a very mundane isotopic (eg., Solar abundances) composition and these grains would be difficult to separate from Solar system condensates (Tielens 2003). Nevertheless, such studies hold the promise of direct information on various relevant aspects of interstellar silicates. We note that GEMS, Glass with Embedded Metals and Sulphides, are an abundant component of anhydrous IDPs (Bradley 1994). The detailed morphology and structure of these GEMS betrays an extensive ion-irradiation history (Bradley 1994). While this may reflect long exposure to the ISM, this irradiation may also have occurred in the early solar system environment (Tielens 2003; Westphal and Bradley 2004). The 9.7 µm band in GEMS-rich thin sections of IDPs is broad and featureless and, in that respect, resembles the 9.7 µm features observed towards YSOs, the Trapezium cluster, and Cep (Bradley et al. 1999). Of course, as demonstrated in this paper, these interstellar 9.7 µm features differ in detail. Nevertheless, these initial laboratory studies of solar system materials, which may well be directly related to interstellar silicate grains, are very promising. It is clear that many questions remain on the detailed structure and composition of interstellar silicates.
| Source | TDT | AOT |
|---|---|---|
| WR 98A | 09401206 | AOT01 |
| WR 104 | 09901207 | AOT01 |
| WR 112 | 10201908 | AOT01 |
| WR 118 | 10802509 | AOT01 |
| Source | ||
|---|---|---|
| K | K | |
| WR 98A | 790 | 180 |
| WR 104 | 840 | 110 |
| WR 112 | 680 | 90 |
| WR 118 | 1020 | 150 |
| Source | ||||
|---|---|---|---|---|
| WR 98A | 0.78 | 0.39 | 2.0 | 12.42 |
| WR 104 | 0.38 | 0.28 | 1.4 | 6.50 |
| WR 112 | 0.63 | 0.32 | 2.0 | 11.03 |
| WR 118 | 0.78 | 0.45 | 1.7 | 11.20 |
| Amorphous Silicate | Solid Spheres | Solid CDE | Porous SpheresaaA(V) from van der Hucht 2001. | Porous CDEaaFifty percent porosity. |
|---|---|---|---|---|
| Olivine (MgFeSiO4) | 0.880 | 0.926 | 0.616 | 0.620 |
| Pyroxene ((Mg0.5Fe0.5SiO3) | 0.983 | 0.997 | 0.666 | 0.656 |
| Amorphous Silicate | Solid Spheres | Solid CDE | Porous SpheresaaFifty percent porosity. | Porous CDEaaFifty percent porosity. |
|---|---|---|---|---|
| Olivine (MgFeSiO4) | 4.20 | 3.99 | 3.00 | 2.98 |
| Pyroxene (Mg0.5Fe0.5SiO3) | 4.80 | 4.74 | 3.55 | 3.60 |
| Olivine + Pyroxene | 4.34 | 3.89 | 3.14 | 3.07 |
| (3.28+1.06) | (1.52+2.37) | (0.87+2.27) | (0.27+2.80) |
| Source | Olivine | Pyroxene | N(total silicate) | N(-SiC) | N(SiSiC)/N(Sisilicates) |
|---|---|---|---|---|---|
| /H | cm-2 | ||||
| WR 98a | 3.02 | 1.15 | 98.4 | 3.07 | 0.03 |
| WR 112 | 2.86 | 1.34 | 88.0 | 3.65 | 0.04 |
| Wavelength | ||
|---|---|---|
| µm | local ISM | Galactic Center |
| 1.240 | 2.724 | 2.724 |
| 1.340 | 2.315 | 2.315 |
| 1.440 | 2.002 | 2.002 |
| 1.540 | 1.759 | 1.759 |
| 1.640 | 1.565 | 1.565 |
| 1.740 | 1.408 | 1.408 |
| 1.840 | 1.279 | 1.279 |
| 1.940 | 1.171 | 1.171 |
| 2.040 | 1.081 | 1.081 |
| 2.140 | 1.004 | 1.004 |
References
- Aitken et al. (1980) Aitken, D. K., Barlow, M. J., Roche, P. F., & Spenser, P. M. 1980, MNRAS, 192, 679
- Anders & Zinner (1993) Anders, E., & Zinner, E. 1993, Meteoritics, 28, 490
- Blanco et al. (1994) Blanco, A., Borghesi, A., Fonti, S., & Orofino, V. 1994, A&A, 283, 561
- Bohren & Huffman (1983) Bohren, C. F., & Huffman, D. R. 1983, Absorption and scattering of light by small particles (New York: Wiley)
- Bowey et al. (1998) Bowey, J. E., Adamson, A. J., & Whittet, D. C. B. 1998, MNRAS, 298, 131
- Bradley (1994) Bradley, J. P. 1994, Science, 265, 925
- Bradley et al. (1999) Bradley, J. P., et al. 1999, Science, 285, 1716
- Bringa et al. (2005) Bringa, E., et al. 2005, to be submitted to ApJ
- Bussoletti et al. (1987) Bussoletti, E., Colangeli, L., Borghesi, A., & Orofino, V. 1987, A&AS, 70, 257
- Cami (2002) Cami, J. 2002, Ph.D. Thesis
- Chiar & Tielens (2001) Chiar, J. E., & Tielens, A. G. G. M. 2001, ApJ, 550, L207
- Demyk et al. (2000) Demyk, K., Dartois, E., Wiesemeyer, H., Jones, A. P., & d’Hendecourt, L. 2000, A&A, 364, 170
- Demyk et al. (1999) Demyk, K., Jones, A. P., Dartois, E., Cox, P., & d’Hendecourt, L. 1999, A&A, 349, 267
- Dorschner et al. (1995) Dorschner, J., Begemann, B., Henning, T., Jaeger, C., & Mutschke, H. 1995, A&A, 300, 503
- Figer et al. (1999) Figer, D. F., McLean, I. S., & Morris, M. 1999, ApJ, 514, 202
- Forrest et al. (1975) Forrest, W. J., Gillett, F. C., & Stein, W. A. 1975, ApJ, 195, 423
- Gillett et al. (1975) Gillett, F. C., Forrest, W. J., Merrill, K. M., Soifer, B. T., & Capps, R. W. 1975, ApJ, 200, 609
- Groenewegen (1995) Groenewegen, M. A. T. 1995, A&A, 293, 463
- Grossman & Larimer (1974) Grossman, L., & Larimer, J. 1974, Rev. Geophys. Space Phys, 12, 71
- Henning et al. (1995) Henning, T., Begemann, B., Mutschke, H., & Dorschner, J. 1995, A&AS, 112, 143
- Henning et al. (1999) Henning, T., Il’In, V. B., Krivova, N. A., Michel, B., & Voshchinnikov, N. V. 1999, A&AS, 136, 405
- Heras & Hony (2005) Heras, A. M., & Hony, S. 2005, A&A, 439, 171
- Indebetouw et al. (2005) Indebetouw, R., et al. 2005, ApJ, 619, 931
- Jäger et al. (1994) Jäger, C., Mutschke, H., Begemann, B., Dorschner, J., & Henning, T. 1994, A&A, 292, 641
- Jones et al. (1996) Jones, A. P., Tielens, A. G. G. M., & Hollenbach, D. J. 1996, ApJ, 469, 740
- Jura (1980) Jura, M. 1980, ApJ, 235, 63
- Kemper (2002) Kemper, F. 2002, Ph.D. thesis, University of Amsterdam
- Kemper et al. (2002) Kemper, F., de Koter, A., Waters, L. B. F. M., Bouwman, J., & Tielens, A. G. G. M. 2002, A&A, 384, 585
- Kemper et al. (2004) Kemper, F., Vriend, W. J., & Tielens, A. G. G. M. 2004, ApJ, 609, 826
- Kemper et al. (2005) Kemper, F., Vriend, W. J., & Tielens, A. G. G. M. 2005, ApJ, 609, submitted
- Leech et al. (2002) Leech, K., et al. 2002, The ISO Handbook, Volume V: SWS - The Short Wavelength Spectrometer
- Malfait et al. (1999) Malfait, K., Waelkens, C., Bouwman, J., de Koter, A., & Waters, L. B. F. M. 1999, A&A, 345, 181
- Mathis (1996) Mathis, J. S. 1996, ApJ, 472, 643
- Mathis (1998) Mathis, J. S. 1998, ApJ, 497, 824
- Mennella et al. (1995) Mennella, V., Colangeli, L., & Bussoletti, E. 1995, A&A, 295, 165
- Messenger et al. (2003) Messenger, S., Keller, L. P., Stadermann, F. J., Walker, R. M., & Zinner, E. 2003, Science, 300, 105
- Moneti et al. (2001) Moneti, A., Stolovy, S., Blommaert, J. A. D. L., Figer, D. F., & Najarro, F. 2001, A&A, 366, 106
- Ossenkopf (1991) Ossenkopf, V. 1991, A&A, 251, 210
- Posch et al. (2002) Posch, T., Kerschbaum, F., Mutschke, H., Dorschner, J., & Jäger, C. 2002, A&A, 393, L7
- Roche & Aitken (1984) Roche, P. F., & Aitken, D. K. 1984, MNRAS, 208, 481
- Roche & Aitken (1985) Roche, P. F., & Aitken, D. K. 1985, MNRAS, 215, 425
- Salpeter (1977) Salpeter, E. E. 1977, ARA&A, 15, 267
- Sembach & Savage (1996) Sembach, K. R., & Savage, B. D. 1996, ApJ, 457, 211
- Smith et al. (1990) Smith, C. H., Aitken, D. K., & Roche, P. F. 1990, MNRAS, 246, 1
- Smith et al. (2000) Smith, C. H., Wright, C. M., Aitken, D. K., Roche, P. F., & Hough, J. H. 2000, MNRAS, 312, 327
- Snow & Witt (1996) Snow, T. P., & Witt, A. N. 1996, ApJ, 468, L65
- Sofia & Meyer (2001) Sofia, U. J., & Meyer, D. M. 2001, ApJ, 554, L221
- Speck et al. (1997) Speck, A. K., Barlow, M. J., & Skinner, C. J. 1997, MNRAS, 288, 431
- Sylvester et al. (1999) Sylvester, R. J., Kemper, F., Barlow, M. J., de Jong, T., Waters, L. B. F. M., Tielens, A. G. G. M., & Omont, A. 1999, A&A, 352, 587
- Tielens (1989) Tielens, A. G. G. M. 1989, in From Miras to planetary nebulae: Which path for stellar evolution (Paris: Edition Frontieres), 186
- Tielens (1990) Tielens, A. G. G. M. 1990, in Carbon in the Galaxy: Studies from Earth and Space, 59
- Tielens (1997) Tielens, A. G. G. M. 1997, Ap&SS, 251, 1
- Tielens (2003) Tielens, A. G. G. M. 2003, Science, 300, 68
- Tielens & Allamandola (1987) Tielens, A. G. G. M., & Allamandola, L. J. 1987, in Physical processes in interstellar clouds; Proceedings of the NATO Advanced Study Institute, Irsee, Federal Republic of Germany, Aug. 18-28, 1986 (Dordrecht: D. Reidel Publishing Co.), 333
- Tsuji (2000) Tsuji, T. 2000, ApJ, 540, L99
- van Boekel et al. (2004) van Boekel, R., et al. 2004, Nature, 432, 479
- van der Hucht et al. (1996) van der Hucht, K. A., et al. 1996, A&A, 315, L193
- Waters & Waelkens (1998) Waters, L. B. F. M., & Waelkens, C. 1998, ARA&A, 36, 233
- Westphal & Bradley (2004) Westphal, A. J., & Bradley, J. P. 2004, ApJ, 617, 1131
- Whittet (2003) Whittet, D. C. B. 2003, Dust in the Galactic Environment (2nd ed.) (Bristol: Institute of Physics (IOP) Publishing)
- Whittet et al. (1988) Whittet, D. C. B., Bode, M. F., Longmore, A. J., Admason, A. J., McFadzean, A. D., Aitken, D. K., & Roche, P. F. 1988, MNRAS, 233, 321
- Whittet et al. (1990) Whittet, D. C. B., Duley, W. W., & Martin, P. G. 1990, MNRAS, 244, 427
- Williams et al. (1987) Williams, P., van der Hucht, K., & Thé, P. 1987, A&A, 182, 91
- Wolff et al. (1993) Wolff, M. J., Clayton, G. C., & Meade, M. R. 1993, ApJ, 403, 722