On the Origin of Sulfur
Abstract
We present our work on the halo evolution of sulfur, based on observations of the S I lines around Å for ten stars for which the S abundance was obtained previously from much weaker S I lines at Å. We cannot confirm the rise and the high [S/Fe] abundances for low [Fe/H], as claimed in the literature from analysis of the Å lines. The reasons for claims of an increase in [S/Fe] with decreasing [Fe/H] are probably twofold: uncertainties in the measurements of the weak 8694 Å lines, and systematic errors in metallicity determinations from Fe I lines. The near-infrared sulfur triplet at , , and Å are preferred for an abundance analysis of sulfur for metal-poor stars. Our work was presented in full by Ryde & Lambert (2004).
Department of Astronomy and Space Physics, Uppsala University, SE-751 20 Uppsala, Sweden
ryde@astro.uu.se
The W.J. McDonald Observatory, University of Texas at Austin, Austin TX 78712, USA
dll@astro.as.utexas.edu
There has recently been a debate in the literature on the chemical evolution of sulfur in the halo phase of the Milky Way ([Fe/H] ). Israelian & Rebolo (2001) and Takada-Hidai et al. (2002) claim a monotonic rise in [S/Fe] for decreasing [Fe/H] based on an analysis using weak sulfur lines at 8694 Å measured in spectra of approximately ten stars each. This rise has consequences for our understanding of the sites of formation of sulfur in the Universe.
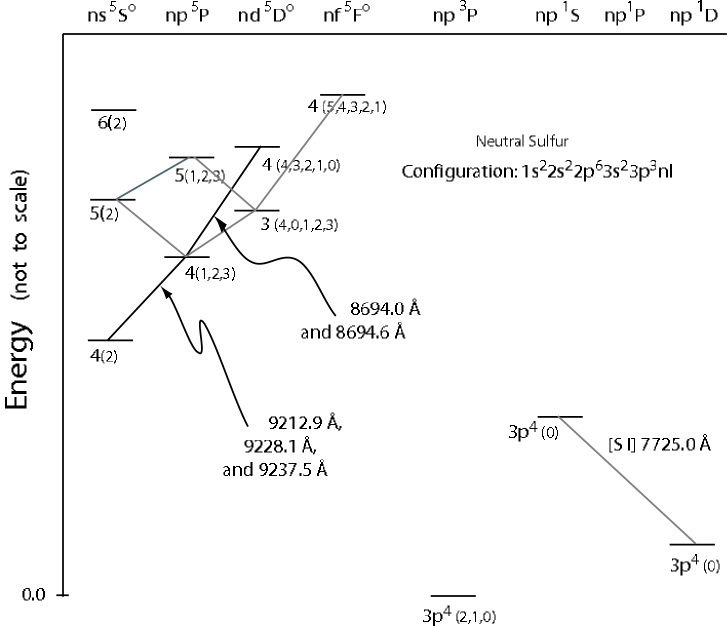
Is there a rise or not? In order to answer this question, we have reinvestigated ten of the stars examined previously, by analysing the infrared triplet lines of neutral sulfur at 9220 Å instead of the weaker 8694 Å lines used before. The lines are indicated in the Grotrian diagram shown in Figure 1. The lower levels of the 8694 Å lines are the upper levels of the 9220 Å lines and hence the excitation potential difference is 1.34 eV.
We observed the stars with the 2dCoudé spectrometer (Tull et al. 1995) at McDonald Observatory in 2001. Our stars are a mix of dwarfs and giants spanning a temperatures range of K, and a metallicity range from [Fe/H] down to [Fe/H]. Exposure times ranged from half-an-hour to three hours per star. In our analysis, we use the model atmosphere parameters used by Israelian & Rebolo (2001) and Takada-Hidai et al. (2002) with the exception that the metallicity is re-determined from Fe II lines, which are not much affected by non-LTE effects, instead of the more uncertain determination of the metallicity based on an non-LTE analysis of Fe I lines.
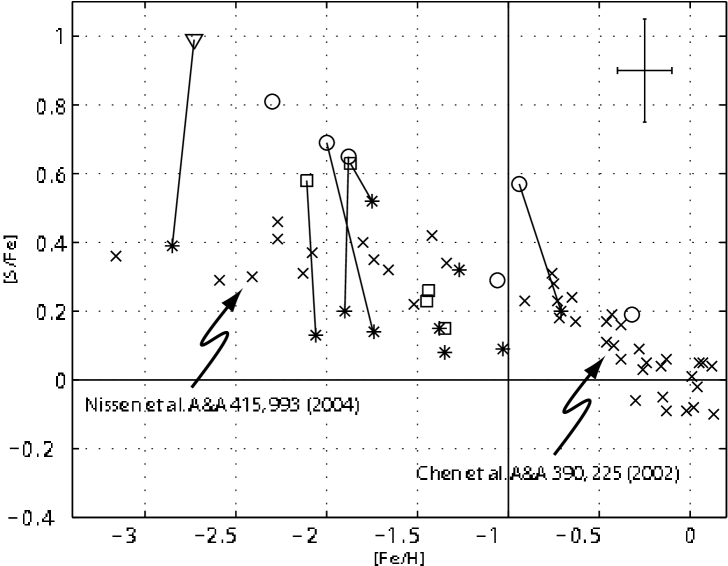
We do not confirm the rise in [S/Fe] with decreasing [Fe/H] in the halo phase. Instead, we confirm that [S/Fe] attains a plateau for the halo phase of the Galaxy, also shown by Nissen et al. (2004), see Figure 2. Thus, sulfur behaves similarly to alpha elements (e.g., Mg, Si, and Ca), indicating that the primary source for sulfur atoms in the Universe is Supernovae Type II explosions.
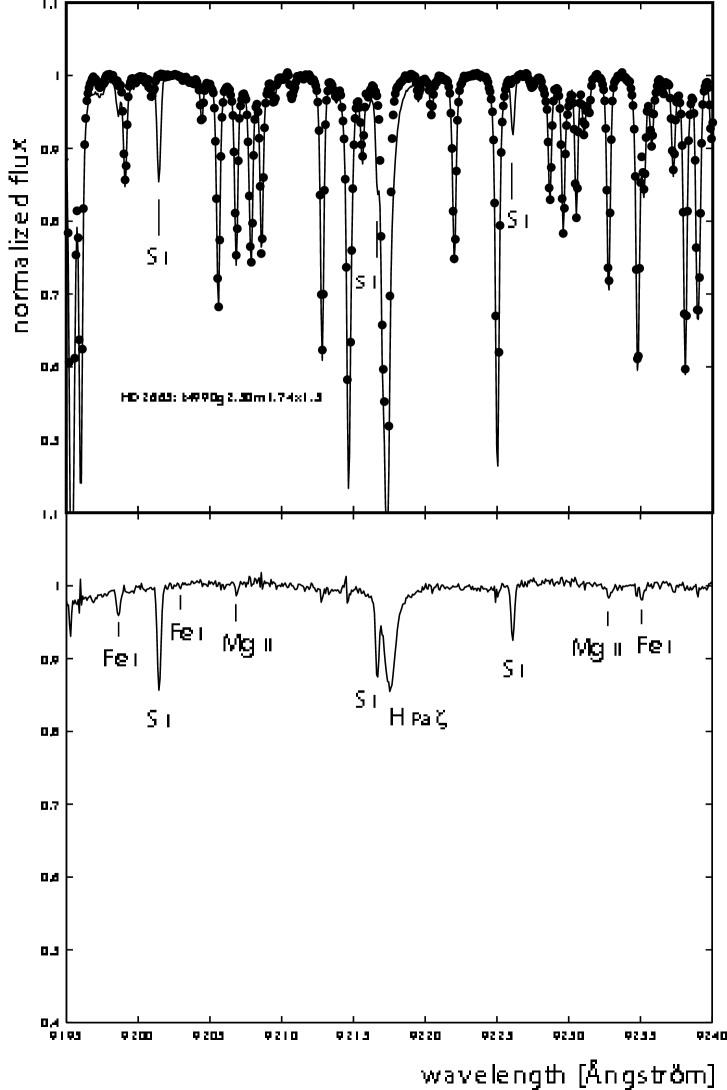
A significate advantage of the near-IR lines over the 8694 Å lines in the study of halo stars is their factor of ten larger equivalent widths. An apparent disadvantage of the near-IR lines is the ubiquitous telluric vater-vapor lines in this region. By observing a rapidly-rotating hot star at a similar air mass to each halo star observation, the water vapor lines may be divided out, as shown in Figure 3.
References
- Bashkin & Stoner (1978) Bashkin, S. & Stoner, J. O., 1978, Atomic energy levels and Grotrian Diagrams –‘ Vol.2: Sulfur I - Titanium XXII Amsterdam: North-Holland Publ. Co.
- Chen et al. (2002) Chen, Y. Q., Nissen, P. E., Zhao, G., & Asplund, M., 2002, A&A 390, 225
- Israelian & Rebolo (2001) Israelian, G. & Rebolo, R., 2001, ApJ 557, L43
- Nissen et al. (2003a) Nissen, P. E., Chen, Y. Q., Asplund, M., & Pettini, M., 2003a, in N. Piskunov & W. Weiss (eds.), Modelling of Stellar Atmospheres, IAU Symposium No. 210, in press
- Nissen et al. (2004) Nissen, P. E., Chen, Y. Q., Asplund, M., & Pettini, M., 2004, A&A 415, 993
- Ryde & Lambert (2004) Ryde, N., & Lambert, D. L., 2004, A&A 415, 559
- Takada-Hidai et al. (2002) Takada-Hidai, M., Takeda, Y., Sato, S., et al., 2002, ApJ 573, 614
- Tull et al. (1995)