A Search for Radio Gravitational Lenses, using the Sloan Digital Sky Survey and the Very Large Array
Abstract
We report on a novel search for radio gravitational lenses. Using the Very Large Array, we imaged ten candidates with both dual redshifts in Sloan Digital Sky Survey spectra and 1.4 GHz radio flux mJy in the FIRST survey. The VLA maps show that in each case the radio emission is associated with the foreground galaxy rather than being lensed emission from the background galaxy, although at least four of our targets are strong lenses at optical wavelengths. These SDSS dual-redshift systems do not have lensed radio emission at the sensitivity of current radio surveys.
Subject headings:
gravitational lensing — galaxies: elliptical and lenticular, cD — galaxies: starburst1. Introduction
Strong gravitational lenses have long been recognized for their unique ability to constrain the mass distributions of galaxies. There over 100 currently known lenses (Muñoz et al.,, 1999; Browne et al.,, 2003), most of which have been discovered as bright quasars that show multiple images surrounding a faint lensing galaxy. Although this is a sizable number of lenses, it is a significant limiting factor for the statistical study of galaxy properties, thus the identification of new lenses remains an important ongoing effort. Compounding the challenges of studying galaxy properties through lensing is that it is often difficult to acquire the requisite photometry, redshifts, and internal kinematics of the lens galaxies themselves due to the selection effects created by identifying lenses from bright images.
The Sloan Digital Sky Survey (SDSS; York et al., (2000)) is providing new opportunities to search for gravitational lenses in an information rich environment. The photometry and spectroscopy available for all SDSS objects means that detected lens galaxies automatically have redshifts, kinematics and photometry. Efforts have been underway for several years to exploit the SDSS archive in combination with other resources, such as the HST, that have had considerable success identifying several new lenses (Bolton et al.,, 2005; Oguri et al.,, 2004, 2005; Pindor et al.,, 2004; Johnston et al.,, 2003; Inada et al.,, 2003; Morgan et al.,, 2003).
Among these projects is a unique sample of spectroscopically selected lens candidates from SDSS compiled by Bolton et al., (2004). This sample has lead to the discovery of several new lenses (Bolton et al.,, 2005; Bolton & Burles,, 2005) and has the distinct advantage that any confirmed lens system has known lens and source redshifts as well as an optically bright lens galaxy.
Radio lenses, in which a radio bright source is lensed by a radio dim lens, are an interesting subset of gravitational lenses. In this paper we describe an exploratory effort to utilize the SDSS archive and the FIRST radio catalog (Becker et al.,, 1995) to provide a bridge from optically selected lens candidates to viable radio candidates. By correlating sources in the FIRST catalog with the spectroscopically selected sample of SDSS galaxies of Bolton et al., (2004) and additional similar galaxies, targets emerge that exhibit both radio emission and dual redshifts in optical spectra. If the radio emission is from the background object, there is a high probability of lensing.
The use of these two surveys together has been proposed as a possible method to reduce the candidate list for gravitational lens surveys by future radio telescopes such as the Square Kilometer Array (SKA) that should be able to detect large numbers of faint radio lenses (Bowman et al.,, 2004).
2. Lensing Candidates
We started with a sample of 117 gravitational lens candidates drawn from the SDSS luminous red galaxy (LRG) sample (Eisenstein et al.,, 2001) and absorption-dominated spectra of the main galaxy sample (Strauss et al.,, 2002). These are massive red galaxies which should act as effective gravitational lenses. Candidates were assigned a redshift in the range 0.15-0.65 by the specBS software (Schlegel et al.,, 2005).
A search procedure using a matched filter method found spectra with nebular emission lines at higher redshift than that of the red galaxy (Bolton et al.,, 2004). This method detects the emission line [OII] at S/N, and at least two of the emission lines H, O[III] and O[III] at S/N, all at the same redshift. These emission lines are generated in nebulae around young massive stars (age Myr), when ultraviolet radiation from the young stars is absorbed shortward of the Lyman limit and re-emitted at optical wavelengths. Nebular emission lines are strong in galaxies with many young stars and a high star formation rate (Kennicutt,, 1998). The presence of at least three emission lines indicates that a higher redshift star-forming galaxy lies near the red galaxy, probably within the 3″SDSS fiber. If the impact parameter is small enough, gravitational lensing may occur. Our sample, including the 49 LRG candidates from Bolton et al., (2004) and 68 additional candidates from the main galaxy sample, is the subject of many follow-up observations to determine which candidates are lenses.
To find radio lens candidates, we cross matched the 117 candidates with the 1.4 GHz FIRST radio survey (Becker et al.,, 1995), and found that 13 candidates were within 15 of a FIRST source. The FIRST radio emission may have been associated with either the foreground red galaxy or the background star-forming galaxy. In the latter case, the foreground galaxy may lens the background emission.
The FIRST survey has angular resolution 4″, and so FIRST images cannot show lensing morphologies on a scale of 1-2″. We made radio observations at higher angular resolution to look for evidence of lensing, as described in the following section. We selected nine candidates with a FIRST flux greater than 2.0 mJy and excluded three candidates below this flux limit. J0037-0942 is known to be a lens from optical integral field spectroscopy, and we included this known lens although its FIRST flux is 1.39 mJy. Table 1 lists the sample of ten candidates, giving the full SDSS names. For the remainder of the paper, we abbreviate the names. Note that lens image separations for an isothermal sphere model are calculated from the redshifts and foreground galaxy velocity dispersions, giving an expected scale for lensing in the system.
| Candidate | (km/s) | (″) | ||
|---|---|---|---|---|
| SDSS J003753.21-094220.1 | 0.1955 | 0.6322 | 279 10 | 2.94 |
| SDSS J073728.44+321618.6 | 0.3223 | 0.5812 | 338 16 | 2.67 |
| SDSS J081323.37+451809.4 | 0.1834 | 0.6435 | 237 13 | 2.20 |
| SDSS J095629.78+510006.3 | 0.2405 | 0.4700 | 334 15 | 2.94 |
| SDSS J113629.47-022303.9 | 0.3936 | 0.4646 | 321 27 | 0.81 |
| SDSS J120540.43+491029.3 | 0.2150 | 0.4807 | 235 10 | 1.62 |
| SDSS J130613.65+060022.1 | 0.1730 | 0.4722 | 242 17 | 2.04 |
| SDSS J140228.22+632133.3 | 0.2046 | 0.4814 | 267 17 | 2.23 |
| SDSS J155030.75+521759.8 | 0.4564 | 0.5388 | 345 52 | 0.92 |
| SDSS J225125.87-092635.8 | 0.4719 | 0.6238 | 414 47 | 2.09 |
Note. — The properties of our lens candidates as inferred from the SDSS spectra. is the redshift of the foreground red galaxy, is the redshift of the emission lines superimposed on the galaxy spectrum and is the velocity dispersion of the foreground galaxy. is the separation of the two lensed images in a singular isothermal sphere model with the measured , and gives an expected angular scale for gravitational lensing.
3. Observations
The ten candidates were observed in 8.4 GHz continuum mode with the NRAO Very Large Array (VLA) on 2004 October 7 and 2004 November 7. The VLA was in A configuration, giving angular resolution 024 (Taylor et al.,, 2004). The observations were intended to detect multiple lensed components, with double lenses being detectable up to a flux ratio of 10:1. The total 8.4 GHz flux was estimated from the 1.4 GHz flux in the FIRST survey, assuming a radio galaxy spectral index . The integration time for each target was set to detect at the level a component with of the estimated flux, and varied from 9 to 72 minutes. Details of the observations are given in Table 2.
| Candidate | (GHz) | rms (Jy/beam) |
|---|---|---|
| J0037-0942 | 8.4 | 19 |
| J0037-0942 | 4.9 | 26 |
| J0037-0942 | 1.4 | 71 |
| J0737+3216 | 8.4 | 38 |
| J0813+4518 | 8.4 | 34 |
| J0956+5100 | 8.4 | 33 |
| J1136-0223 | 8.4 | 15 |
| J1205+4910 | 8.4 | 16 |
| J1306+0600 | 8.4 | 16 |
| J1402+6321 | 8.4 | 19 |
| J1550+5217 | 8.4 | 39 |
| J2251-0926 | 8.4 | 20 |
Note. — The observing frequency and rms noise (measured from the maps) for each of our targets.
The data were flagged, calibrated and imaged in AIPS, following standard procedures. Maps were made with pixel sizes of , with slight variations depending on declination. J0813+4518 and J0956+5100 only showed low brightness emission, and therefore these maps (Figures 5 and 6) were not deconvolved. All other sources were deconvolved using the CLEAN algorithm.
Two components were seen in the 8.4 GHz maps of J0037-0942, and it was initially thought that the source might be a lens. Additional VLA time was available due to a gap in the schedule, and on 2004 November 10 this system was observed for 44 minutes at 4.9 GHz and for 20 minutes at 1.4 GHz. These maps (Figures 2 and 3) have angular resolutions of 04 and 14, respectively (Taylor et al.,, 2004).
4. Results
Strong gravitational lensing of a background point source generates two or four bright images, offset from the position of the background object. Two bright images form on either side of the foreground lens galaxy, or four bright images form in a ring around the lens galaxy. If the background source is extended then the images may appear as tangential arcs. The separation of two bright images or the diameter of a ring of images should be close to the separations predicted for an isothermal sphere model, as given in Table 1. The 8.4 GHz VLA maps were examined for multiple or ring-like components that would be generated by gravitational lensing.
Lens images should be offset from the foreground galaxy by about half the expected lens image separation given in Table 1, typically 05-10. The sizes and relative positions of radio components have errors of 012, equal to half the 024 angular resolution of the VLA maps. In matching radio components to the foreground galaxy we also consider the resolution of SDSS and the absolute astrometry of both systems. For the VLA maps we used phase calibrators with A or B positional accuracy codes, giving absolute astrometry accurate to 01 (Perley & Taylor,, 2003). SDSS objects have absolute astrometric errors up to 0105 (Pier et al.,, 2003), while we conservatively assume a 01 error in measuring the centroid of the foreground galaxy, as the centroiding algorithms differ by up this amount (Pier et al.,, 2003). Adding these four errors in quadrature gives an overall error of 02 in the registration of radio components to the centroid of the SDSS red galaxy. If lensing occurs, an offset of at least 05 between the foreground galaxy and the lensed images should be obvious.
J0037-0942 was initially considered as a gravitational lens, although we have now concluded that the radio flux is not lensed (see below). The remaining nine targets are clearly not lenses on the basis of the radio morphology. The radio maps do not show separate sources either side of the foreground galaxy, or a ring of emission around the galaxy. The radio emission is peaked at or very near the location of the foreground galaxy, and sometimes shows the lobes typical of radio galaxies. The following sections discuss the individual sources in detail.
4.1. J0037-0942
J0037-0942 was initially considered as a lens, as it has two separate components (Figures 1, 2 and 3). The components are 0701 apart at 8.4 GHz, 1002 apart at 4.9 GHz, and blended together in the low resolution 1.4 GHz map. The stronger component overlaps the foreground galaxy, appearing slightly to the east of it at 8.4 GHz and slightly to the west at 4.9 GHz. The weaker component appears to the east of the foreground galaxy, and shifts slightly to the north at 4.9 GHz. The increased separation at 4.9 GHz relative to 8.4 GHz indicates a varying spectral index, with both components having steeper spectral indices on their outer edges.


As the peak of the radio emission overlaps the red galaxy, and the radio components are much closer together than the predicted lens image separation of 29 (Table 1), we conclude that the radio flux is generated by the foreground object and is not lensed emission from the background star-forming galaxy. The source has a bright core near the center and a weaker lobe 07-10 to the east (a projected distance 2-3 kpc 111We assume a CDM cosmology with km/s, , throughout).
J0037-0942 is a gravitational lens at optical wavelengths, based on integral field spectroscopy (Bolton & Burles,, 2005). Narrow-band images at the redshifted emission line wavelengths show two images of the background star-forming galaxy, 30 apart and either side of the foreground red galaxy (the image positions are shown by crosses in Figures 1 , 2 and 3). The optical lens images are at very different positions to the radio components and have a much larger separation. The considerable difference between the optical morphology and the radio morphology strengthens the case that the radio emission comes from the foreground galaxy.
4.2. J0737+3216
The VLA map shows a point source from the SDSS position (Figure 4). There is no evidence for multiple components and the radio emission overlaps the foreground galaxy. We conclude that the radio flux is not lensed emission from the background galaxy. The foreground galaxy appears to host a radio source with projected size kpc.

J0737+3216 is a gravitational lens at optical wavelengths, based on integral field spectroscopy (Bolton & Burles,, 2005). Narrow-band images at the redshifted emission line wavelengths show two images of the background star-forming galaxy around the foreground red galaxy, a point on one side and a tangential arc on the other (the image positions are shown by crosses and plus signs in Figure 4). None of the images is near the radio point source. The extreme difference between the optical morphology and the radio morphology strengthens the case that the radio emission comes from the foreground galaxy.
4.3. J0813+4518
The VLA map shows a roughly linear structure extended over , with a peak at the SDSS position (Figure 5). Although the size matches the expected lensing scale of 22 (Table 1), the continuous linear morphology is not characteristic of lensing and the peak of the emission overlaps the foreground galaxy. We conclude that the radio flux is not lensed emission from the background galaxy. The foreground galaxy appears to be a radio galaxy with a projected size kpc.

4.4. J0956+5100
The VLA map shows a roughly linear structure extended over , with a peak at the SDSS position (Figure 6). The size is much less than the predicted lensing scale of 29 (Table 1), the continuous linear morphology is not characteristic of lensing and the peak of the emission overlaps the foreground galaxy. We conclude that the radio flux is not lensed emission from the background galaxy. The foreground galaxy appears to be a radio galaxy with a projected size kpc.

J0956+5100 is a gravitational lens at optical wavelengths, based on integral field spectroscopy (Bolton & Burles,, 2005). Narrow-band images at the redshifted emission line wavelengths show two images of the background star-forming galaxy either side of the foreground red galaxy, each stretched into a tangential arc (the image positions are shown by plus signs in Figure 6). Neither lens arc is close to the linear radio source. The extreme difference between the optical morphology and the radio morphology strengthens the case that the radio emission comes from the foreground galaxy.
4.5. J1136-0223
The VLA map shows a linear double structure with peaks apart, either side of the SDSS position (Figure 7). The peak separation is not much less than the predicted lens image separation of 08 (Table 1), but the continuous linear morphology is not characteristic of lensing. We conclude that the radio flux is not lensed emission from the background galaxy. The foreground object appears to be a radio galaxy with projected linear size kpc.

4.6. J1205+4910
The VLA map shows an unresolved mJy source west of the center of the foreground galaxy (Figure 8). No other component is detected to a limit 0.08 mJy ( noise limit of the map). If the system were an asymmetric lens, then the next brightest image would be more than 15 times fainter than the brightest image. Faint images form closer to the foreground galaxy than the brightest image, so the images would be apart. Since the expected separation of lens images for this system is (Table 1), J1205+4910 is not an asymmetric lens. It is likely that the foreground red galaxy is a radio galaxy with a bright lobe kpc from its center in projection. Given the offset between the radio and optical positions, we may even be seeing a radio source at a third redshift.

4.7. J1306+0600
The VLA map shows a triple source with a strong central peak overlapping the SDSS position. There is extended emission leading to a secondary peak to the north and another peak to the south (Figure 9). The separation of the peaks is , as opposed to an expected lensing scale of (Table 1), and the linear morphology is not characteristic of lensing; we conclude that the radio flux is not lensed emission from the background galaxy. The foreground galaxy appears to be a radio galaxy with projected size .

4.8. J1402+6321
The VLA map shows a strong unresolved source at the SDSS position, with faint extended emission to the north (Figure 10). Lens images are predicted to have a much larger separation of 22 (Table 1) and the strong emission peak at the location of the foreground object is not characteristic of lensing. We conclude that the radio flux is not lensed emission from the background galaxy. The foreground galaxy appears to host a radio galaxy with a central core of projected size kpc, and a weak lobe extending north to a projected distance kpc.
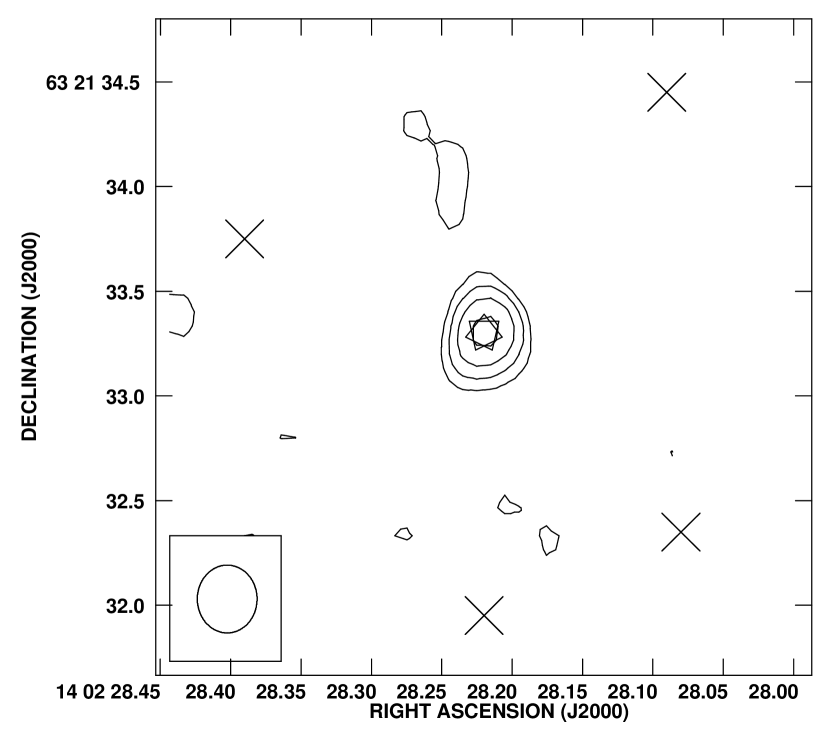
J1402+6321 is a gravitational lens at optical wavelengths, based on integral field spectroscopy and Hubble Space Telescope imaging (Bolton et al.,, 2005). Narrow-band images at the redshifted emission line wavelengths show four images of the background star-forming galaxy around the foreground galaxy (the image positions are shown by crosses in Figure 10). None of the lens images is near the radio point source. The extreme difference between the optical morphology and the radio morphology strengthens the case that the radio emission comes from the foreground galaxy.
4.9. J1550+5217
The VLA map shows a strong peak north of the SDSS position, with a faint extension through the center of the red galaxy, and a weak component south of the strong peak (Figure 11). Although the components have a separation similar to the 09 predicted for lensing (Table 1), the strong emission peak overlapping the foreground object is not characteristic of lensing. We conclude that the radio flux is not lensed emission from the background galaxy. The foreground galaxy appears to host a radio galaxy, with total projected size kpc.

Bolton & Burles, (2005) have made integral field observations of this system. It seems likely that there is no lensing in the optical regime either, although the integral field data are inconclusive.
4.10. J2251-0926
The VLA map shows an unresolved mJy source northwest of the center of the foreground galaxy (Figure 12). No other component is detected to a limit 0.1 mJy ( noise limit of the map). If the system were an asymmetric lens, then the next brightest image would be more than 11 times fainter than the brightest image. Faint images form closer to the foreground galaxy than the brightest image, and the images would be apart. Since the expected separation of lens images for this system is (Table 1), J2251-0926 is not an asymmetric lens.

The foreground galaxy appears to be the cD galaxy of a galaxy cluster, as six smaller galaxies are seen in SDSS within 15″. Lensing by a cluster with velocity dispersion up to 1000 km/s could produce two images separated by up to 12″, with the radio source near the central foreground galaxy being the fainter image. However no other radio source is detected within 20″in our 8.4 GHz VLA map (with a limiting flux 0.1 mJy) or the FIRST survey (with a limiting 1.4 GHz flux of 0.75 mJy); the cluster lens explanation is also rejected.
It is likely that the foreground galaxy is a radio galaxy, with a bright lobe kpc from its center in projection. Given the offset between the radio and optical positions, we may even be seeing a radio source at a third redshift.
5. Conclusions
Nine of the 117 candidate massive red galaxy lenses, or , have a 1.4 GHz flux mJy in the FIRST survey, and in each case we attribute the radio emission to the foreground galaxy. We consider the probability that this many galaxies would exceed our flux limit due to their intrinsic radio luminosity.
The SDSS Data Release 3 includes 36,551 luminous red galaxies (LRGs) with . We take these massive galaxies to be similar to our lens candidate sample (some of our candidates were in the LRG sample, others were massive galaxies in the main sample but not the LRG sample). 2,255 of the 36,551 LRGs, or , have mJy in FIRST. Most of these do not lens a background object, so the radio emission is generated by the LRG itself. We assume a binomial distribution with a probability for each lens candidate to have intrinsic mJy. There is a probability that at least nine of 117 candidates would exceed the flux limit due to their own radio emission. It is entirely probable that the detected radio flux could come from the foreground object in all of our candidates.
Conversely, it would be difficult to observe radio emission from the background star-forming galaxies. We assume that the background galaxies do not have active galactic nuclei (AGN), as these would likely have been apparent in the SDSS spectrum. Galaxies without an AGN have 1.5 GHz luminosity WHz-1 (Fig. 3 of Condon, (1992)). For a typical case, a galaxy with 1.5 GHz luminosity WHz-1, the 1.5 GHz flux would be 2 Jy before lensing and 10-20 Jy after a lensing magnification of a few. Current radio surveys such as FIRST have detection limits of Jy (Becker et al.,, 1995), so radio sources selected from these surveys are unlikely to be lensed images of star-forming galaxies. Future radio telescopes such as the Square Kilometer Array might detect radio lensed images of star-forming galaxies, although radio emission from the foreground galaxy is likely to be detected as well. The situation will be analogous to optical lensing, where the foreground lens and images of the background object are both seen, and must be disentangled.
Imaging and integral field spectroscopy of SDSS dual redshift systems often confirm strong lensing of the optical emission (Bolton et al.,, 2004, 2005; Bolton & Burles,, 2005). As an example, five of our ten targets have integral field data (J0037-0942, J0737+3216, J0956+5100, J1402+6321 and J1550+5217, see Section 4), and four of these objects are gravitational lenses at optical wavelengths. The dual optical redshifts automatically select detectable optical emission at different locations along the line of sight, making lensing probable. Continuum radio emission from the more distant object is probably too faint to be detected with current instruments, so lensed radio emission need not be detected.
Our sample of ten gravitational lens candidates revealed no radio lenses. In each case the radio emission was associated with the nearby red galaxy, rather than the more distant star-forming galaxy. Identification of dual redshift systems in SDSS red galaxy spectra is an excellent method for detecting strong galaxy-galaxy lensing of optical emission. However these SDSS dual redshift systems are unlikely to be detected in current radio surveys, and the few strong radio sources are located in foreground galaxies rather than lensed background galaxies.
References
- Becker et al., (1995) Becker, R. H., White, R. L., & Helfand, D. J. 1995, ApJ, 450, 559
- Bolton et al., (2004) Bolton, A. S., Burles, S., Schlegel, D. J., Eisenstein, D. J. & Brinkmann, J. 2004, AJ, 127, 1860
- Bolton et al., (2005) Bolton, A. S., Burles, S., Koopmans, L. V. E., Treu, T. & Moustakas, L. A. 2005, ApJ, 624, L21
- Bolton & Burles, (2005) Bolton, A. S. & Burles, S. 2005, in preparation
- Bowman et al., (2004) Bowman, J. D., Hewitt, J. N., & Kiger, J. R. 2004, ApJ, 617, 81
- Browne et al., (2003) Browne, I. W. A., et al. 2003, MNRAS, 341, 13
- Condon, (1992) Condon, J. J. 1992, ARA&A, 30, 575
- Eisenstein et al., (2001) Eisenstein, D. J., et al. 2001, AJ, 122, 2267
- Inada et al., (2003) Inada, N., et al. 2003, AJ, 126, 666
- Johnston et al., (2003) Johnston, D. E., et al. 2003, AJ, 126, 2281
- Kennicutt, (1998) Kennicutt, R. C. 1998, ARA&A, 36, 189
- Morgan et al., (2003) Morgan, N. D., Snyder, J. A., & Reens, L. H. 2003, AJ, 126, 2145
- Muñoz et al., (1999) Muñoz, J. A., Falco, E. E., Kochanek, C. S., Lehar, J., McLeod, B. A., Impey, C. D., Rix, H.-W. & Peng, C. Y. 1999, Ap&SS, 263, 51
- Oguri et al., (2005) Oguri, M., et al. 2005, ApJ, 622, 106
- Oguri et al., (2004) Oguri, M., et al. 2004, PASJ, 56, 399
- Perley & Taylor, (2003) Perley, R. A., & Taylor, G. B. 2003, VLA Calibration Manual (Socorro: NRAO), http://www.aoc.nrao.edu/gtaylor/calib.html
- Pier et al., (2003) Pier, J. R., Munn, J. A., Hindsley, R. B., Hennessy, G. S., Kent, S. M., Lupton, R. H., & Ivezić, Ž. 2003 AJ, 125, 1559
- Pindor et al., (2004) Pindor, B. et al., 2004, AJ, 127, 1318
- Richards et al., (2004) Richards, G. T., et al. 2004, AJ, 127, 1305
- Schlegel et al., (2005) Schlegel, D.J., et al. 2005, in preparation
- Strauss et al., (2002) Strauss, M. A., et al. 2002, AJ, 124, 1810
- Taylor et al., (2004) Taylor, G. B., Ulvestad, J. A., & Perley, R. A. 2004, The Very Large Array Observational Status Summary (Socorro: NRAO), http://www.vla.nrao.edu/astro/guides/vlas/current/
- York et al., (2000) York, D. G., et al. 2000, AJ, 120, 1579