On the evolution of the black hole:spheroid mass ratio
Abstract
We present the results of a study which uses the 3CRR sample of radio-loud active galactic nuclei to investigate the evolution of the black-hole:spheroid mass ratio in the most massive early-type galaxies from . Radio-loud unification is exploited to obtain virial (line-width) black-hole mass estimates from the 3CRR quasars, and stellar mass estimates from the 3CRR radio galaxies, thereby providing black-hole and stellar mass estimates for a single population of early-type galaxies. At low redshift () the 3CRR sample is consistent with a black-hole:spheroid mass ratio of , in good agreement with that observed locally for quiescent galaxies of similar stellar mass (). However, over the redshift interval the 3CRR black-hole:spheroid mass ratio is found to evolve as , reaching by redshift . This evolution is found to be inconsistent with the local black hole:spheroid mass ratio remaining constant at a moderately significant level (). If confirmed, the detection of evolution in the 3CRR black-hole:spheroid mass ratio further strengthens the evidence that, at least for massive early-type galaxies, the growth of the central supermassive black hole may be completed before that of the host spheroid.
keywords:
black hole physics - galaxies:active - galaxies:nuclei - quasars:general1 INTRODUCTION
It is now established at low redshift that black-hole mass and host spheroidal mass are tightly correlated in both quiescent (Magorrian et al. 1998; Gebhardt et al. 2000; Ferrarese & Merritt 2000) and active galaxies (McLure & Dunlop 2001,2002; Nelson et al. 2004). Consequently, it is widely accepted that the formation and evolution of supermassive black-holes and their host spheroids must be intimately related. However, at present we do not have a good understanding of the origins of the black-hole:spheroid connection, or its evolution with redshift. Fundamentally, it is not known whether black-holes formed before, after or co-evally with their host spheroids. From a theoretical perspective, most models (eg. Granato et al. 2004; Hopkins et al. 2005; Begelman et al. 2005) predict that the relation should remain close to the locally observed relation at all epochs. If true, then the same models predict that the observed ratio between black hole and spheroid mass should evolve with redshift as (e.g. Wyithe & Loeb 2003; Adelberger & Steidel 2005).
Within this context, several recent studies have attempted to explore the redshift evolution of the relationship between black-hole mass, spheroid mass and stellar-velocity dispersion from an observational perspective. Using the width of the [Oiii] emission line as a proxy for stellar-velocity dispersion, Shields et al. (2003) found no evidence that high-redshift quasars () deviated from the local relation (Tremaine et al. 2002), although the uncertainties were large. Similarly, Adelberger & Steidel (2005) examined the quasar-galaxy cross-correlation function of a sample of 79 quasars, and found them to be consistent with the local black-hole:halo mass correlation of Ferrarese (2002), although again the uncertainties were large. In contrast, based on stellar-velocity dispersion measurements for a small sample of Seyfert galaxies, True et al. (2004) concluded that at , black-hole masses are dex larger than observed locally, for a given stellar-velocity dispersion.
In terms of the relationship between black-hole and spheroid mass, Peng et al. (2005) recently concluded that the ratio was a factor of times larger at than the present day, based on a sample of 15 quasars. Furthermore, at the very highest redshifts, there are also indications of evolution in the relation. The highest redshift quasar currently identified () by the Sloan Digital Sky Survey (SDSSJ1148+5251; Fan et al. 2003) is believed to harbour a central black-hole of mass (Willott, McLure & Jarvis 2003; Barth et al. 2003). However, using CO observations, Walter et al. (2004) recently estimated a dynamical mass of only for SDSSJ1148+5251, clearly inconsistent with the locally observed ratio of (Marconi & Hunt 2003; Häring & Rix 2004).
The large uncertainties associated with the results discussed above illustrate that addressing the evolution of the black-hole:spheroid relation from an observational perspective is still a difficult proposition. The reasons for this are two-fold. Firstly, although in principal it is possible to obtain relatively accurate spheroid mass estimates for quiescent galaxies out to high redshifts, at present no viable technique is available to estimate their central black-hole mass. Secondly, although it is now possible to obtain black-hole mass estimates for broad-line active galactic nuclei (AGN) out to the highest redshifts using the so-called virial technique (Wandel, Peterson & Malkan 1999; Kaspi et al. 2000; McLure & Jarvis 2002; Vestergaard 2002), it remains extremely challenging to obtain accurate spheroid mass estimates for statistically significant samples of luminous high-redshift quasars.
In this paper we explore the possibility of exploiting the unification of radio-loud AGN to provide spheroidal and black-hole mass estimates for a single population of massive early-type galaxies in the redshift range . In the standard radio-loud unification scheme (e.g. Barthel 1989; Urry & Padovani 1995) radio-loud quasars and radio galaxies are drawn from the same parent population, with their classification as either quasars or radio galaxies dependent solely on whether our line-of-sight to the central engine intersects the obscuring torus, or not. Consequently, by using a complete sample of low-frequency selected radio-loud AGN we can adopt spheroidal mass estimates from the radio-galaxy component (where the central nucleus is obscured) and black-hole mass estimates from the quasar component (where we have a direct line of sight to the central nucleus) as representative of the whole population.
The structure of this paper is as follows. In section two we briefly describe the 3CRR sample. In sections three and four we describe how the stellar and black-hole masses were estimated. In section five we investigate the evolution of the relation within the 3CRR sample. In section six the implications for the 3CRR relation are outlined, while in section seven the possible systematic uncertainties influencing the stellar and black-hole mass estimates are reviewed. Our conclusions are discussed in section eight. Throughout the paper we adopt the following cosmology: km s-1Mpc-1, , .
2 The 3CRR Sample
The sample utilised in this study is the 3CRR sample (Laing, Riley & Longair 1983) which contains the most luminous, low-frequency selected, radio sources in the Northern Hemisphere. The 3CRR sample is complete to a 178MHz flux limit of 10.9Jy over an area of 4.2 steradians, and contains a total of 173 sources within the redshift range . Following Willott et al. (2003) we have excluded the nearby starburst M82 (3C231), and two flat-spectrum quasars which only feature in the 3CRR sample due to Doppler boosting (3C345 and 3C454.3), leaving a total of 170 sources in the full sample.
The 3CRR sample is ideally suited to the purposes of this study because it is both complete, and low-frequency selected. The low-frequency selection is particularly important because it ensures that the 3CRR sample does not suffer from any orientation bias. Indeed, the 3CRR quasar sample is known to be consistent with being randomly distributed with respect to our line of sight, with orientation angles restricted to (Willott et al. 2001). In contrast, the quasar components of high-frequency selected radio samples are known to be dominated by flat-spectrum sources which are preferentially aligned close () to the line of sight (Jackson & Wall 1999). Given the known correlation between orientation and the width of low-ionization broad emission lines in radio-loud AGN (e.g. Wills & Browne 1986; Brotherton et al. 1996; Jarvis & McLure 2005, in prep), it is therefore likely that virial black-hole mass estimates for flat-spectrum quasars are systematic underestimates (Jarvis & McLure 2002).
Finally, the extensive optical and near-infrared imaging of the 3CRR sample in the literature has demonstrated that the radio-galaxy hosts are consistent with being drawn from the most massive early-types in existence out to (e.g. McLure et al. 2004; Bettoni et al. 2003; Dunlop et al. 2003; Best, Longair & Röttgering 1998). Although radio-loud AGN of the luminosity of the 3CRR sample are extremely rare, it is worth remembering that the likely radio-source lifetime of years is only a small percentage of the Hubble time. Furthermore, given that every massive early-type galaxy must presumably pass through an active phase in order to build-up its central supermassive black hole, any information extracted on the evolution of the ratio from the 3CRR sample can presumably be applied to the evolutionary history of all massive early types.
3 Stellar masses
It has been known for more than twenty years that powerful radio galaxies display a tight correlation between redshift and apparent band magnitude; the so-called relation or near-infrared Hubble diagram (Lilly & Longair 1984). In its simplest interpretation the 3CRR relation is fully consistent with the passive evolution of an elliptical galaxy formed in a single burst of star-formation at (e.g. Jarvis et al. 2001; Willott et al. 2003). Alternatively, the relation is also consistent with the hierarchical merging paradigm, within which the relation is populated at each redshift by early-type galaxies at a specific stage of their evolutionary history (eg. Best, Longair & Röttgering 1998). In either case, the stellar populations of the 3CRR radio galaxies (band luminosities and colours) are consistent with a high redshift of formation.
Consequently, we have based our stellar mass estimates for the 3CRR radio galaxies largely on the band photometry compiled by Willott et al. (2003) for their study of the relation (corrected to a fixed 64 kpc metric aperture and for emission-line contamination). For the purposes of this study we have restricted ourselves to 3CRR radio galaxies with . The reasons for this decision are three-fold. Firstly, the lowest redshift in the quasar component is , so it is only at that a direct comparison between the radio galaxy and quasar components of the 3CRR sample can be made. Secondly, by restricting our analysis to , the 3CRR radio galaxies all have radio luminosities higher than the FRI/FRII break (Fanaroff & Riley 1974), ensuring that our radio-galaxy sample is comprised entirely of powerful FRII sources, the same radio morphology common to the entire 3CRR quasar sample. Thirdly, at the radio galaxies all have radio luminosities greater than WHz-1sr-1, the radio luminosity above which the 3CRR sample is fully consistent with simple orientation-based unification (Willott et al. 2001)
The full 3CRR sample contains 57 radio galaxies in the redshift interval . However, in this study we restrict our analysis to the complete sub-sample of 43 radio galaxies with and , making it possible to compile a complete set of band photometry. The photometry for the vast majority of the sample (39/43 objects) is drawn from the compilation of Willott et al. (2003). In addition we include -band photometry for 3C324, 3C356 (Best, Longair & Röttgering 1997), 3C225B (Lilly & Longair 1984) and 3C322 (Targett et al., in preparation).
In the redshift range the stellar masses of the 3CRR radio-galaxy hosts have been estimated by simply matching the 64 kpc metric aperture band magnitudes with a Bruzual & Charlot (2003) stellar population model which undergoes an instantaneous burst of star formation at a formation redshift of . At redshifts of , simply converting the observed band magnitudes directly into stellar mass estimates should be relatively robust, given that the underlying old stellar population should dominate rest wavelengths long-ward of m. Moreover, there is now a wide variety of evidence that at the properties of powerful radio-galaxy hosts (colours, scalelengths, Kormendy relation) are fully consistent with those of passively evolving early-type galaxies (McLure & Dunlop 2000; Best, Longair & Röttgering 1998; McLure et al. 2004).
However, at it could be argued that the band will be increasingly contaminated by any on-going star-formation. In order to quantify the level of on-going star-formation present in the 3CRR radio-galaxy hosts would require a level of multi-wavelength data which does not presently exist. However, the necessary multi-wavelength data does exist for the K20 sample (Cimatti et al. 2004). The K20 sample is comprised of galaxies in the Chandra Deep-field South region with , is spectroscopically complete, and has ubvrizjhk photometry available for each source. Based on this multi-wavelength data-set, Fontana et al. (2004) conducted a detailed study of the stellar masses of the K20 galaxies using detailed SED fitting. Furthermore, using the Fontana et al. results, Daddi et al. (2004) provide a fitting formula relating observed band magnitude to stellar mass for the K20 galaxies in the redshift range , the most luminous of which are directly comparable to the 3CRR radio-galaxy hosts. Consequently, for the 3CRR radio-galaxy hosts at we have adopted the stellar mass estimates provided by the Daddi et al. (2004) relation derived for the K20 sample.
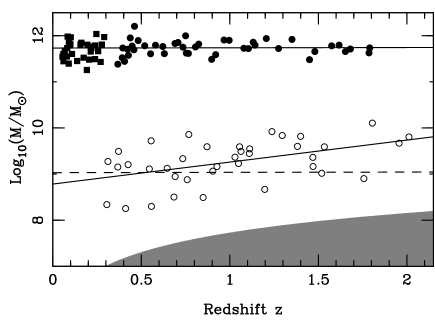
The stellar mass estimates for the 3CRR radio-galaxy hosts are plotted as filled circles in Fig 1. A simple least-squares fit to the relation produces the result:
| (1) |
showing no evidence for evolution out to , with the stellar masses remaining virtually constant at . This places our stellar mass estimates for the 3CRR sample in good agreement with those derived by Rocca-Volmerange et al. (2004) using the pegasé stellar population models. For completeness we have also plotted those 3CRR radio galaxies with band photometry available in Willott et al. (2003). Although they are not included in our analysis, the 3CRR radio galaxies are clearly consistent with the relation fitted to the higher redshift objects. Finally, it should be noted that we have also chosen to exclude the 20 objects in the 3CRR sample which are classified as weak quasars of broad-line radio galaxies by Willott et al. (2003). This is simply because the weak quasars are unsuitable for estimating host stellar masses (significant point-source contamination) or black-hole mass (significant host-galaxy contamination). Within the radio-loud unification scheme, weak quasars are viewed at an angle to the line-of-sight intermediate to that of quasars or radio galaxies, and their exclusion from our analysis should not therefore introduce any significant biases.
4 Black-hole masses
The black-hole mass estimates for the 3CRR quasars are based on the so-called virial black-hole mass estimator for broad-line AGN (eg. Wandel, Peterson & Malkan 1998; Kaspi et al. 2000). Under the assumption that the broad-line emitting gas is in virial motion within the central black-hole’s gravitational potential, the central black-hole mass can be estimated via: , where is the radius of the broad-line region (BLR) and is the orbital velocity of the line-emitting gas. In practise is estimated via the correlation between optical luminosity and discovered from reverberation mapping of low-redshift AGN (Kaspi et al. 2000), and the gas orbital velocity is taken to be the FWHM of either the , MgII or CIV emission lines.
Using a combination of literature data and new spectroscopic observations from the WHT telescope we have compiled line-width measurements and black-hole mass estimates for 38/40 of the broad-line quasars in the 3CRR sample. Full details of the data compiled on the 3CRR quasars, and the determination of the black-hole mass estimates are provided in the Appendix.
The black-hole mass estimates for the 3CRR quasars are plotted as open circles in Fig 1. The best fit to the relation (solid line) has the form:
| (2) |
which is inconsistent with no evolution at the level. The dashed line in Fig 1 shows the predicted evolution of the quasar black-hole masses under the assumption that the black-hole masses remain a factor of lower than the spheroid masses obtained from the radio-galaxy hosts (Eqn 1). We have adopted because this is the ratio predicted by the recent studies of the local ratio by Marconi & Hunt (2003) and Häring & Rix (2004) for a spheroidal mass of .The dashed line produces a fit with (36 degrees of freedom), compared to the best-fit with . For two free parameters this suggests that the redshift dependence of the 3CRR ratio is different from no evolution of the redshift zero normalisation at the 111All significances based on assume Gaussian errors. It should be noted that significances could be reduced depending on the true form of the error distributions. level.
Although the 3CRR sample is purely radio selected, and therefore does not have a defined optical flux limit, it is subject to an effective optical flux limit through the correlation between radio and optical luminosity (e.g. Serjeant et al. 1998). Consequently, it is of obvious concern that the apparent redshift evolution of the 3CRR quasar black-hole masses may simply be the result of Malmquist bias.
However, it is relatively straightforward to demonstrate that this is not the case. As a function of redshift we are interested in calculating the minimum virial black-hole mass that one of the 3CRR quasars could have, whilst still producing a radio source more luminous than the 3CRR flux limit. Therefore, at each redshift we first calculate the absolute radio luminosity of a source with an apparent flux density equal to the 10.9Jy 3CRR flux limit (Laing, Riley & Longair 1983). Secondly, using the optical luminosity - radio luminosity distribution of the 3CRR quasars (Fig 2) we then determine the minimum allowable optical luminosity. In Fig 2 the adopted limiting optical luminosity as a function of radio luminosity is shown as the solid line. Although this linear relation between optical and radio luminosity provides a good description of the lower envelope of the 3CRR quasar optical luminosities, it is nevertheless somewhat arbitrary. However, it can be seen from Fig 2 that moving the adopted limit to significantly higher optical luminosities is clearly ruled out. Furthermore, it should be noted that moving the adopted limit to lower optical luminosities would imply greater sensitivity to lower black-hole masses, making Malmquist bias less of a concern. Finally, to calculate the minimum virial black-hole mass we assume that the broad emission-line velocity width must be km s-1, if the source is to be regarded as a broad-line Type 1 quasar. As a function of redshift, the resulting minimum allowable black-hole mass, effectively the black-hole mass completeness limit, is the upper envelope of the shaded grey region shown in Fig 1.
The results of this calculation immediately demonstrate that the radio flux limit of the 3CRR sample does not automatically force the 3CRR quasar black-hole masses to increase with redshift. On the contrary, it remains perfectly possible for the 3CRR quasars to harbour black-hole masses as small as right out to redshift . Therefore, it seems clear that the redshift evolution of the 3CRR quasar black-hole masses is genuine, and not the result of biases inherent to the 3CRR radio selection.

5 The Evolution of the black-hole:spheroid mass ratio
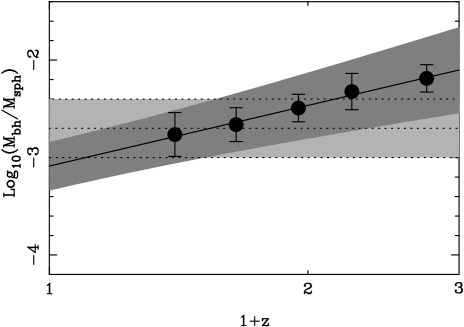
In Fig 3 we show the evolution of the ratio within the 3CRR sample, where each data-point is simply within each redshift bin. The solid line shows the best-fitting relation, which has the form:
| (3) |
with the dark grey shaded region indicating the uncertainty on this fit. It can be seen from Eqn 3 that the slope of the best-fitting relation is formally inconsistent with a non-evolving ratio at the level (). However, it is important to note that the expected ratio for local quiescent galaxies of the same stellar mass as the 3CRR hosts is still relatively uncertain. In Fig 3 the light grey shaded area shows the dex uncertainty on the redshift zero ratio of predicted by the recent studies of Marconi & Hunt (2003) and Häring & Rix (2004). It can be seen from Fig 3 that, although the ratio of the 3CRR sample is evolving over the redshift interval , the normalisation remains within the current redshift zero uncertainties until . Consequently, in evaluating the significance of the apparent evolution, it is perhaps better to look for the best non-evolving fit to the data with a normalisation within the redshift zero uncertainties (light grey shaded area). Under this constraint, the best fit to the data has , just within the redshift zero uncertainties. However, the difference in chi-square between this non-evolving fit and the best fit is , which for two free parameters is significant at the level.
Consequently, we conclude that the data presented in Fig 3 provide strong evidence that the ratio within the 3CRR sample evolves with redshift, changing from at redshift zero to by redshift two. However, given the relatively large uncertainties on the local normalisation of the ratio, it is also clear that the veracity of the apparent evolution in the ratio of massive early-type galaxies suggested by the 3CRR sample will only be thoroughly tested by moving to higher redshifts still.
6 The near-infrared Hubble diagram
As discussed previously, the tight relation displayed by the 3CRR sample can either be interpreted in terms of passive evolution or, alternatively, as fitting naturally within the hierarchical merging paradigm of galaxy evolution (Best, Longair & Röttgering 1998; McLure & Dunlop 2000). In the first interpretation the 3CRR host galaxies have completed their formation at high redshift (), and at all redshifts are expected to be indistinguishable from each other, apart from the passive evolution of their stellar populations. In the second interpretation the 3CRR host galaxies have different evolutionary histories, but are seen as powerful radio galaxies and quasars at a point where their host stellar masses are a few times . In this scenario the 3CRR sources at continue to build up stellar mass and are identified with dormant brightest cluster galaxies at redshift zero.
Fundamentally both interpretations rely on the host galaxies of the 3CRR sources having the same mass (), making them difficult to distinguish via the host-galaxy properties. At the results presented in Fig 3 show that the ratio of the 3CRR sample is not significantly different from the locally observed value, and consequently the passive evolution interpretation of the relation remains valid for these objects. Indeed, HST imaging studies have found no evidence that the luminosities, morphologies or scalelengths of powerful radio galaxies are evolving out to (e.g. McLure & Dunlop 2000; McLure et al. 2004).
However, although certainly not conclusive, the results presented in Fig 3 suggest that the 3CRR host galaxies at are required to grow in mass by a factor of to be fully consistent with the locally observed ratio. This level of growth would place 3CRR host-galaxies among the progenitors of local brightest cluster galaxies (), consistent with the Best, Longair & Röttgering (1998) interpretation of the relation. Indeed, this scenario is further supported by evidence showing that the cluster environments of high-redshift powerful radio galaxies are richer than those of their low-redshift counterparts (Hill & Lilly 1991; Best 2000).
7 Systematic uncertainties
Before proceeding to discuss the implications of the suggested evolution in the ratio for massive early-type galaxies, it is worthwhile considering the likely sources of systematic uncertainty.
7.1 Black-hole masses
The reliability of the virial black-hole mass estimator for broad-line AGN has been discussed extensively in the literature (e.g. Krolik 2001; Vestergaard 2002). Perhaps the most salient point arising from these studies is that comparisons with the and relations at low-redshift indicate that the virial mass estimator does not suffer from any systematic biases (e.g. Onken et al. 2004; Nelson et al. 2004; McLure & Dunlop 2002). However, it is worth remembering that while the virial mass estimator appears to be unbiased, it does carry a typical uncertainty of dex, and is therefore not particularly accurate (Vestergaard 2002; McLure & Jarvis 2002).
It is therefore of potential concern that more than half of the 3CRR black-hole mass estimates shown in Fig 1 are based on line-width measurements drawn from the literature (see Appendix). It is possible that this could have an unforeseen effect on the derived black-hole mass estimates. However, it appears unlikely that this is the source of the observed evolution in the 3CRR quasar black-hole masses. Firstly, there is no correlation within the 3CRR quasar sample between broad-line velocity width and redshift. Additionally, the scatter apparent in the black-hole mass estimates plotted in Fig 1 is entirely consistent with that expected, given the known scatter associated with the virial black-hole mass estimator (the best-fitting relation shown in Fig 1 has a reduced chi-square of for 36 degrees of freedom, assuming a constant dex).
7.2 Stellar masses
The stellar mass estimates derived for the 3CRR radio galaxies are in good agreement with the determinations of Rocca-Volmerange et al. (2004) and Best, Longair & Röttgering (1998). However, it should be noted that fundamentally they are based solely on band photometry. As previously discussed, at this should not significantly bias the stellar mass estimates because the band continues to sample rest-frame wavelengths m, which should be dominated by the underlying old stellar population. At we have chosen to base our estimates on the correlation between band magnitude and stellar mass derived via multi-wavelength SED fitting of quiescent field galaxies by Daddi et al. (2004). If the radio-galaxy hosts have significantly less on-going starformation than typical field galaxies at these redshifts, then these stellar masses could be underestimates. Indeed, if it is assumed that the radio galaxies in the redshift interval are still passively evolving, the stellar mass estimates adopted here are underestimated by (e.g. Inskip et al. 2002). It is important to note that, in this case, the best-fitting evolution of ratio becomes , and is no longer statistically significant.
In contrast, if the radio-galaxy hosts have significantly more on-going starformation than typical field galaxies at these redshifts, then the stellar masses could be overestimates. Indeed, this is more likely to be the case given the strong evidence in the literature that AGN activity and starformation are intimately related at high redshift (e.g. Archibald et al. 2000; Zirm et al. 2005). However, this possibility is not of great concern to the present study because, if this is the case, then the apparent evolution in the can only become stronger. Finally, we note that Spitzer IRAC photometry sampling the rest-frame band would be ideal for accurately determining the stellar masses of the 3CRR sample. In this context the results of the current Spitzer programme (PI D. Stern) to study the stellar masses of 70 radio galaxies in the redshift interval , including several 3CRR objects, will be of great interest.
7.3 Unification
Under a simple orientation-based unification scheme, the ionizing AGN continuum luminosities of the 3CRR quasars and radio galaxies should be indistinguishable. Traditionally, the [OIII] emission line luminosity (Å) has been taken as good tracer of the underlying ionizing continuum in radio-loud AGN and, if emitted isotropically, should be indistinguishable between quasars and radio galaxies. However, studies to directly test the similarity of the [OIII] emission of radio galaxies and quasars have failed to reach a consensus, with many finding that the [OIII] emission in quasars is more luminous than in their radio-galaxy counterparts. The question of whether this indicates that the [OIII] emission is either non-isotropic (or partially absorbed in radio galaxies), or that the opening angle of the obscuring torus is luminosity dependent, the so-called receding torus model (eg. Simpson 1998), is still hotly debated and unresolved (e.g. Grimes et al. 2004; Haas et al. 2005).
Consequently, in this study we have chosen not to make an explicit receding torus correction to the black-hole mass estimates of the 3CRR quasars. However, it should be noted that on average the [OIII] luminosities of the 3CRR radio galaxies are a factor of lower than their quasar counterparts, in good agreement with the predictions of the receding torus model (e.g. Simpson 2003). Correcting the quasar optical luminosities for this difference would have the effect of lowering their black-hole mass estimates by dex (see Appendix). Therefore, although this would have no effect on the significance of the observed evolution in the ratio seen in Fig 3, the five data-points would each be dex lower.
However, it should also be noted that a systematic increase of only 0.1 dex to the 3CRR radio galaxy [OIII] luminosities is sufficient to make the [OIII]- distribution of the quasars and radio galaxies indistinguishable at the level (2DKS test, Peacock 1983). A correction to the 3CRR quasar optical luminosities of this amount would only change the black-hole mass estimates by dex, with a negligible effect on the observed evolution. Furthermore, recent observations of the 3CRR sample (Haas et al 2005) suggest that the [OIII] emission in quasars is not isotropic, and that the 3CRR sample is fully consistent with orientation-based unification.
8 Discussion
The results presented in the last section suggest that the ratio within the 3CRR sample is evolving with redshift, increasing by a factor of compared to the local value by a redshift of . However, given that the 3CRR sample is comprised of the most luminous radio-loud AGN in the Universe, is it reasonable to assume that this result is in anyway representative of the dominant, quiescent early-type galaxy population? Two lines of reasoning would argue that it probably is. Firstly, recent studies of both the radio-galaxy diagram (e.g. Rocca-Volmerange et al. 2004) and the host galaxies of powerful radio galaxies (McLure et al. 2004; Bettoni et al. 2003; Dunlop et al. 2003; McLure & Dunlop 2000) have demonstrated that 3C-class radio-loud AGN are representative of the high-mass end of the early-type galaxy population in terms of mass, colour, half-light radius and fundamental plane location. Secondly, as previously mentioned, estimates of the duty cycle of radio-loud AGN are typically in the range yrs, which accounts for a negligible fraction of the evolutionary history of the host galaxies ( yrs). Therefore, there seems little evidence to suggest that the 3CRR sample is anything other than a random sample of the very high-mass end of the early-type mass function over the redshift interval .
Consequently, it is interesting to compare how the results presented here compare with those in the existing literature. As discussed in the introduction, from a theoretical perspective the ratio between black-hole and spheroid mass is expected to evolve as , in excellent agreement with the results of this study. Furthermore, the evolution of the black-hole:spheroid relation suggested by the 3CRR sample is also in good agreement with the observational results of Shields et al. (2003) and Peng et al. (2005). However, it is worth noting that there are further indications from the recent literature which suggest that the ratio may undergo evolution with redshift. Firstly, from their study of quasar black-hole masses using the SDSS first data release, McLure & Dunlop (2004) concluded that virtually all black holes in the local Universe with masses were already in place by . In contrast, recent studies of deep infra-red galaxy surveys suggest that at the mass density comprised of the likely hosts of these black holes () is only % of its local value (e.g. Caputi et al. 2005; Fontana et al. 2004; Rudnick et al. 2003). Qualitatively this would suggest an evolution in the mean ratio of a factor of .
Furthermore, studies of quasar host galaxies at also suggest that the ratio may be evolving. The majority of recent studies (e.g. Kukula et al. 2001; Ridgway et al. 2001) suggest that for a given quasar luminosity, the typical host-galaxy luminosity has dropped by a factor of by redshift two. Given that these quasars have similar nuclear luminosities to those studies at low redshift, and no evidence has yet been found for a significant correlation between redshift and quasar broad emission-line widths (e.g. McLure & Dunlop 2004; Corbett et al. 2004), it is reasonable to assume that these quasars will have similar black-hole masses to their low-redshift counterparts. Consequently, if the host-galaxy luminosities are a reasonable indicator of mass, it is tempting to conclude that the detected drop in host-galaxy luminosity implies an increase in the average ratio of . However, it should also be noted that this conclusion is highly dependent on the unknown star formation history of the quasar host galaxies, and is as yet based on a very small number of objects.
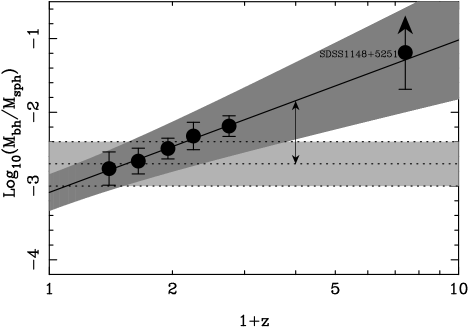
Finally, it is worth returning to the issue of the ratio implied for the highest redshift SDSS quasar; SDSS1148+5251 (). Both Willott, McLure & Jarvis (2003) and Barth et al. (2003) estimate the central black-hole mass to be , a value which is consistent with assuming Eddington limited accretion. In contrast, the dynamical mass estimate of Walter et al. (2004) is only , implying a ratio of , a factor of higher than observed locally. This is illustrated in Fig 4, which shows the implied ratio of SDSS1148+5251 compared to the evolving 3CRR relation extrapolated to redshift nine. Although the good agreement between the two is no doubt fortuitous, nevertheless, it is clear that the ratio of SDSS1148+5251 does not appear to be consistent with the expected local value. Fig 4 also demonstrates that the evolution of the ratio suggested by the 3CRR sample, if correct, will result in the ratio being a factor of higher than the local value. Such a significant difference should be detectable directly from the luminosities of the host galaxies of quasars with virial black-hole mass estimates. The question of whether the host galaxies of quasars suggest any evolution in the ratio will be addressed in a forthcoming paper (Targett et al., in prep).
9 acknowledgments
The authors would like to acknowledge the anonymous referee for insights which significantly improved the final version of this paper. The authors would also like to acknowledge Chris Willott for making the band photometry for the 3CRR radio galaxies available on-line, and Chris Simpson for useful discussions. RJM and PNB would like to acknowledge the funding of the Royal Society. MJJ acknowledges the funding from a PPARC PDRA. TAT acknowledges the award of a PPARC studentship. The WHT telescope is operated on the island of La Palma by the Isaac Newton Group in the Spanish Observatorio del Roque de los Muchachos of the Instituto de Astrofisica de Canarias
References
- [1] Adelberger K.L., Steidel C.C., 2005, ApJ, 627, L1
- [2] Aldcroft T.L., Bechtold J., Elvis M., 1994, ApJS, 93, 1
- [3] Archibald E.N., Dunlop J.S., Hughes D.H., Rawlings S., Eales S.A., Ivison R.J., 2001, MNRAS, 323, 417
- [4] Barth A., Martini P., Nelson C.H., Ho L.C., 2003, ApJ, 549, L95
- [5] Barthel P.D., Pearson T.J., Readhead A.C.S., 1988, ApJ, 329, L51
- [6] Barthel P.D., 1989, ApJ, 336, 606
- [7] Barthel P.D., Tytler D.R., Thomson B., 1990, A&AS, 82, 339
- [8] Begelman M.C., Nath B.B., 2005, MNRAS, 361, 1387
- [9] Best P.N., Longair M.S., Röttgering H.J.A., 1997, MNRAS, 292, 758
- [10] Best P.N., Longair M.S., Röttgering H.J.A., 1998, MNRAS, 295, 549
- [11] Best P.N., 2000, MNRAS, 317, 720
- [12] Bettoni D., Falomo G., Fasano G., Govoni F., Salvo M., Scarpa R., 2001, A&A, 380, 471
- [13] Brotherton M.S., 1996, ApJS, 102, 1
- [14] Brotherton M.S., Tran H.D., Becker R.H., Gregg M.D., Laurent-Muehleisen S.A., White R.L., 2001, ApJ, 546, 775
- [15] Bruzual G., Charlot S., 2003, MNRAS, 344, 1000
- [16] Caputi K.I, Dunlop J.S., McLure R.J., Roche N.D., 2005, MNRAS, 361, 607
- [17] Corbett E.A., Croom S.M., Boyle B.J., Netzer H., Miller L., Outram P.J., Shanks T., Smith R.J., Rhook K., 2003, MNRAS, 343, 705
- [18] Daddi E., Cimatti A., Renzini A., Fontana A., Mignoli M., Pozzetti L., Tozzi P., Zamorani G., 2004, ApJ, 617, 746
- [19] Dunlop J.S., McLure R.J., Kukula M.J., Baum S.A., O’Dea C.P., Hughes D.H., 2003, MNRAS, 340, 1095
- [20] Fan X., et al., 2003, ApJ, 125, 1649
- [21] Fanaroff B.L., Riley J.M., 1974, MNRAS, 167, 31
- [22] Ferrarese L., Merritt D., 2000, ApJ, 539, L9
- [23] Fontana A., et al., 2004, A&A, 424, 23
- [24] Gebhardt K., et al., 2000, ApJ, 539, L13
- [25] Granato G.L., De Zotti G., Silva L., Bressan A., Danese L., 2004, ApJ, 600, 580
- [26] Grimes J.A., Rawlings S., Willott C.J., 2004, MNRAS, 349, 503
- [27] Haas M., Siebenmorgen R., Schulz B., Kruegel E., Chini R., 2005, A&A, in press, astro-ph/0509340
- [28] Häring N., Rix H.W., 2004, ApJ, 604, L89
- [29] Hill G.J., Lilly S.J., 1991, ApJ, 367, 1
- [30] Hopkins P.F., Hernquist L., Cox T.J., Di Matteo T., Robertson B., Springel V., 2005, Apj submitted, astro-ph/0506398
- [31] Inskip K.J., Best P.N., Longair M.S., MacKay D.J.C., 2002, MNRAS, 329, 277
- [32] Jackson C.A., Wall J.V., 1999, MNRAS, 304, 160
- [33] Jackson N., Browne I.W.A., 1991, MNRAS, 250, 414
- [34] Jarvis M.J., Rawlings S., Eales S.A., Blundell K.M., Bunker A.J., Croft S., McLure R.J., Willott C.J., 2001, MNRAS, 326, 1585.
- [35] Jarvis M.J., McLure R.J., 2002, MNRAS, 336, L38
- [36] Kaspi S., Smith P.S., Netzer H., Maoz D., Jannuzi B.T., Giveon U., 2000, ApJ, 533, 631
- [37] Korista K.T., et al., 1995, ApJS, 97, 285
- [38] Krolik J.H., 2001, ApJ, 551, 72
- [39] Kukula M.J, Dunlop J.S., McLure R.J., Miller L., Percival W.J., Baum S.A., O’Dea C.P., 2001, MNRAS, 326, 1533
- [40] Laing R.A., Riley J.M., Longair M.S., 1983, MNRAS, 204, 151
- [41] Lawrence C.R., Zucker J.R., Readhead A.C.S., Unwin S.C., Pearson T.J., Xu W., 1996, ApJS, 107, 541
- [42] Lilly S.J., Longair M.S., 1984, MNRAS, 211, 833
- [43] Magorrian J., et al., 1998, AJ, 115, 2285
- [44] Marconi A., Hunt L.K., 2003, ApJ, 589, L21
- [45] McLure R.J., Dunlop J.S., 2000, MNRAS, 317, 249
- [46] McLure R.J., Dunlop J.S., 2001, MNRAS, 327, 199
- [47] McLure R.J., Dunlop J.S., 2002, MNRAS, 331, 795
- [48] McLure R.J., Jarvis M.J., 2002, MNRAS, 337, 109
- [49] McLure R.J., Willott C.J., Jarvis M.J., Rawlings S., Hill G.J., Mitchell E.K., Dunlop J.S., Wold M., 2004, MNRAS, 351, 347
- [50] McLure R.J., Dunlop J.S., 2004, MNRAS, 352, 1390
- [51] Nelson C.H, Green R.F., Bower G., Gebhardt K., Weistrop D., 2004, ApJ, 615, 652
- [52] Onken C.A., Ferrarese L., Merritt D., Peterson B.M., Pogge R.W., Vestergaard M., Wandel A., 2004, ApJ, 615, 645
- [53] Peacock J.A., 1983, MNRAS, 202, 615
- [54] Peng C.Y., Impey C.D., Ho L.C., Barton E.J., Rix H.W., 2005, ApJ, submitted, astro-ph/0509155
- [55] Ridgway S.E., Heckman T.M., Calzetti D., Lehnert M., 2001, ApJ, 550, 122
- [56] Rocca-Volmerange B., Le Borgne D., De Breuck C., Fioc M., Moy E., 2004, A&A, 415, 931
- [57] Rudnick G., et al., 2003, ApJ, 599, 847
- [58] Serjeant S., Rawlings S., Lacy M., Maddox S.J., Baker J.C., Clements D., Lilje P.B., 1998, MNRAS, 294, 494
- [59] Shields G.A., et al., 2003, ApJ, 583, 124
- [60] Simpson C., 1998, MNRAS, 297, L39
- [61] Simpson C., 2003, NewAR, 47, 211
- [62] Treu T., Malkan M.A., Blandford R.D., 2004, ApJ, 615, L97
- [63] Urry C.M., Padovani P., 1995, PASP, 107, 803
- [64] Vestergaard M., 2002, ApJ, 571, 733
- [65] Walter F., et al., 2004, ApJ, 615, L17
- [66] Wandel A., Peterson B.M., Malkan M.A., 1999, ApJ, 526, 579
- [67] Willott C.J., Rawlings S., Blundell K.M., Lacy M., 1999, MNRAS, 309, 1017
- [68] Willott C.J., Rawlings S., Blundell K.M., Lacy M., Eales S.A., 2001, MNRAS, 322, 536
- [69] Willott C.J., Rawlings S., Jarvis M.J., Blundell K.M., 2003, MNRAS, 339, 173
- [70] Willott C.J., McLure R.J., Jarvis M.J., 2003, ApJ, 587, L15
- [71] Wills B.J., Browne I.W.A., 1986, ApJ, 302, 56
- [72] Wyithe J.S., Loeb A., 2003, ApJ, 595, 614
- [73] Zirm A.W., et al., 2005, ApJ, 631, L33
Appendix A Emission line data
The adopted broad emission line-widths for 38/40222No suitable emission-line data could be found for 3C318. We have chosen to exclude 3C216, often classified as a quasar, because it is known to display blazar-like properties (Barthel, Pearson & Readhead 1988), and shows no indication of broad MgII or H in its SDSS spectrum. of the 3CRR quasars are listed in Table A1. The emission-line widths for fourteen of the quasars are derived from new spectroscopic data obtained at the William Herschel Telescope, using the ISIS spectrograph, during two observing runs in December 2002 and December 2004. Optical spectroscopy for two further quasars (3C9 and 3C186) were obtained from the Sloan Digital Sky Survey (SDSS) archive. The line-widths for these sixteen quasars were extracted in an automated fashion using the line-fitting software originally developed for the analysis of SDSS quasar spectra (see McLure & Dunlop 2004 for a full discussion). The broad emission-line widths for the remaining 22 quasars were obtained from various literature sources, with the appropriate references listed in Table A1. In several cases where it proved possible to extract the original spectra from the literature, the emission-line widths listed in Table A1 were derived using the same line-fitting software employed on the new ISIS data.
A.1 Black-hole mass estimates
The black-hole mass estimates for the 3CRR quasars were calculated using the virial mass estimator derived for the MgII emission line by McLure & Dunlop (2004):
| (4) |
where is the monochromatic continuum luminosity at 3000Å. For the 23 quasars with available MgII line-widths Eqn A1 was applied directly. For the 13 quasars with available H line-widths, Eqn A1 was also applied directly, under the explicit assumption that the line-widths of MgII and H are, on average, equal. The reliability of this assumption was the original motivation for re-calibrating the virial black-hole mass estimator for the MgII emission line (McLure & Jarvis 2002), and was demonstrated using SDSS quasars with optical spectra covering both MgII and H (McLure & Dunlop 2004). For the two objects with only CIV line-widths Eqn A1 was again applied, although the CIV line-widths were reduced by a factor of to account for the factor of two difference in the emission radius of CIV and H (e.g. Korista et al. 1995); i.e. . It should be noted that this procedure produces virtually identical results to the virial mass estimator calibration based on CIV derived by Vestergaard (2002).
In addition to an emission line-width, the virial mass estimator relies on a continuum luminosity measurement. In the majority of cases (30/38) one or more flux-calibrated spectra were available, from which the necessary continuum luminosity could be directly measured. For the remaining quasars it was necessary to calculate the continuum luminosity from the available band photometry. This was done by integrating the composite radio-loud quasar spectrum derived from the First Bright Quasar Survey (Brotherton et al. 2001) over the band filter curve, normalising the composite spectrum to match the available photometry. This normalised composite was then be used to predict the continuum luminosity at 3000Å.
The fact that the data for the 3CRR quasar sample, both line-widths and continuum luminosities, originates from a combination of new and literature observations could potentially be a source of increased scatter in the resulting black-hole mass estimates. Ideally, it would be preferable to have a complete set of well flux-calibrated spectra of the 3CRR quasar sample taken with the same instrumentation. However, despite this, there is no evidence that the black-hole mass estimates for the 3CRR quasars derived here are any less accurate than is expected, given the known scatter associated with the virial mass estimator. Even with superior data quality, previous studies have determined that the accuracy of the virial mass estimator is limited to dex (Vestergaard 2002; McLure & Jarvis 2002). As discussed in Section 7, the scatter associated with the relation displayed by the 3CRR quasars (Fig 1) is entirely consistent with this level of scatter.
| Source | z | V | FWHM | Line | Reference | |
|---|---|---|---|---|---|---|
| 3C9 | 2.012 | 18.2 | 7.04 | MgII | 9.8 | SDSS |
| 3C14 | 1.469 | 20.0 | 9.68 | MgII | 9.4 | ISIS |
| 3C43 | 1.470 | 20.0 | 6.01 | MgII | 9.2 | ISIS |
| 3C47 | 0.425 | 18.1 | 9.88 | MgII | 9.2 | ISIS |
| 3C48 | 0.367 | 16.2 | 7.32 | H | 9.2 | ISIS |
| 3C68.1 | 1.238 | 19.5 | 16.88 | MgII | 9.9 | ISIS |
| 3C109 | 0.305 | 17.9 | 5.10 | H | 8.3 | ISIS |
| 3C138 | 0.759 | 17.9 | 5.14 | H | 8.9 | ISIS |
| 3C147 | 0.545 | 16.9 | 8.93 | H | 9.1 | 6 |
| 3C175 | 0.768 | 16.6 | 10.90 | MgII | 9.9 | ISIS |
| 3C181 | 1.382 | 18.9 | 9.82 | MgII | 9.6 | ISIS |
| 3C186 | 1.063 | 17.6 | 8.45 | MgII | 9.5 | SDSS |
| 3C190 | 1.197 | 20.0 | 6.33 | MgII | 8.7 | 1 |
| 3C191 | 1.956 | 18.7 | 11.30 | CIV | 9.7 | ISIS |
| 3C196 | 0.871 | 17.6 | 9.81 | MgII | 9.6 | 6 |
| 3C204 | 1.112 | 18.2 | 9.23 | MgII | 9.5 | ISIS |
| 3C205 | 1.534 | 17.6 | 6.40 | MgII | 9.6 | ISIS |
| 3C207 | 0.684 | 18.2 | 3.63 | MgII | 8.5 | ISIS |
| 3C208 | 1.110 | 17.4 | 8.70 | MgII | 9.4 | ISIS |
| 3C212 | 1.049 | 19.1 | 8.58 | MgII | 9.2 | 1 |
| 3C215 | 0.411 | 18.3 | 4.44 | H | 8.3 | 4 |
| 3C245 | 1.029 | 17.3 | MgII | 9.4 | 1 | |
| 3C249.1 | 0.311 | 15.7 | 7.83 | H | 9.3 | 7 |
| 3C254 | 0.734 | 18.0 | 9.13 | H | 9.3 | 5 |
| 3C263 | 0.646 | 16.3 | 4.76 | H | 9.1 | 7 |
| 3C268.4 | 1.400 | 18.4 | 10.66 | MgII | 9.8 | 1 |
| 3C270.1 | 1.519 | 18.6 | 4.50 | MgII | 9.0 | 1 |
| 3C275.1 | 0.557 | 19.0 | 4.40 | MgII | 8.3 | 1 |
| 3C286 | 0.849 | 18.0 | 2.25 | MgII | 8.5 | 2 |
| 3C287 | 1.055 | 17.7 | 8.73 | MgII | 9.6 | 2 |
| 3C309.1 | 0.904 | 16.8 | 4.23 | H | 9.1 | 6 |
| 3C334 | 0.555 | 16.4 | 10.65 | H | 9.7 | 7 |
| 3C336 | 0.927 | 17.5 | 7.10 | H | 9.2 | 4 |
| 3C351 | 0.371 | 15.3 | 8.76 | H | 9.5 | 7 |
| 4C16.49 | 1.296 | 18.5 | 13.98 | MgII | 9.8 | 1 |
| 3C380 | 0.691 | 16.8 | 4.28 | H | 8.9 | 7 |
| 3C432 | 1.805 | 18.0 | 11.37 | MgII | 10.1 | 1 |
| 3C454 | 1.757 | 18.5 | 4.78 | CIV | 8.9 | 3 |