XMM-Newton observations of Red AGN
Abstract
XMM-Newton spectra of five red, 2MASS AGN, selected from a sample observed by Chandra to be relatively X-ray bright and to cover a range of hardness ratios, confirm the presence of substantial absorbing material in three sources with optical classifications ranging from Type 1 to Type 2. A flat (hard), power law continuum is observed in the other two. The combination of X-ray absorption and broad optical emission lines suggests either a small (nuclear) absorber or a favored viewing angle so as to cover the X-ray source but not the broad emission line region (BELR). A soft excess is detected in all three Type 1 sources. We speculate that this may arise in an extended region of ionised gas, perhaps linked with the polarised (scattered) optical light present in these sources. The spectral complexity revealed by XMM-Newton emphasizes the limitations of the low S/N Chandra data. The new results strengthen our earlier conclusions that the observed X-ray continua of red AGN are unusually hard at energies 2 keV. Their observed spectra are consistent with contributing significantly to the missing hard/absorbed population of the Cosmic X-ray Background (CXRB) although their intrinsic power law slopes are typical of broad-line (Type 1) AGN (-). This suggests that the missing X-ray-absorbed CXRB population may include Type 1 AGN/QSOs in addition to the Type 2 AGN generally assumed.
1 Introduction
The Two Micron All-Sky Survey (2MASS) has revealed a large number of highly reddened active galaxies (AGN) not previously found in optical/UV color-selected surveys (Cutri et al. 2002, Francis et al. 2004). Their typically high optical polarization (Smith et al. 2002, 2003) suggests substantial obscuration around the nuclear energy source. Chandra observations show weak, hard X-ray emission compared with normal, broad-line, low-redshift AGN, suggesting that these, mostly broad-lined, AGN are absorbed. Evidence for a significant population of X-ray absorbed, broad-lined AGN is growing, both in individual sources and samples (Silverman et al. 2005, Perola et al. 2004). Broad Absorption Line (BAL) QSOs are another well-defined subset with this property (Green et al. 2001). Notably BALQSOs also have high optical polarisation levels. As X-ray absorbed AGN, these sources may contribute to the X-ray-absorbed population predicted by modelling of the Cosmic X-ray Background (CXRB, Gilli et al. 2001, Comastri et al. 1995).
The realization that obscuration plays a critical role in the classification of AGN inspired a fundamental change in our understanding of the phenomenon. Not only does the “Unified Scheme” (Antonucci 1993) provide a basis for new observations and theoretical models, but it also implies that many AGN may be missed in UV-excess surveys (e.g., Masci et al. 1999). Ideas of what comprises an AGN continue to expand as X-ray and radio surveys find luminous, unresolved sources that show no signs of activity at other wavelengths (e.g. Elvis et al. 1981, Bauer et al. 2004), implying that the overall number density has been significantly underestimated. Ramifications include revisions of the fraction and types of galaxies that harbor an active nucleus, the energy density of ionizing radiation in the young Universe, the nature of the X-ray and far-IR backgrounds, and the importance of accretion power in the Universe as a whole.
Although IRAS provided the first significant sample of extragalactic objects in which the bulk of the luminosity emerges as reprocessed radiation in the IR (Soifer et al. 1984), its sensitivity was sufficient to catalog only the most nearby and/or luminous AGN. The Two Micron All Sky Survey (2MASS) has yielded a much deeper catalog of near IR-selected AGN (Cutri et al. 2002) by selecting sources with from the high galactic latitude 2MASS Point Source Catalogue. Spectroscopic follow-up of red candidates reveals that 75 percent are previously unidentified emission-line AGN, with 80 percent of these showing broad optical emission lines (Type 1: Seyfert 1 and QSO), and the remainder being narrow-line objects (Type 2: Seyfert 2, QSO 2, and LINER; Cutri et al. 2002). They span a redshift range with median z0.25. The inferred surface density is 0.5 deg-2 brighter than , higher than that of optically selected AGN at the same IR magnitudes and indicating that 2MASS will reveal such objects over the sky. The objects also have unusually high optical polarization levels, with 10 percent showing percent indicating a significant contribution from scattered light (Smith et al. 2002, 2003).
In a near-infrared flux-limited survey for AGN, largely unbiased by color-selection, Francis et al. (2004) found that the fraction of all galaxies harboring AGN increases with increasing JKS color. They could not place stringent limits on the total fraction of dust-reddened AGN at low redshift, though, because the optical colors are dominated by host-galaxy light and because of poor statistics for the reddest and optically-faintest sources. Obscuration by dust may very well account for the lower contrast of the nuclear emission at optical wavelengths, while leaving the near-infrared nuclear colors largely unaffected. A better estimate of the fraction of extinguished AGN comes from Glikman et al. (2004) who examined a sample of FIRST radio sources with 2MASS near-infrared detections, but without optical counterparts. They concluded that this population comprises approximately 20% of all QSOs.
ROSAT found that, while known AGN dominate the soft (0.1–2.0 keV) cosmic X-ray background (CXRB; Lehmann et al. 2000), an additional population of heavily absorbed AGN would be required to account for the harder high-energy spectrum (Comastri et al. 1995). To match both the CXRB spectrum and the observed hard X-ray number counts of other pre-Chandra surveys (e.g. BeppoSAX, Fiore et al. 2001), the X-ray absorbed AGN population is estimated to outnumber unabsorbed AGN by 4:1 and perhaps to increase with z (Gilli et al. 2001; Comastri et al. 2001). Although the local ratio of Type 2 to Type 1 AGN appears to be 2–4 (Maiolino & Rieke 1995; Huchra & Burg 1992), a large, thus far undiscovered population of X-ray absorbed AGN at higher z was required by these models.
XMM-Newton and Chandra are finding objects in sufficient numbers to explain 8590% of the CXRB at energies 5 keV (Bauer et al. 2004, Worsley et al. 2004). While these include a significant number of hard spectrum sources, most are at low-redshift, contrary to the expectations of the models (Gilli et al. 2001). Wider area surveys, which are more able to characterize the absorbed population, are beginning to find higher redshift absorbed sources (Fiore et al. 2003, Treister et al. 2005), approaching the model predictions. The hard X-ray sources correspond to both optically faint objects and bright, nearby elliptical galaxies, as well as more traditional, broad/narrow-line AGN (Silverman et al. 2004). They frequently have red continua ( JKS ) which, combined with their optical colors, are consistent with the moderate amounts of gas and dust absorption required to match the CXRB at energies keV (Compton-thin; equivalent neutral hydrogen column density, cm-2). Thus, evidence is mounting that absorbed AGN are indeed important contributors to the CXRB, although in some cases their nuclei are only visible at X-ray wavelengths.
Given the high surface density and similarities of the new population of 2MASS AGN to the absorbed AGN being found in the X-ray surveys, a census of the X-ray properties of the 2MASS AGN will aid their understanding and show whether this previously missed population contributes significantly to the CXRB.
We have surveyed a well-defined, color-selected subset of 44 2MASS AGN (Wilkes et al. 2002) using the Advanced CCD Imaging Spectrometer array (ACIS; Nousek et al. 1998) on Chandra. The subset was selected to have and , including the brightest and reddest objects but covering sufficient parameter space to be representative of the new population: , 0%P% (Smith et al. 2001) and a full range of optical class. A comparison of the KS-band to 1 keV flux density ratios (FX/FK, the latter computed assuming a normal AGN X-ray spectrum; = cm-2, =2) with those of low-redshift, broad-line AGN (see Figure 1 in Wilkes et al. 2002) demonstrates the general weakness of X-ray emission from the 2MASS QSOs, placing them in the range measured for BAL QSOs and Sy2 galaxies. The reddest AGN in the sample (JKS) are the weakest X-ray sources, suggesting absorption by related dust and gas affects the emission in IR and X-ray bands respectively.
The Chandra observations, aimed at detecting the AGN, are generally of too low signal-to-noise to provide constraints on the X-ray spectra and absorption beyond those of hardness ratios or simple power-law fits. A normal AGN X-ray spectrum with little absorption yields a Chandra hardness ratio (HR=[H-S]/[S+H], where S, H are the net counts in energy bands 0.32.5keV and 2.58keV respectively) of HR= (ACIS-S, Cycle 4). The 2MASS sample covers the range , consistent with absorbing columns of = cm-2 for most sources. Spectral fits for those with higher counts reinforce this conclusion (Wilkes et al. 2004). Two 2MASS AGN are consistent with no absorption above the Galactic column (). Contrary to a simple absorption scenario in which a single screen of gas and dust obscures all continuum emitting regions, there is no correlation between HR and JKS, i.e. while being X-ray-weak, the reddest objects are not necessarily those with the hardest X-ray emission. However, AGN X-ray spectra often contain a number of components which modify the power law continuum emission believed to originate in the central AGN. In addition to cold absorbing material, these may include: partial covering of the source, an ionized absorber, soft excess emission, and scattering/reflection by neutral and/or ionized material. Such complexity can strongly affect the interpretation of a simple hardness ratio determined from the low S/N Chandra spectra.
Correction of the X-ray flux for absorption based on the hardness ratios moves only about half of the 2MASS sample into the X-ray faint region occupied by the Elvis et al. (1994) broad-line AGN in FX/FK (Wilkes et al. 2004), or even the X-ray weaker, optically selected sample of Laor et al. (1997). Possible explanations for this X-ray weakness include: a high KS flux due either to increased hot dust emission or the inclusion of extended, host galaxy emission in these mostly low-redshift sources; instrincally faint and hard X-ray emission; or complex X-ray spectra that result in our underestimating their intrinsic X-ray flux.
With the aim of removing these ambiguities for at least a subset of the Chandra sample of 2MASS AGN, we recently obtained XMM-Newton spectra of 5 representative sources (Table 1). Improved X-ray spectra will clarify the relationship with other AGN properties such as optical and IR color, optical polarisation and X-ray to IR ratio. Understanding the individual sources is a key to determining the relation of these new, red, X-ray absorbed, broad-lined AGN to the remainder of the AGN population.
Throughout this paper, we assume H∘=70 km s-1 Mpc-1, =0.7, and =0.3.
2 Observations
Details of the XMM-Newton observations of the 2MASS sources are given in Table 1. X-ray data were available throughout each observation from the EPIC pn (Strüder et al. 2001) and MOS (Turner et al. 2001) cameras, providing moderate resolution spectra (35 eV at Al-K (1.5 keV) and 61 eV at Mn-K (5.9 Kev) over the energy band 0.3–10 keV.
The X-ray data were first screened with the XMM SAS v5.4 software and events corresponding to patterns 0-4 (single and double pixel events) were selected for the pn data and patterns 0-12 for MOS1 and MOS2, the latter then being combined. A low energy cut of 300 eV was applied to all X-ray data and known hot or bad pixels were removed. Source counts were obtained from a circular region of 45′′ radius centered on the target source, with the background being taken from a similar region offset from, but close to, the source. Unfortunately the background was high during parts of each observation, and these data have been excluded from the subsequent spectral analysis, using the recommended cut-off background rates of 1 s-1 (pn camera) and 0.35 s-1 (MOS camera). The resulting exposures and source counts are listed in Table 1. The integrated data set for each source was then available for spectral analysis. Individual EPIC spectra were binned to a minimum of 20 counts per bin to facilitate use of the minimisation technique in spectral fitting. Spectral fitting was based on the Xspec package (Arnaud 1996) and all fits included absorption due to the relevant line-of-sight Galactic column. Errors are quoted at the 90% confidence level ( for one interesting parameter).
3 X-ray spectral analysis
The optical and Chandra X-ray properties of the 5 AGN are listed in Table 2 and repeated here as we describe the X-ray spectral fitting of the XMM-Newton data. Note that the Chandra fits were made over the 0.3-8 keV band, with a power law plus cold absorption (using the CIAO software, Fruscione & Siemiginowska 2000). In assessing the XMM-Newton spectra, we first fitted a power law to the energies 2 keV. This is the conventional approach in analysing AGN X-ray spectra, generally to minimise the effects of absorption. More particularly, in this study, that approach allows a direct comparison of individual source spectra with the CXRB which has the form of a power law of photon index =1.4 above 2 keV. The pn and MOS data are fitted simultaneously in each case, with only the power law index and normalisation untied.
3.1 2MASS J09184860+2117170
In the optical this source shows an intermediate (1.5) spectral classification and lies at a redshift of z=0.149. The Galactic column is = 4.1 cm-2. It is a highly reddened object in the Chandra sample, with JKS=2.23, but the Chandra data are soft (HR=0.6) and a simple broad-band power law fit yields a power law index close to that for a normal, unabsorbed Seyfert 1 galaxy (Table 2). Thus, if absorption is responsible for the red color, X-ray spectral complexity must be present causing the X-ray absorption to be underestimated in a simple power law fit.
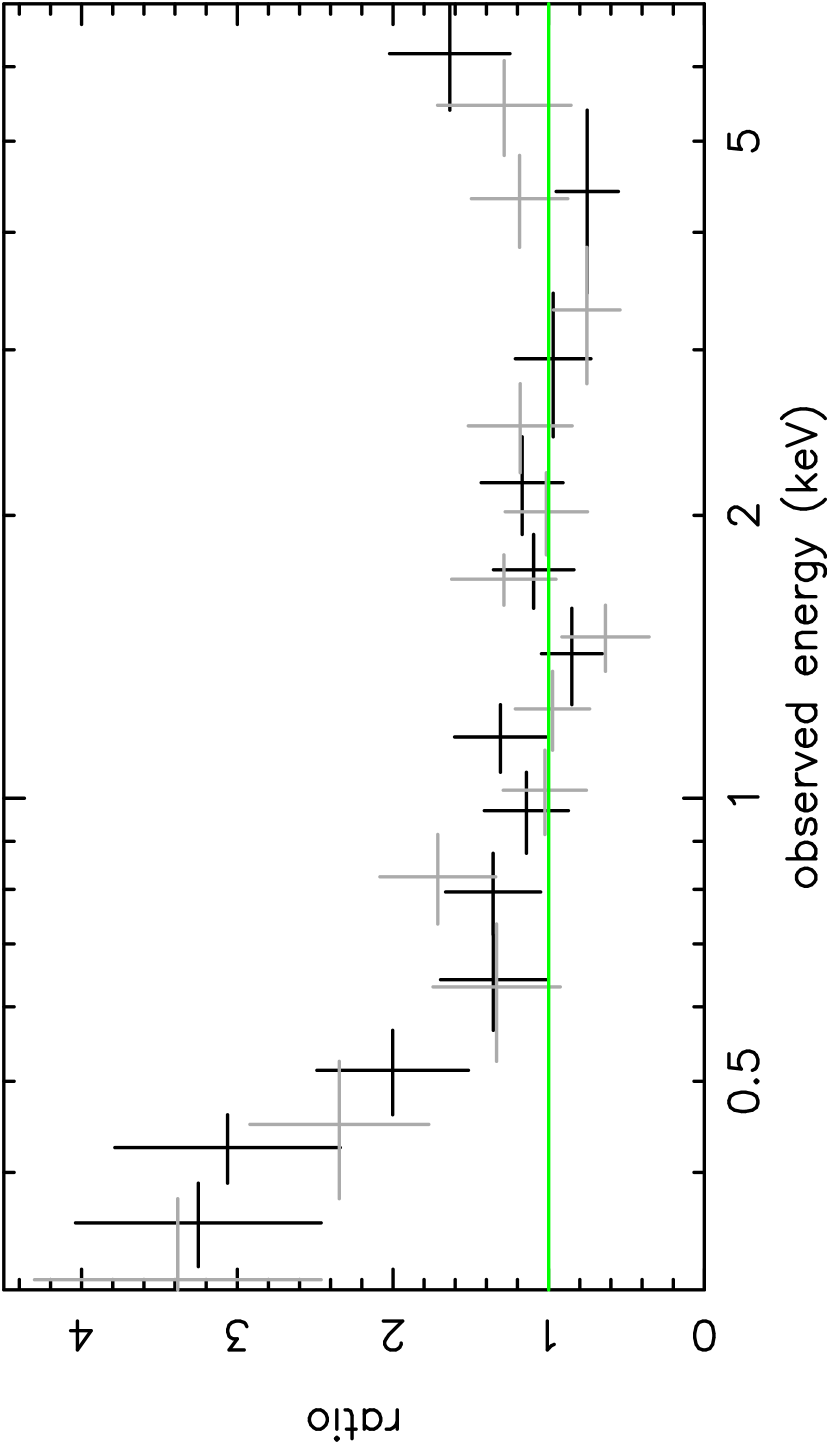
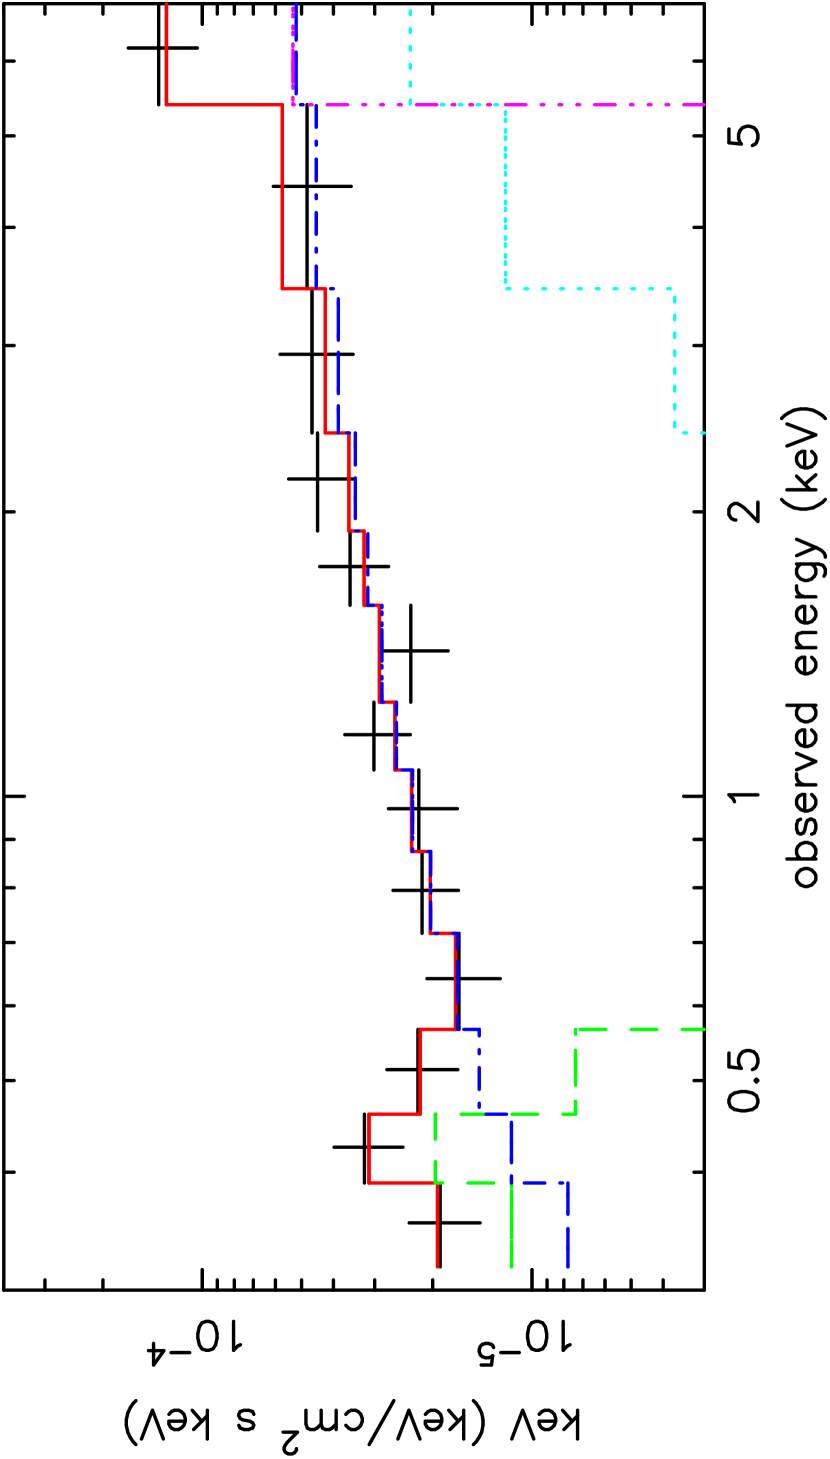
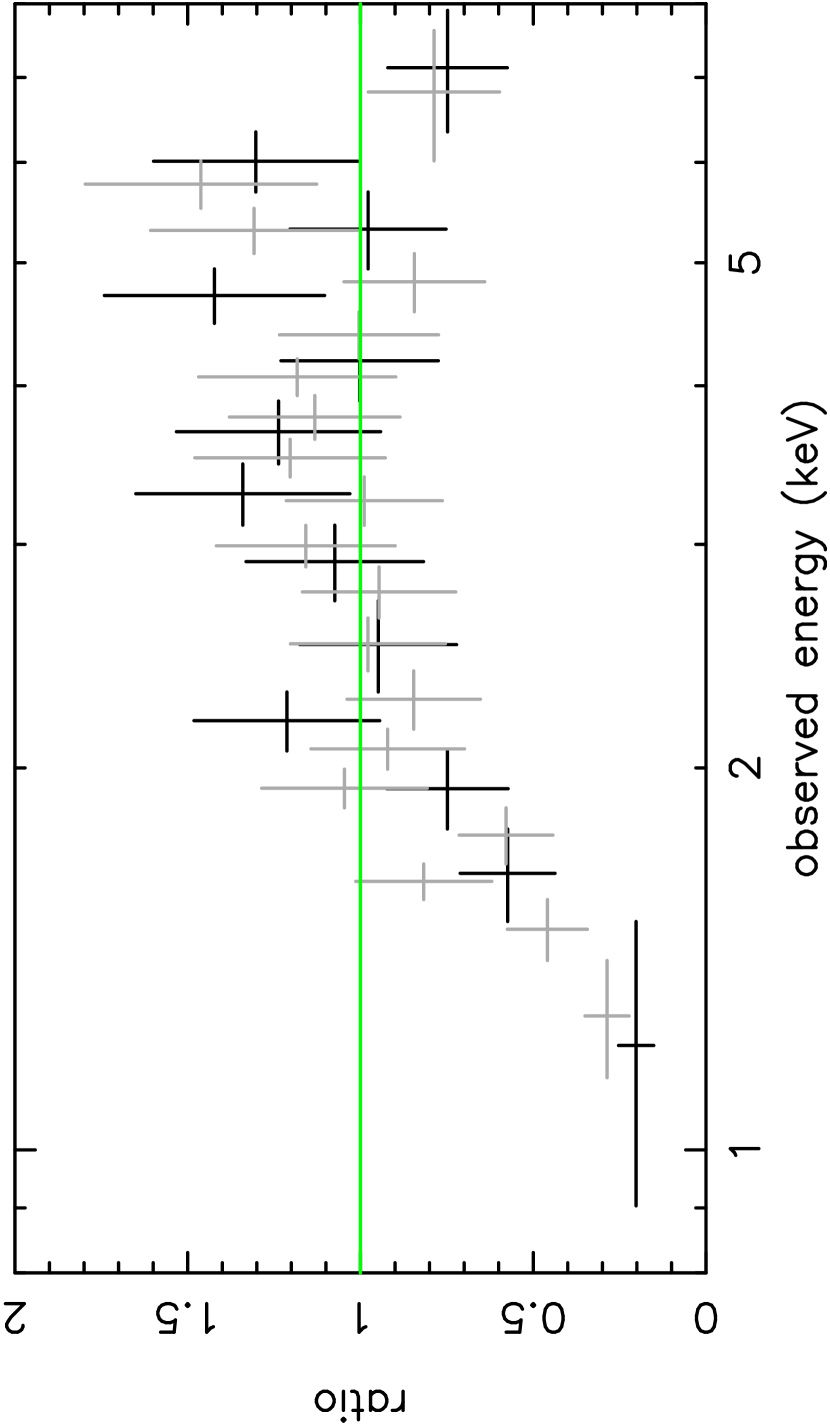
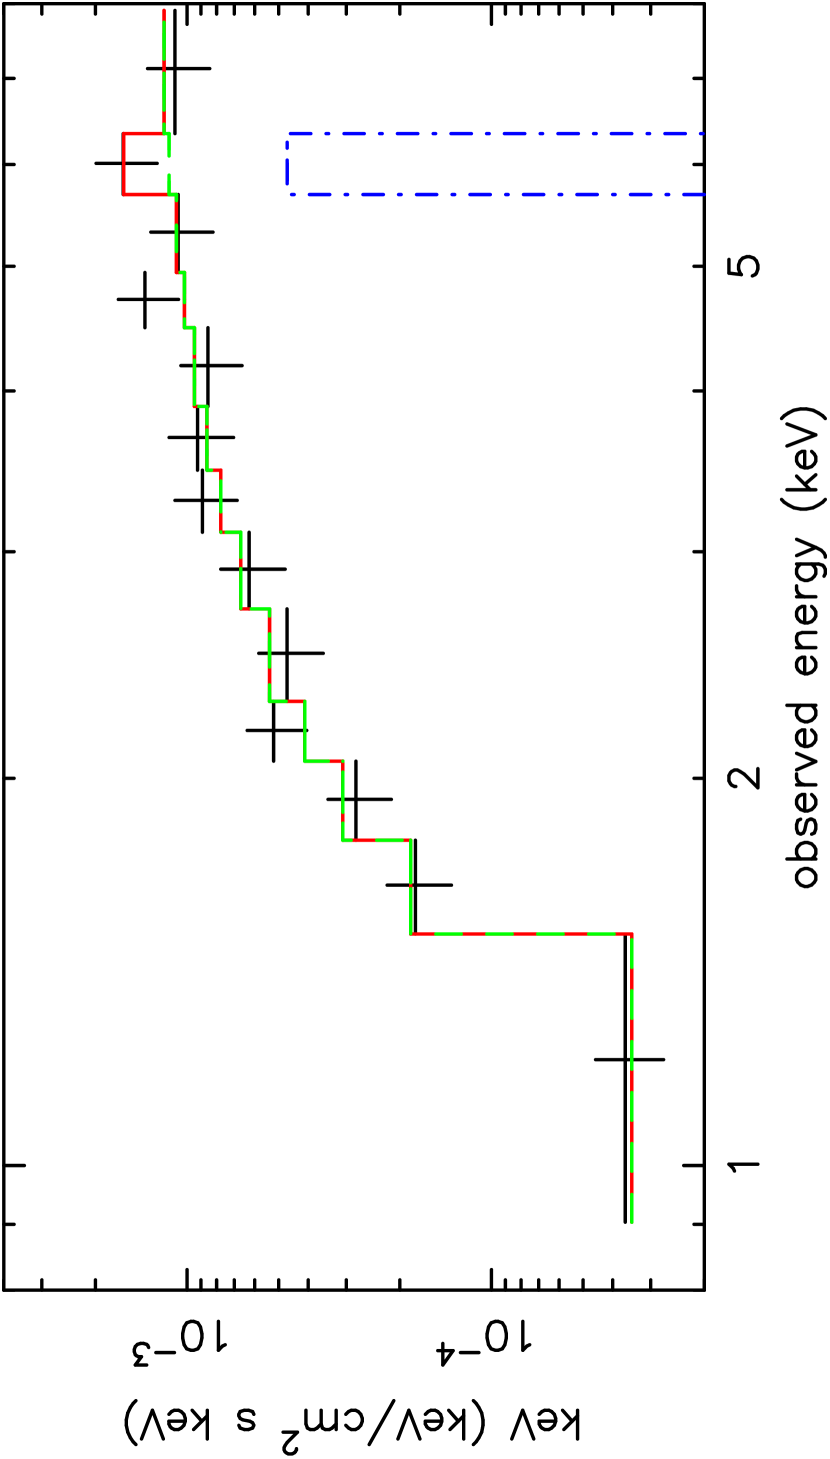
XMM-Newton observed this source to be a factor 5 fainter than during the Chandra observation. Fitting the pn and MOS data to a power law above 2 keV yielded flat but poorly constrained spectral indices of =1.260.39 (pn) and =1.210.42 (MOS). Extrapolating this power law to 0.3 keV was clearly a poor fit (=59 for 25 degrees of freedom) with a soft excess and also some upward curvature in the highest energy channels (Figure 1a). Since the latter was suggestive of reflection a further power law fit was made, now including the data down to 1 keV (to tighten the constraints) and adding a cold reflection component modelled in Xspec by PEXRAV (Magdziarz & Zdziarski 1995). The best fit had a high reflection component, with R6. The power law index increased by 0.3 in this fit, but the soft excess remained. Adding a blackbody then provided an acceptable fit over the whole 0.3-8 keV energy band. Interestingly, a gaussian emission ‘line’ matched the soft excess rather better and this is included in the best-fit model (=13 for 20 degrees of freedom) reproduced in Figure 1b. The parameters of the best-fit model are an underlying power law index =1.650.33 (pn) and =1.560.38 (MOS), with cold reflection (R, EW(FeK) keV), and a gaussian emission line at 0.440.13 keV, with line width 75 eV and flux photon cm-2s-1 (Table 3). This ‘line’ is a rough approximation to the blend of line emission expected from ionised gas. More detailed modeling of this feature, unwarranted in the current low S/N data, would require an accounting for the uncertain energy calibration below E keV.111As discussed in XMM-Newton document XMM-SOC-CAL-TN-0018 by M. Kirsch (2004).
We determine an upper limit on the X-ray column density, cm-2 (90% confidence). Including absorption at this level in the spectral fit steepens the deduced power law to , well within the normal range.
The observed energy fluxes (pn camera) (Table 4) were erg cm-2s-1 (0.3-1 keV), erg cm-2s-1 (1-2 keV), and erg cm-2s-1 (2-10 keV). The overall 0.3-10 keV luminosity was erg s-1 with erg s-1 in the gaussian soft X-ray emission component.
3.2 2MASS J10514425+3539306
At a redshift of z=0.158 this source has been optically classified as a type 1.9 QSO (Smith et al. 2003). The Galactic column is = 1.9 cm-2. Although less strongly reddened than 2MASS J09184860+2117170, it had a harder HR=0.2 in the Chandra observation. The Chandra data had sufficient counts to determine a power law fit of =1.60.2 attenuated by a column of = (5.61.4) cm-2.
The XMM-Newton data confirmed and further constrained the Chandra spectral fit. A power law for energies 2 keV yielded photon indices =1.670.11 (pn) and =1.510.11 (MOS). When extrapolated to a lower energy strong attenuation is evident (Figure 2a). Refitting the data over the 0.3–9 keV band with a power law plus absorber (modelled by the photoionised absorber model, ABSORI in Xspec) produced an excellent fit (=103 for 115 degrees of freedom), with an absorbing column (solar abundances) of cold matter (0.7) of = (7.20.7) cm-2. The power law index steepened in this broad-band fit (reproduced in Figure 2b) to =1.790.08 (pn) and =1.700.08 (MOS).
The observed fluxes (pn camera) (Table 4) were erg cm-2s-1 (0.3-1 keV), erg cm-2s-1 (1-2 keV) and erg cm-2s-1 (2-10 keV). The observed 0.3-10 keV luminosity was erg s-1, and erg s-1 with the absorbing column removed. Such a high luminosity supports the identification of 2MASS J10514425+3539306 as a QSO, rather than a LINER/starburst galaxy. In addition, detailed comparison of the X-ray fluxes shows the source had brightened by a factor of 1.5–2 between the Chandra and XMM-Newton observations, larger than the current uncertainties in cross-calibaration.
3.3 2MASS J13000534+1632149
This object is optically classified as a Type 2 QSO (Schmidt et al. 2002, Smith et al. 2003), updated from the 1.x classification in Smith et al. (2002), which was based on a low S/N discovery spectrum. It lies at a redshift of z=0.08 and the Galactic column is = 2.0 cm-2. Chandra found this source to have the hardest spectrum of our sub-set, with HR=0.2 (Wilkes et al. 2002), and cm-2 (Table 2). The XMM-Newton observation found an X-ray flux level essentially unchanged from the Chandra value (20% change based on the predicted vs. observed XMM-Newton count rates).
A power law fit for energies 2 keV yielded very flat (hard) photon indices of =1.160.16 (pn) and =1.10.2 (MOS), with an extrapolation to lower energies showing a cut-off similar to that in 2MASS J10514425+3539306 (Figure 3a). Adding ABSORI to model the attenuation, the best-fit power law steepened to =1.670.20 (pn) and =1.650.21 (MOS), with a large absorbing column (solar abundances) of = (2.90.5) cm-2. The ionisation parameter (= ) was =4.11.7, indicating the absorbing material is, at most, only weakly ionised.
Although the absorbed power law fit was statistically very good (=20/28), the residuals showed an excess near 6 keV. Adding a narrow gaussian line to the model further improved the fit, to =11/24, with a line energy (AGN rest-frame) of 6.200.35 keV and EW250 eV. This addition to the model resulted in a further steepening of the power law index by 0.1. Figure 3b illustrates the best-fit pn spectrum.
The observed fluxes (pn camera) (Table 4) were erg cm-2s-1 (0.3-1 keV), erg cm-2s-1 (1-2 keV) and erg cm-2s-1 (2-10 keV). The observed 0.3-10 keV luminosity was erg s-1, and erg s-1 with the absorbing column removed.
3.4 2MASS J14025120+2631175
The final two objects in our sample are optically classified as Type 1 QSOs. 2MASS J14025120+2631175 is at a redshift of z=0.187, and the Galactic column = 1.4 cm-2. The Chandra observation yielded a hardness ratio HR=0.6 indicating significant X-ray flux in the 0.5-2.5 keV band. The simple power law fit (Table 2) showed a steep power law of =20.4, with no significant absorption.
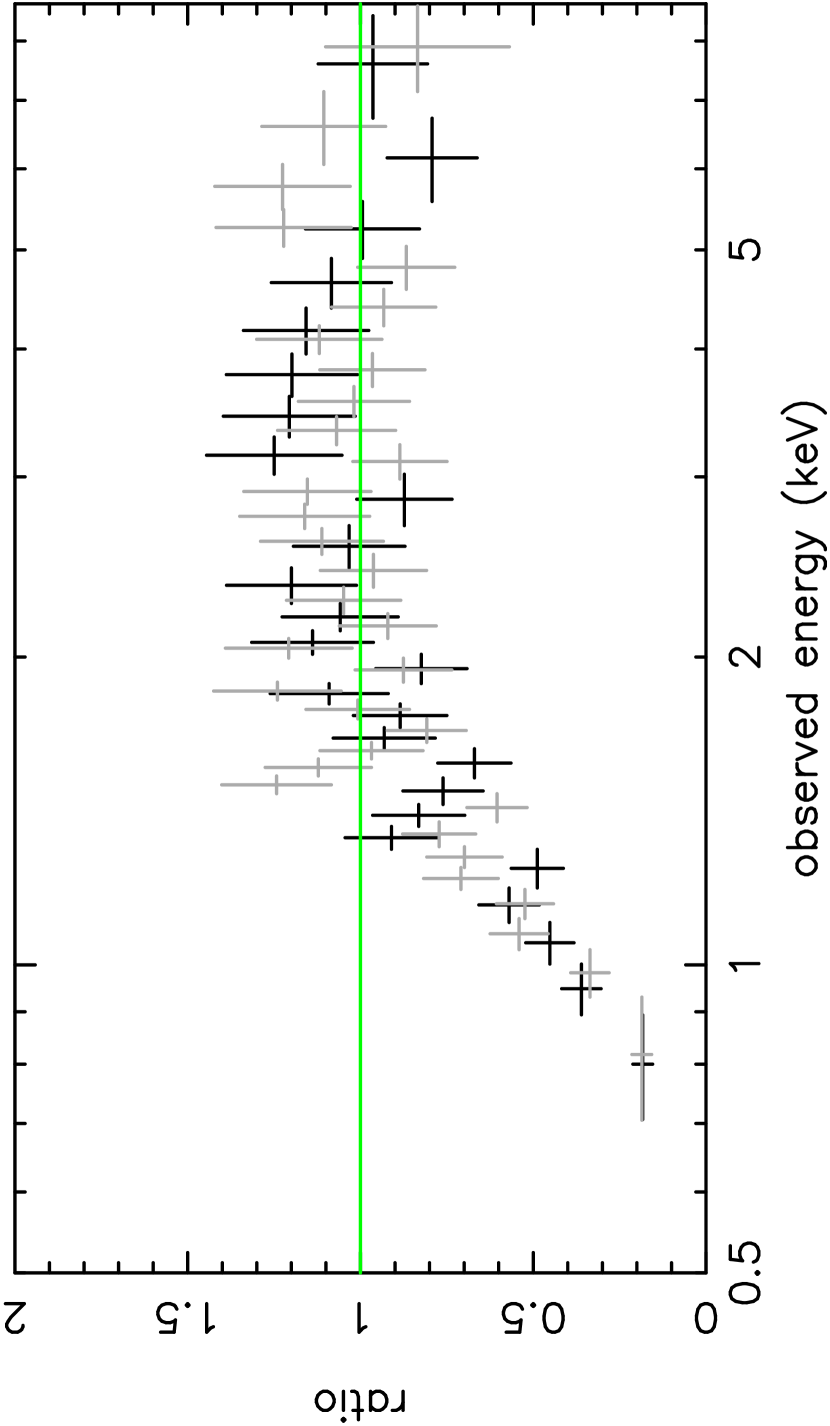
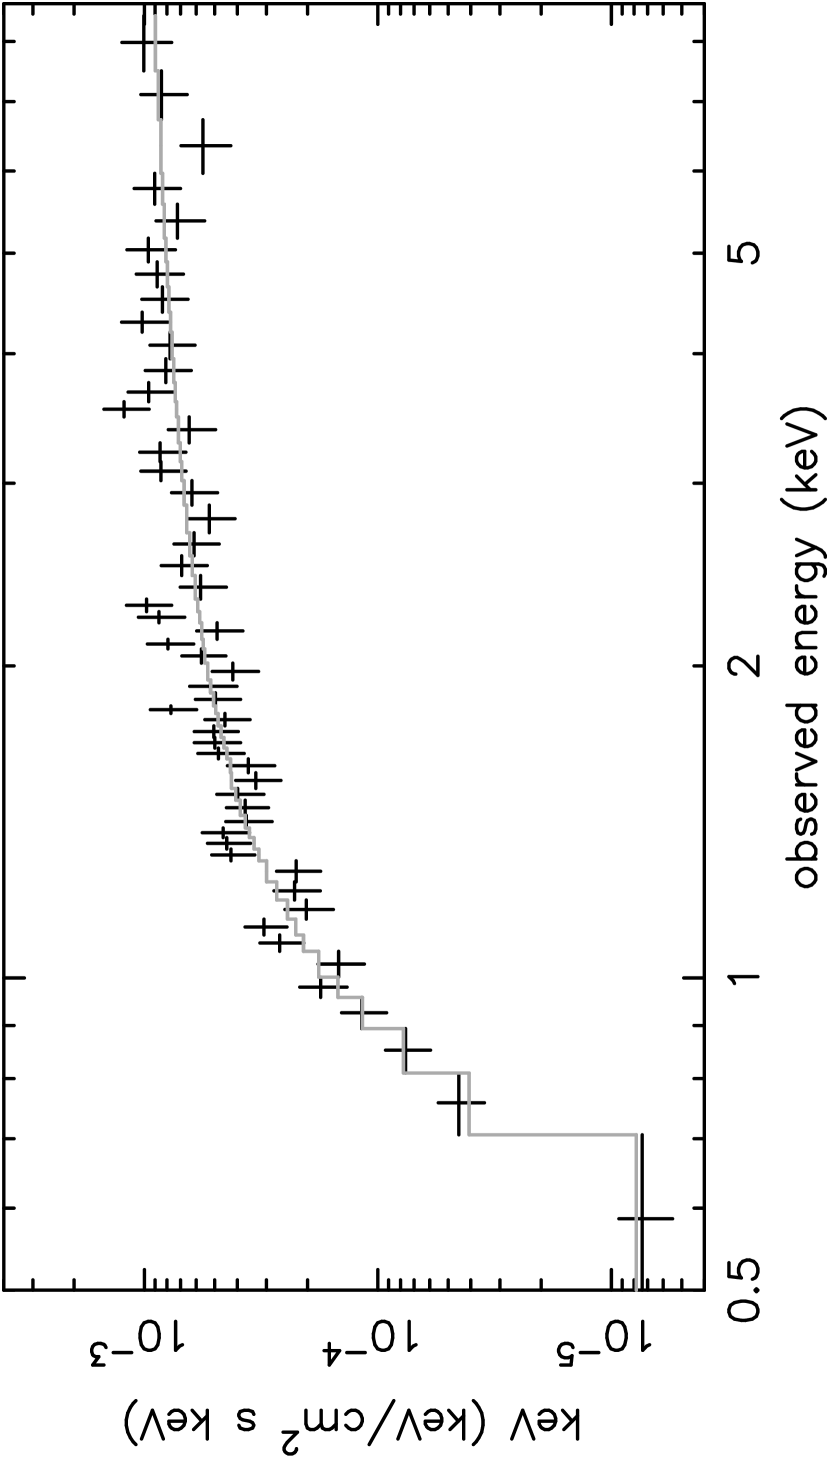
Our XMM-Newton observation found 2MASS J14025120+2631175 to be the brightest X-ray source in the sample, at a flux level consistent with that observed by Chandra. A power-law fit for energies 2 keV yielded moderately hard spectral indices =1.530.16 (pn) and =1.40.15 (MOS). Extrapolating this fit to 0.3 keV revealed a soft excess (Figure 4a). Modelling the soft excess with a gaussian emission line (again a marginally better fit than a blackbody; = for dof), gave an excellent fit (=110/102, Figure 4b). The ‘line’ energy (AGN rest frame) was 0.440.10 keV, with a width 100 eV and flux ph cm-2s-1. We also determine an upper limit on the X-ray column density, cm-2 (90% confidence); including absorption at this level in the spectral fit steepens the deduced power law to , closer to the normal range for type 1 AGN.
The observed fluxes (pn camera) (Table 4) were erg cm-2s-1 (0.3-1 keV), erg cm-2s-1 (1-2 keV) and erg cm-2s-1 (2-10 keV). The overall 0.3-10 keV luminosity was erg s-1 with erg s-1 in the gaussian soft X-ray emission component.
3.5 2MASS J23444958+1221432
2MASS J23444958+1221432 is classified as a Type 1 QSO, lies at a redshift of z=0.199, and is viewed through a Galactic column of = 4.7 cm-2. It had a hardness ratio, HR= in the Chandra observation, with a simple power law fit finding a power law of =20.4, plus an absorbing column of = (42) cm-2.
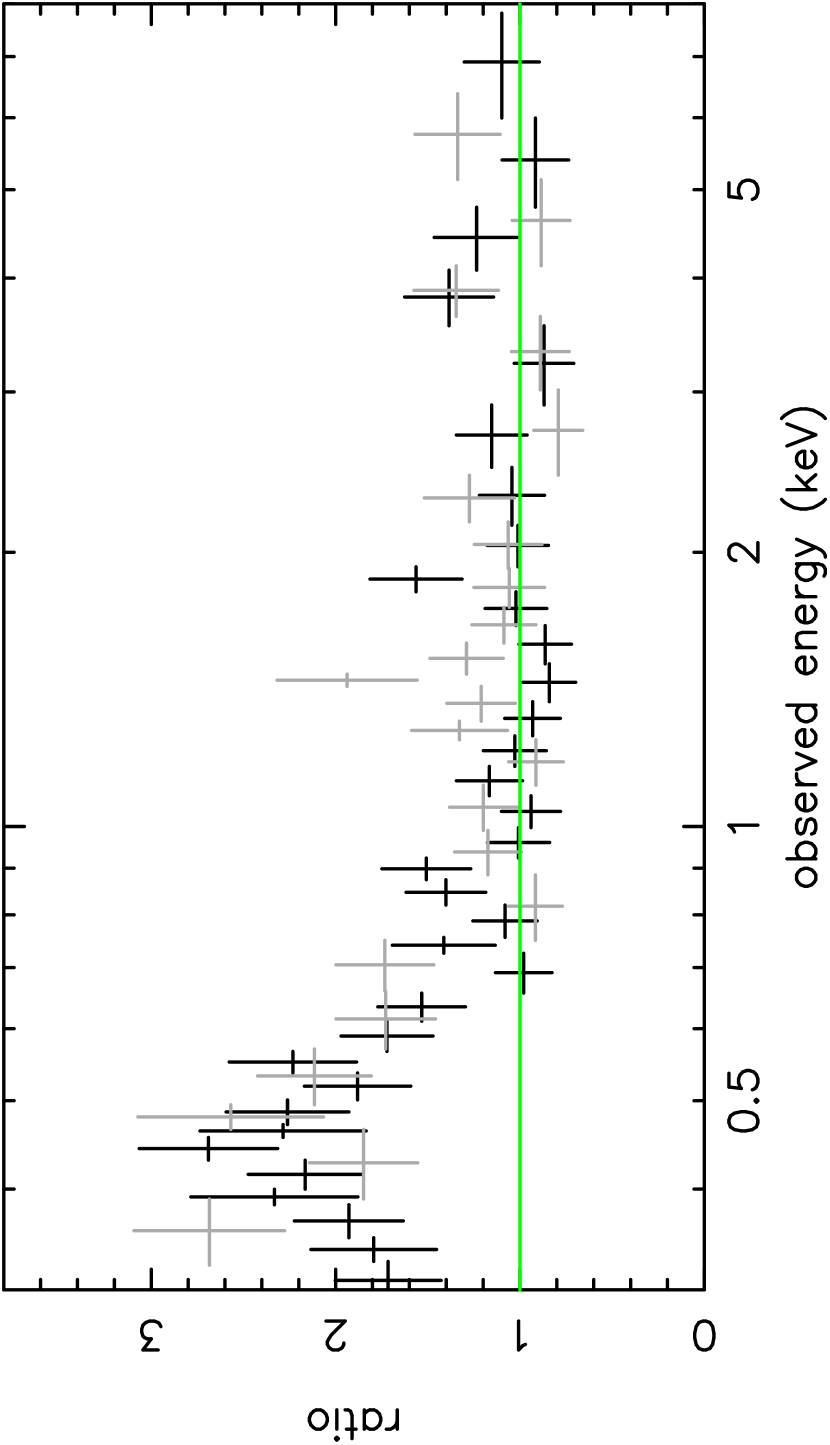
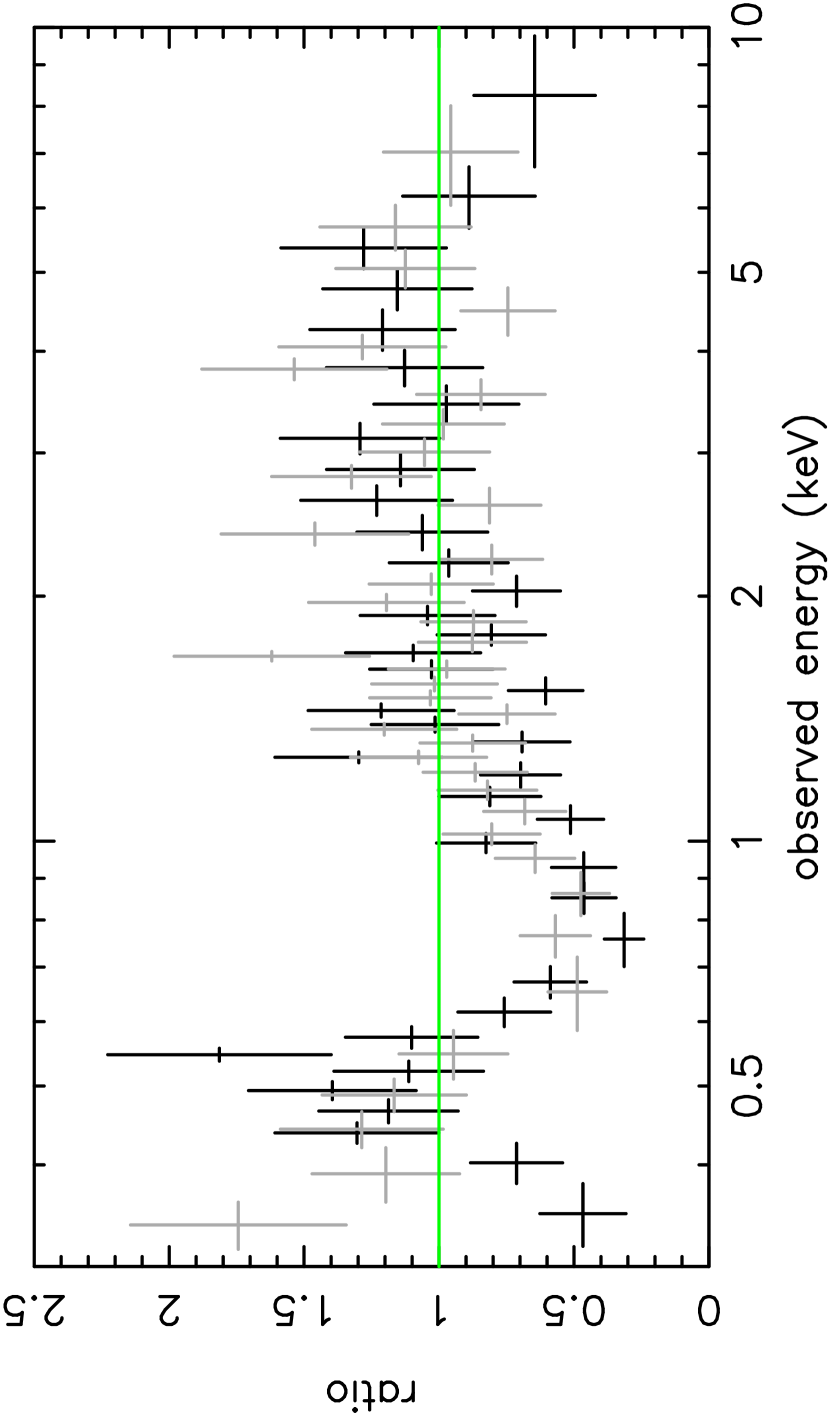
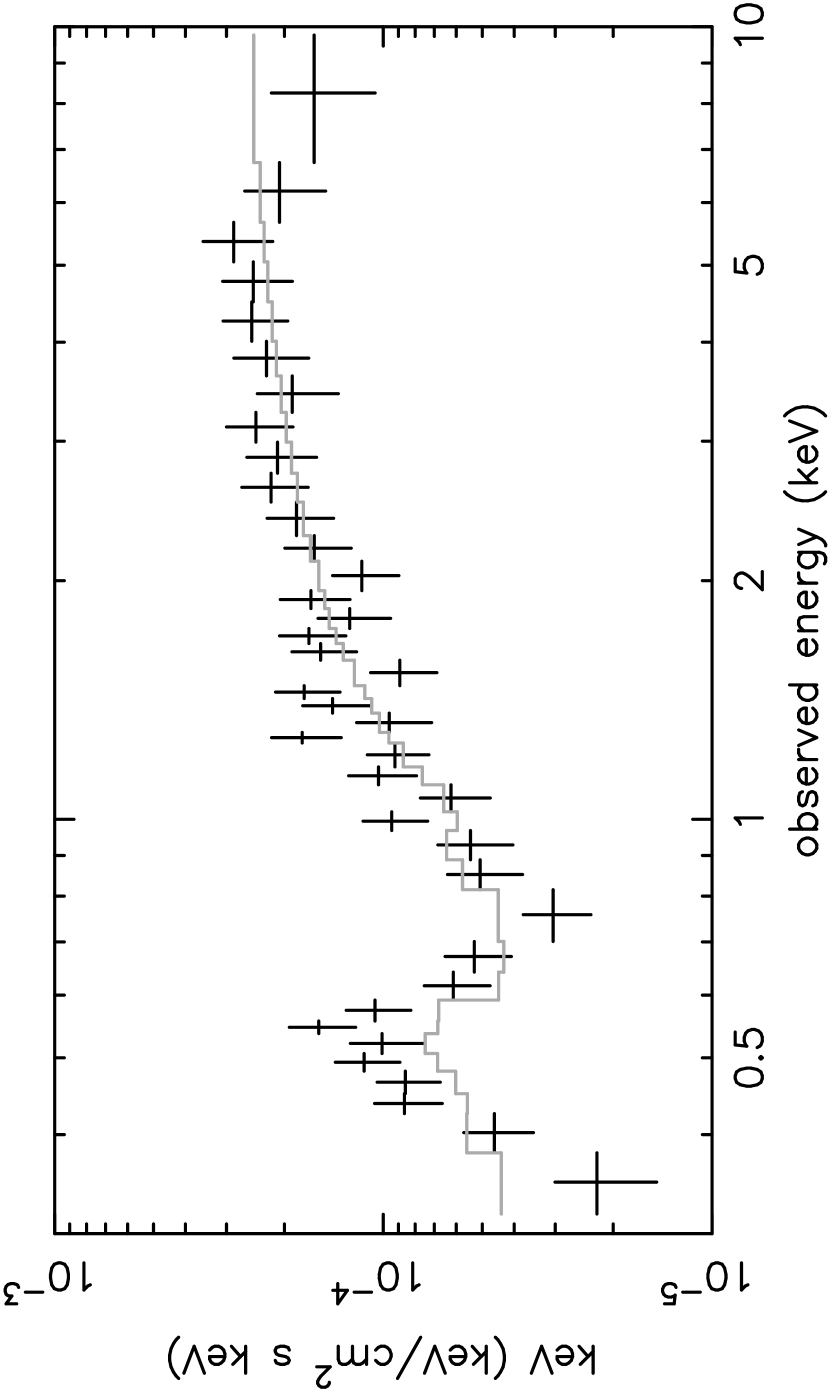
Our XMM-Newton observation found 2MASS J23444958+1221432 to be substantially fainter than during the Chandra observation, by a factor of 2–3. Proceeding as before we first fitted a power law to the data above 2 keV, obtaining typical Type 1 indices of =1.700.16 (pn) and =1.580.18 (MOS). Extrapolating this fit to 0.3 keV showed the spectrum to be complex (Figure 5a) with evidence of absorption and also possibly a soft excess.
To first model the absorption, we again added ABSORI to the power law, finding a reasonably good fit (=91/73) with a column density =(9.71.5) cm-2 of moderately ionised gas. The ionisation parameter =219 is constrained by the energy of the flux upturn, observed below 0.7 keV, which corresponds primarily to the absorption edge of ionised OVII in the model. However, visual examination of this spectral fit (Figure 5b) shows the absorbed power law model fails to match fully the observed spectral upturn.
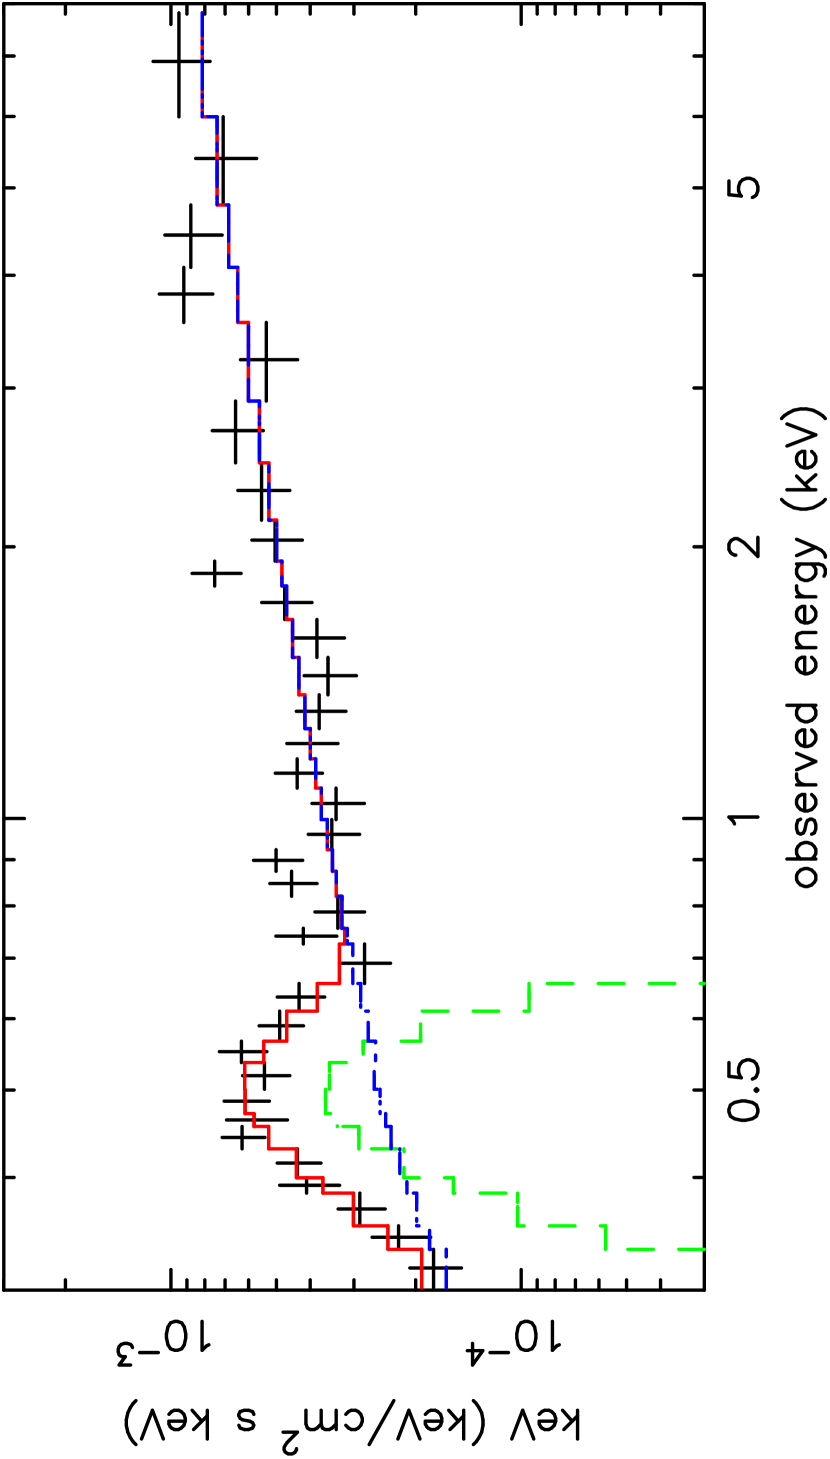
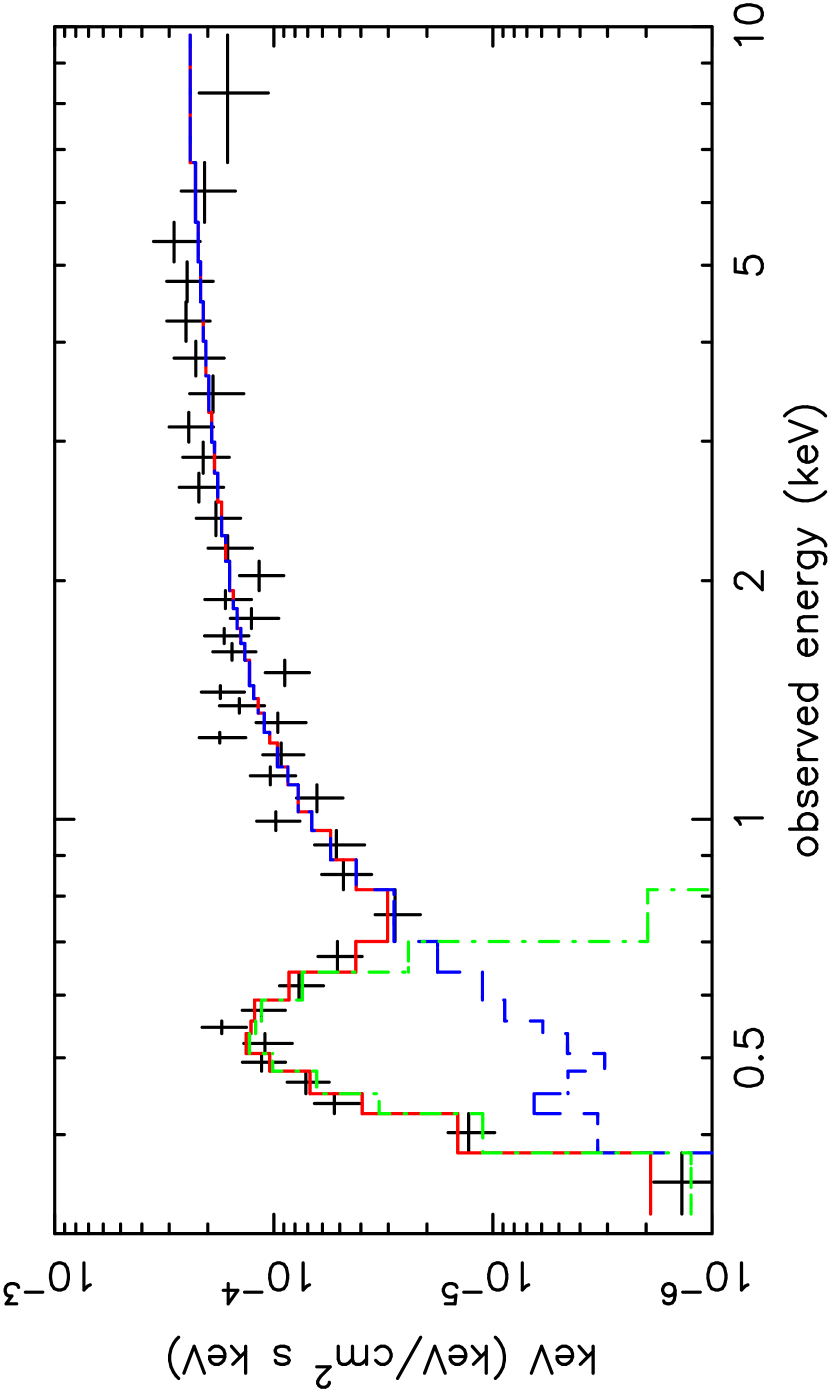
We therefore added an emission component, modelled by a gaussian line, obtaining a significantly improved fit of =65/69. As with 2M0918, this ‘line’ approximates the blend of emission lines from ionised gas and accurate modeling would require accounting for the uncertain energy calibration at E0.5 keV. In this fit the continuum curvature below 2 keV was again modelled by ABSORI, while the low energy upturn was due mainly to the gaussian line. A consequence was that the ionisation parameter of the absorbing column fell to =0.020.2. Figure 6 reproduces this ‘best’ spectral model for 2MASS J23444958+1221432. The power-law indices in this fit were =1.840.27 (pn) and =1.910.22 (MOS). The low ionisation absorber had =(6.52.6)cm-2. The gaussian line had an energy (AGN rest frame) of 0.640.05 keV and flux of ph cm-2 s-1 (Table 3).
The observed fluxes derived from this best fit (pn camera) (Table 4) were erg cm-2s-1 (0.3-1 keV), erg cm-2s-1 (1-2 keV) and erg cm-2s-1 (2-10 keV). The overall 0.3-10 keV luminosity was erg s-1 with erg s-1 in the gaussian soft X-ray emission component.
4 Discussion
The primary motivation for the XMM-Newton observations was to study the X-ray spectral complexity to estimate its effect on the X-ray properties of these sources in the lower S/N Chandra data and thus guide our assessment of the larger Chandra sample. Although the XMM-Newton exposures were typically a factor 2 shorter than planned, due to the rejection of noisy data, the recorded counts were greater and hence the broad-band X-ray spectra were better determined than in the Chandra survey. For simplicity we refer to the individual AGN using only their first 4 numbers, e.g. 2MASS J091848+2117 is 2M0918, in the following discussion. Since the spectral form is known to change with flux level in AGN, it is important to note that 2M1051 was brighter, while 2M0918 and 2M2344 were fainter in the XMM-Newton observations.
4.1 The X-ray Properties of the 2MASS AGN.
Our XMM-Newton observations showed two of our five sources to have extremely hard observed spectra ( 1.3, Table 3) above 2 keV (2.16-2.37 keV adjusted for redshift). In the case of 2M0918 our modelling suggests this is due to a strong (non-varying) reflection component, consistent with the low flux state during the XMM-Newton observation, while 2M1300 exhibits the largest absorbing column, and the only absorber with significant opacity above 2 keV. Allowing for a large reflection component in 2M0918 and the observed cold absorption in 2M1300 shows the underlying power law slopes to be ‘normal’ for a Type 1 QSO (Table 3). These two cases show how the presence of strong reflection or a Compton thin absorber can make the observed spectrum hard above 2 keV. In two other cases (2M1051 and 2M2344) the XMM-Newton spectra show substantial cold absorption, though not sufficient to greatly affect the spectral slope above 2 keV. For none of these four red AGN does the intrinsic power law continuum appear unusually hard. The fifth, 2M1402, has a somewhat harder than average power law () and a soft excess but no detected absorption in the XMM-Newton data.
A soft X-ray excess is found in all three Type 1 sources (i.e. Type 11.5: 2M0918, 2M1402 and 2M2344), in each case having a luminosity 5% of the corresponding 2–10 keV luminosity. All three soft excesses are well modelled by a gaussian emission line centred at 0.55 keV (in the AGN rest frame), providing a rough approximation to the blend of emission lines expected from ionised gas.
4.1.1 Comparison with the Chandra Data
The Chandra X-ray parameters for the five AGN are listed, along with other multi-wavelength properties, in Table 2. The Chandra values are generally poorly constrained. XMM-Newton detects complexity in three sources, two of which appeared ‘normal’ in the lower S/N Chandra data, and variability in three. XMM-Newton also informs us that a simple hardness ratio is an extremely limited indicator of an AGN spectrum. In particular, using a hardness ratio to deduce the presence and amount of X-ray absorption can be highly misleading or completely wrong. Spectral hardness may be due either to absorption, as originally assumed (Wilkes et al. 2002), or a hard power law or strong reflection component, similar to those of Seyfert 2 galaxies (Turner et al. 1997b), or hardness may be masked by a soft excess component.
The spectral parameters of the two Type 2 (i.e. Type 1.82) sources, 2M1051 and 2M1300, are consistent between the two observations, despite a lower flux level for the latter.
The XMM-Newton spectrum of 2M0918 (Type 1.5) is different from that seen by Chandra (Table 3, Table 2). To make a direct comparison, we determined a flux-based hardness ratio (HRF) from the observed flux in the soft (0.32.5 keV) and hard (2.58.0 keV) bands using the best fit spectrum in each case. A “normal” power law () with a typical Galactic (3 cm-2) yields a HRF=0.14 using this method. For 2M0918, the Chandra data give HRF=0.12 (assuming no detected absorption) while for XMM-Newton the value is significantly harder, HRF=0.21. The error on these values is due to the uncertainty in the spectral fit. The explanation may lie in the X-ray flux being a factor 4–5 fainter in the XMM-Newton observation, deduced by comparing the predicted and actual XMM-Newton count rates. A variable power-law component may have decreased in flux allowing the harder (reflection-dominated?) power law continuum to dominate, while also causing the soft excess to be more visible if the latter is intrinsically less variable. The change in spectrum was confirmed by fitting the Chandra data with the best fit XMM-Newton spectral parameters, which gave a significantly poorer fit than that listed in Table 2 ( = 3.4).
The flux levels and spectral parameters for Type 1 2M1402, are consistent, although XMM-Newton reveals a soft excess that was not visible in the Chandra data. The flux-based hardness ratio is harder in the XMM-Newton data (HR0.04 compared with HR0.23) suggesting some variation.
Type 1 2M2344, similarly to 2M1402, has consistent spectral parameters but XMM-Newton reveals a soft excess which also masks a somewhat higher absorbing column density than is visible in the Chandra data. While the Chandra data, with only counts, do not detect the soft excess, fitting these data with the XMM-Newton-deduced parameters yields a similar to that for the power law fit. Thus, despite a factor reduction in flux in the XMM-Newton data, there is no evidence for spectral variability between the two observations.
Given the variety of behavior in these five AGN, comparison of the Chandra-deduced and flux values with those from the XMM-Newton data (Table 3) shows no systematic effects which could be applied to the full Chandra sample. While this validates any statistical results derived from the Chandra data, it also emphasizes that the deduced properties of individual AGN are not reliable and that the resulting high error levels will generate significant scatter.
4.2 The relation between X-ray spectral and multi-wavelength properties.
Although this sample comprises only five AGN, it is instructive to investigate any systematic relation between the various X-ray properties and their multi-wavelength properties.
Recent X-ray surveys have demonstrated that the X-ray hardness seen at fainter flux levels is generally due to absorption (Kim et al. 2004). The relation between opticalinfra-red colors and X-ray hardness (Mainieri et al. 2002) suggests that the obscuring material includes dust which then reddens the optical/near-IR continuum, although the dust column density is generally lower than expected based on a Galactic gas-to-dust ratio (Alonso-Herrero, Ward and Kotilainen 1997, Maiolino et al. 1998). Although there are exceptions, both in individual AGN and subsets of the popluation such as Broad Absorption Line (BAL) QSOs and the Red AGN reported here, X-ray or optically selected AGN samples show that, statistically, broad-lined AGN are soft (presumed unabsorbed) in the X-ray while narrow-lined AGN are hard (presumed absorbed) (Turner et al. 1998, Risaliti et al. 1999, Laor et al. 1997).
The two Type 2 QSOs in our sample, 2M1051 and 2M1300, with optical types 1.9 and 2.0 respectively, are straight-forward. The X-ray spectral shape is typical of AGN, , and their X-ray absorption ( cm-2, Table 3) is at the low end of the observed range for optical type 2 AGN (Risaliti et al. 1999). Both have significant polarized optical flux, particularly when dilution by host galaxy light is included (Table 2, Schmidt et al. 2003) and show broad lines in their polarized optical flux spectra. The FWHM of H in 2M1300 is unusually broad, kms-1 (Schmidt et al. 2002). Interpretation as edge-on sources viewed through a significant column density of obscuring material, and for which the direct nuclear light is visible due to a mirror above/below the plane of the obscuring material, is standard in the unified scheme (Antonucci 1993). Any X-ray complexity is hidden in this edge-on view.
However, the three Type 1 AGN in this sample all show different behavior which does not imediately fit into a simple unification scenario. While the BR colors follow the expected trend of increased reddening as the type progresses from 1 to 2 (Table 2, Wilkes et al. 2004), the JKS color appears unrelated. For example, 2M0918, which has no detected X-ray absorption, is the reddest (JKS 2.2). Possibly the underlying relation between X-ray absorption and/or optical type with JKS colors is masked by the wide intrinsic range of JKS, (full range) in Type 1.
2M1402 is a Type 1 QSO with no detected X-ray absorption, normal for a Type 1 source except for its unusually red JKS color. If we assume no absorption is present, the red color could be explained by a large amount of hot dust increasing the KS emission.
2M2344, also a Type 1, has significant X-ray absorption. The obscuration must cover the X-ray source but not the BELR, requiring either a small, dense absorber interior to the BELR or a specific orientation with a line-of-sight passing through the wind above a disk/torus (Konigl & Kartje 1994) which allows a view of the BELR.
2M0918 is the most difficult to understand. It is a Type 1.5 in which the broad emission lines are partially obscured. The X-ray continuum is hard above 2 keV but no absorption is detected ( cm-2). The optical and IR continua are redder than is typical of Type 1 AGN, the former is consistent with A ( cm-2 assuming a normal gas-to-dust ratio and that the Elvis et al. (1994) median SED is unabsorbed). This is higher than the maximum column density of cold absorbing material indicated by the XMM-Newton data, which is thus insufficient to explain the opticalIR continuum unless the gas-to-dust ratio is unusually low. A higher S/N XMM-Newton observation has been requested to check the level of X-ray absorption.
Alternatively, a significant contribution by scattered light, as in the classic case of NGC1068 (Turner et al. 1997a), could result in the X-ray emission being dominated by the unabsorbed light from the nuclear regions, scattered off the mirror responsible for the high polarization of the optical emission. This would imply strong absorption, to suppress the direct continuum emission, and neither emission nor absorption would be detectable in the Chandra or XMM-Newton energy bands. In this case, the OIII]5007 line flux, which correlates strongly with the intrinsic X-ray flux in AGN (Mulchaey et al. 1994, Turner et al. 1997a), would appear abnormally strong relative to the observed X-ray flux and the X-ray luminosity would be unusually low. However, the F(OIII])/FX ratios for the XMM-Newton-observed AGN are within of the the mean value of log F/FX = for Sy1 galaxies (Mulchaey et al. 1994), for 2M0918 the value is 1.49 (Wilkes et al. 2004). In comparison, the value for NGC1068, for which the X-ray emission is known to be purely due to scattered light, the value is 0.6. In addition, the X-ray luminosities of the AGN in our sample are erg s-1, in the normal range for AGN (Table 3). It is thus unlikely that we are primarily observing scattered light in the X-rays.
In summary, all three Type 1 can be explained by a unification model which includes lower column density material above/below the disk/torus, such as those in disk-wind models (Konigl & Kartje 1994, Murray & Chiang 1995, Elvis 2000). However additional emission and absorption from dust must also be present. Alternatives, such as a small, dense absorber, can describe individual sources, but not all three using the same scenario.
4.3 2MASS AGN and the CXRB
Models of the CXRB require a significant population of X-ray absorbed AGN in order to match the CXRB spectrum which is significantly flatter than that of unabsorbed AGN (Comastri et al. 1995, Gilli et al. 2001). This population has generally been assumed to be dominated by Type 2 AGN and QSOs whose X-ray emission is generally absorbed (Turner et al. 1998). The observations have not yet found this expected population at high redshift (Bauer et al. 2004). However, the combination of X-ray hardness and visible optical broad-lines in red AGN suggests that a subset of the broad-line AGN population may also be significant contributors. The XMM-Newton results confirm and expand on this possibility, demonstrating that the observed X-ray spectrum may be hard at energies above 2 keV, even where Chandra did NOT detect this hardness (2M0918, 2M1402). All five sources are affected by absorption and/or a soft emission component at energies below keV. For 2M0918 the XMM-Newton data cannot distinguish between an intrinsically hard power law and a strong reflection component which flattens the X-ray spectrum at higher energies.
Interestingly, accounting for spectral complexity in our diverse sample may explain why AGN with apparently normal, steep continua (, Nandra & Pounds 1994) can more closely match the CXRB in the (observed) 2–10 keV band (Table 3). While the (unweighted) mean of the power law indices derived from modelling the XMM-Newton spectra is 1.72, the mean index at energies 2 keV is 1.46 (Table 3), close to that of the integrated CXRB spectrum. This difference between observed and intrinsic spectral forms in red AGN, which is similar to that seen in local, low luminosity AGN, removes the discrepancy between the spectrum of the CXRB and a subset of the AGN that may be responsible for it.
Thus in addition to Type 2 QSOs, there are two, potentially large, subsets of the Type 1 population which may contribute to the CXRB among AGN already known from their optical/IR properties but not identified as X-ray hard in low S/N data: those with significant X-ray absorption, and those with undetected complexity. A more detailed estimation of the possible CXRB contribution of red AGN will be reported in a separate paper (Wilkes et al. 2004).
4.4 Implications of the XMM-Newton results for the nuclear regions of AGN.
XMM-Newton detects a soft X-ray emission component in all three Type 1 QSOs in this sample. Its form and relative luminosity, in all three cases, are similar to those found in variability studies of the bright Seyfert 1 galaxies NGC4051 (Pounds et al. 2004a) and 1H0419-577 (Pounds et al. 2004b), suggesting a common origin in an extended region of moderately ionized gas. Its’ detection in these sources with flatter high-energy slopes, where a relatively weaker power law would render a soft emission component more visible, suggests it may be ubiquitous.
In Type 1 AGN, 2M2344, strong X-ray absorption is detected by XMM-Newton while the broad optical lines remain visible at the usual strength. This requires either that the (cold) absorber lies inside the BELR region or is viewed at an intermediate line-of-sight so that the BELR remains visible. A third alternative of purely scattered broad lines is unlikely given the normal broad emission line strengths. If interior to the BELR, such absorbing material must be of high density to survive the intense ionising continuum. To explain the different behavior of all three Type 1 QSOs in this sample with a single scenario, an intermediate viewing angle through absorbing material in a wind above/below the accretion disk/torus in current unification models (Konigl & Kartje 1994, Murray & Chiang 1995, Elvis 2000) can be combined with increased hot dust emission and absorption. The two Type 2 QSOs are then viewed at a more edge-on orientation, so that the BELR is also obscured. The presence of a large column of cold gas, in one/more components, close to the Super-massive Black Hole (SMBH) adds further complexity to the “Unified Scheme” which could help explain the classification-dependence of some AGN on the waveband being used.
5 Summary
XMM-Newton observations of five red AGN, selected as part of the 2MASS survey by their red JKS( color, show them to have a variety of X-ray spectral forms. These results confirm and expand our earlier conclusions (Wilkes et al. 2002) that these sources are X-ray hard. Their observed emission is hard at energies above 2 keV even when it appears soft in the Chandra data. This hardness is due either to absorption, as expected from a simple obscuration scenario, or to a hard (intrinsic/reflected) X-ray power law. In several sources XMM-Newton reveals complexity that was not apparent in the Chandra data, emphasizing the limitations of low S/N data in estimating X-ray absorption and/or spectral parameters. Although the Chandra data can be misleading, the variety of behavior results in no systemmatic effects on Chandra-deduced parameters which could be used to guide our analysis of the larger sample.
The two Type 2 sources have the simplest spectra, showing absorption cm-2, at the low end of the distribution for optical Type 2 AGN, and no further complexity. This is fully consistent with the edge-on view expected for type 2 AGN in standard unification models. All three Type 1 sources have complex spectra with a soft excess and some combination of a normal power law, reflection and cold absorption. The soft excess is best fit by a broad gaussian emission line which, in this low S/N data, provides a reasonable approximation to the blend of line emission expected from ionised gas. It may be ubiquitous, though often hard to detect due to the presence of the strong, unabsorbed, intrinsic power law in most AGN. It tends to be constant and it may originate in an extended region of ionised gas (Pounds, Wilkes & Page 2005).
The mean observed X-ray spectrum of these AGN at energies above 2 keV, , matches well with that of the CXRB at these energies. However, in all cases, the underlying power law has a normal, slope (Table 3). Thus within this red AGN sample, there is no discrepancy between the observed spectra of the AGN and the CXRB. The combination of a hard observed X-ray spectrum above 2 keV and the presence of broad emission lines in several cases suggests two types of Type 1 QSOs which have been largely overlooked as contributors to the CXRB, i.e. those with absorbed and/or complex spectra. Their contributions may be significant. Red AGN are common at low-redshift, comprising % of the population which is otherwise missed in current optical surveys (Glikman et al. (2004). Their numbers at higher redshift are less well-determined since the red selection criterion is less effective at z (Cutri et al. 2002). Improved information on their space density, in particular as a function of redshift, will soon be provided by Spitzer-Chandra wide area surveys, allowing better estimates of both the importance of red AGN to the full AGN population and their contribution to the CXRB.
Significant X-ray absorption in Type 1 QSOs cannot be explained by simple unification models. To cover the X-ray source but not the broad emission line region, the absorbing material must either be small (nuclear) or patchy. The intermediate level of the absorption, cm-2, is suggestive of the outflowing wind/atmosphere above a disk/torus (Konigl & Kartje 1994, Murray & Chiang 1995) in current unification models and thus of an intermediate viewing angle for red AGN. This scenario can also explain the observed red optical and near-IR colors. However, it can only explain the properties of all three Type 1 if we also invoke unusually high levels of hot dust emission and/or absorption. Thus X-ray observations of these red AGN will not only provide a check on the presence of absorption, but also a unique probe of the absorbing material. Although X-ray variability, which generally occurs on a much faster timescale than seen in the near-IR for radio-quiet AGN such as these (Neugebauer & Matthews 1999), may make it hard to find a consistent picture.
6 Acknowledgments
The results reported here are based on observations obtained with XMM-Newton, an ESA science mission with instruments and contributions directly funded by ESA Member States and the USA (NASA). The authors wish to thank the SOC and SSC teams for organising the XMM-Newton observations and initial data reduction. KAP is pleased to acknowledge a Leverhulme Trust Emeritus Fellowship. BJW and GDS are grateful for the financial support of XMM-Newton GO grant: NNG04GD27G.
References
- (1) Antonucci, R., 1993, ARAA, 31 473
- (2) Alonso-Herrero, A., Ward, M.J. & Kotilainen, J.K., 1997, MNRAS, 288, 977
- (3) Arnaud K.A., 1996, ASP Conf. Series, 101, 17
- (4) Bauer, F. et al. 2004, AJ, 128, 2048
- (5) Comastri A., Setti G., Zamorani G., & Hasinger G. 1995, A&A, 296, 1
- (6) Comastri A., Fiore F., Vignali C., Matt G., Perola G.C. & La Franca F. 2001, MNRAS, 327, 781
- (7) Cutri R. et al. 2002, ASP Conf. Ser. 284, 127
- (8) Elvis, M.S. 2000, ApJ, 543, 63
- (9) Elvis M., Wilkes B. J., McDowell J. C., Green R. F., Bechtold J., Willner S. P., Cutri R., Oey M., S. & Polomski E., 1994, ApJS, 95, 1
- (10) Elvis, M., Schreier, E.J., Tonry, J., Davis, M. & Huchra, J.P., 1981, ApJ, 246, 20
- (11) Fiore, F., et al. 2003, AA, 409, 79
- (12) Fiore, F., et al., 2001, MNRAS, 327, 771
- (13) Francis, P. P.J., Nelson, B.O. & Cutri, R.M., 2004, AJ, 127, 646
- (14) Fruscione, A., & Siemiginowska, A., 2000, Chandra News #7, 4
- (15) Gilli R., Salvati M. & Hasinger G., 2001, A&A, 366, 407
- (16) Glikman, E., Gregg, M.D., Lacy, M., Helfand, D.J., Becker, R.H. & White, R.L., 2004, ApJ, 607, 60
- (17) Green, P.G., Aldcroft, T.L., Mathur, S., Wilkes, B.J. & Elvis, M., ApJ, 558, 109
- (18) Huchra J. & Burg R., 1992, ApJ, 393, 90
- (19) Kim, D., Wilkes, B.J., Green, P.J., et al. 2004, ApJ, 600, 59
- (20) Konigl, A, & Kartje, J.F., 1994, ApJ, 434, 446
- (21) Laor, A., et al. 1997, ApJ, 477, 93
- (22) Lehmann I., et al., 2000, A&A, 354, 35
- (23) Magdziarz, P. & Zdziarski, A.A., 1995, MNRAS, 273, 837
- (24) Mainieri, V., Bergeron, J., Hasinger, G., Lehmann, I., Rosati, P., Schmidt, M., Szokoly, G., & Della Cecca, R., 2002, A&A, 393, 425
- (25) Maiolino R., Rieke G.H., 1995, ApJ, 454, 95
- (26) Masci F.J., Drinkwater M.J., Webster R.L. 1999, ApJ, 510, 703
- (27) Mulchaey, J.S., Koratkar, A., Ward, M.J., Wilson, A.S., Whittle, M., Antonucci, R.R.J., Kinney, A.L. & Hurt, T., 1994, ApJ., 436, 586
- (28) Murray, N. & Chiang, J., 1995, ApJ, 454, 105
- (29) Nandra, K. & Pounds, K.A., 1994, MNRAS, 268, 405
- (30) Nousek J.A., et al., 1998, Proc. SPIE, 3444, 225
- (31) Neugebauer, G., & Matthews, K., 1999, AJ, 118, 35
- (32) Perola, G.C. et al. 2004, AA, 421, 491
- (33) Pounds K.A., Wilkes B.J., Page, K.L., 2005, MNRAS, in preparation
- (34) Pounds, K.A., Reeves, J.N., King, A.R. & Page, K.L., 2004, MNRAS, 350, 10
- (35) Pounds, K.A., Reeves, J.N., Page, K.L. & O’Brien, P.T., 2004, ApJ, 605, 670
- (36) Risaliti, G., Maiolino, R. & Salvati, M, 1999, ApJ, 522, 157
- (37) Schmidt, G.D., Smith, P.S., Foltz, C.B. & Hines, D.C., 2002, ApJ, 578, L99
- (38) Silverman, J.D., et al. 2005, ApJ, 618, 213
- (39) Smith, P. S., Schmidt, G. D., Hines, D. C. & Foltz, C. B. 2003, ApJ, 593, 676
- (40) Smith P.S., Schmidt G.D., Hines D.C., Cutri R.M. & Nelson B.O. 2002, ApJ, 569, 23
- (41) Smith P.S., Schmidt G.D., Hines D.C., Cutri R.M. & Nelson B.O. 2001, ApJL, 545, L19
- (42) Soifer B.T. et al., 1984, ApJ, 278, L71
- (43) Strüder L.et al., 2001, A&A, 365, L18
- (44) Treister et al. 2005, ApJ, 621, 104
- (45) Turner M.J.L. et al., 2001, A&A, 365, L27
- (46) Turner, T.J., George, I.M., Nandra, K. & Mushotzky, R.F., 1998, ApJ, 493, 91
- (47) Turner, T.J., George, I.M., Nandra, K. & Mushotzky, R.F., 1997a, ApJ, 488, 164
- (48) Turner, T.J., George, I.M., Nandra, K. & Mushotzky, R.F., 1997b, ApJS, 113, 23
- (49) Wilkes B.J., Schmidt G.D., Cutri R.M., Ghosh H., Hines D.C., Nelson B. Smith P.S., 2002, ApJL, 564, L65
- (50) Wilkes, B.J., et al. 2004, in preparation
- (51) Worsley, M.A., Fabian, A.C., Barcons, X., Mateos, S., Hasinger, G. & Brunner, H., 2004, MNRAS 352, L28
| pn camera | MOS cameras | ||||||
|---|---|---|---|---|---|---|---|
| 2MASS J | filter | exposure (s) | counts | filter | exposure (s) | counts | |
| 09184860+2117170 | thin | 5439 | 28860 | thin | 16098 | 24132 | |
| 10514425+3539306 | thin | 3044 | 112661 | medium | 10645 | 149043 | |
| 13000534+1632149 | medium | 1184 | 28459 | medium | 5355 | 39632 | |
| 14025120+2631175 | medium | 1699 | 164851 | medium | 4937 | 113644 | |
| 23444958+1221432 | thin | 4444 | 84473 | thin | 13164 | 79038 | |
| 2MASS J | Redshift | int | HR | JKS | BR | Class2 | %P3 | |
|---|---|---|---|---|---|---|---|---|
| /cm-2 | (DSS) | |||||||
| 0918 | 0.149 | 1.90.5 | 2 | 2.23.04 | 2.1 | 1.5 | 10.010.07 | |
| 1051 | 0.158 | 1.60.2 | 5.6 | 2.08.07 | 2.6 | 1.9 | 0.540.29 | |
| 1300 | 0.080 | 1.50.8 | 1810 | 2.17.05 | 3.1 | 2.0 | 9.500.07 | |
| 1402 | 0.187 | 2.00.4 | 2.08.05 | 0.6 | 1.0 | 0.210.21 | ||
| 2344 | 0.199 | 2.00.4 | 42 | 2.00.06 | 1.3 | 1.0 | 1.010.24 |
1: Power law plus absorption fit over 0.5–8 keV band
2: Optical class: 1.02.0, based on the ratio of narrow to broad emission lines
3: Optical % polarisation, Smith et al. 2002, 2003
| 2M | (2-10) | (0.310, pn) | Line | /dof | ||
|---|---|---|---|---|---|---|
| /cm-2 | energy(keV) | flux1 | ||||
| 0918 | 1.260.39 | 1.650.332 | 0.440.13 | 13/20 | ||
| 1051 | 1.670.11 | 1.790.08 | 7.20.7 | - | - | 103/115 |
| 1300 | 1.160.16 | 1.740.26 | 295 | 6.2 | 11/24 | |
| 1402 | 1.530.16 | 1.540.07 | 0.440.10 | 110/102 | ||
| 2344 | 1.700.16 | 1.860.12 | 6.52.6 | 0.640.05 | 65/69 | |
1: photon cm-2 s-1
2: The best fit model includes a cold reflection component: R and EW (FeK) keV (at 6.4 keV)
3: 90% upper limit. When absorption at this level is included, the best fit power law becomes: (2M0918), (2M1402).
| 2M | Flux(0.3-1 keV)1 | Flux(1-2 keV)1 | Flux(2-10 keV)1 | L(0.3-10 keV)2 | L |
|---|---|---|---|---|---|
| / | / | / | / | / | |
| 0918 | 0.41 | 0.32 | 0.19 | 0.14 | 0.6 |
| 1051 | 0.5 | 4 | 2.0 | 2.3 | - |
| 1300 | 0.14 | 1.45 | 2.35 | 0.68 | - |
| 1402 | 7.5 | 4.7 | 1.9 | 2.6 | 16 |
| 2344 | 0.9 | 1.4 | 0.51 | 0.79 | 2.9 |
1: erg cm-2 s-1
2: Absorption-corrected luminosity in units of erg s-1
3: Absorption-corrected luminosity of the soft excess component in erg s-1