Origin of the Galactic ridge X-ray emission
We analyze a map of the Galactic ridge X-ray emission (GRXE) constructed in the 3–20 keV energy band from RXTE/PCA scan and slew observations. We show that the GRXE intensity closely follows the Galactic near-infrared surface brightness and thus traces the Galactic stellar mass distribution. The GRXE consists of two spatial components which can be identified with the bulge/bar and the disk of the Galaxy. The parameters of these components determined from X-ray data are compatible with those derived from near-infrared data. The inferred ratio of X-ray to near-infrared surface brightness ( erg s-1 cm-2 deg-2)/(MJy/sr)=, and the ratio of X-ray to near-infrared luminosity . The corresponding ratio of the 3–20 keV luminosity to the stellar mass is erg s-1, which agrees within the uncertainties with the cumulative emissivity per unit stellar mass of point X-ray sources in the Solar neighborhood, determined in an accompanying paper (Sazonov et al.). This suggests that the bulk of the GRXE is composed of weak X-ray sources, mostly cataclysmic variables and coronally active binaries. The fractional contributions of these classes of sources to the total X-ray emissivity determined from the Solar neighborhood data can also explain the GRXE energy spectrum. Based on the luminosity function of local X-ray sources we predict that in order to resolve 90% of the GRXE into discrete sources a sensitivity limit of erg s-1 cm-2 (2–10 keV) will need to be reached in future observations.
Key Words.:
stars: binaries: general – Galaxy: bulge – Galaxy: disk – X-rays: general – X-rays: stars1 Introduction
There are two major large-scale extended features in the X-ray sky (above 2 keV): the almost uniform cosmic X-ray background (CXB, Giacconi et al. 1962) and an emisison concentrated toward the Galactic plane – the Galactic ridge X-ray emission (GRXE, see e.g. Worrall et al. 1982). While over the last two decades it has been firmly established that the CXB is a superposition of a large number of discrete extragalactic sources (namely active galactic nuclei, see e.g. Giacconi et al. 2002), the origin of the GRXE remains unexplained.
Exploration of the GRXE by different observatories has revealed that it is concentrated near the inner Galactic disk, extending tens of degrees in longitude and a few degrees in latitude (Cooke, Griffiths, & Pounds 1970; Worrall et al. 1982; Warwick et al. 1985, 1988; Yamauchi et al. 1990), and likely has a central bulge-like component (Yamauchi & Koyama 1993; Revnivtsev 2003). The energy spectrum of the GRXE contains a number of emission lines of highly ionized heavy elements, indicating that the emission should be thermal with a temperature of up to 5–10 keV (Koyama et al. 1986, 1989; Tanaka 2002; Muno et al. 2004). The total GRXE luminosity has been estimated at 1–2 erg s-1 (Yamauchi & Koyama 1993; Valinia & Marshall 1998).

The GRXE has been detected at least up to 20–25 keV energies (Valinia & Marshall 1998; Revnivtsev 2003), and its spectrum in the 3–20 keV range consists of a continuum, which can be approximated by a power law of photon index , and powerful lines at 6–7 keV energies. Also a detection of GRXE at energies 40 keV (at Galactic longitude ) was reported (e.g. Skibo et al. 1997; Valinia & Marshall 1998), but it now appears that those CGRO/OSSE measurements were strongly contaminated by a few unresolved sources, including active galactic nucleus IGR J21247+5058 recently discovered by the INTEGRAL observatory (Masetti et al. 2004). The IBIS telescope aboard INTEGRAL, capable of resolving point-like sources with flux few erg s-1 cm-2 in crouded regions, has not detected the GRXE at energies above 40 keV (Lebrun et al. 2004; Terrier et al. 2004).
Soon after discovery of the GRXE it was proposed that it might consist of a large number of weak Galactic X-ray point sources, e.g. quiescent low-mass and high-mass X-ray binaries, cataclysmic variables, coronally active binaries etc (Worrall et al. 1982; Worrall & Marshall 1983; Koyama et al. 1986; Ottmann & Schmitt 1992; Mukai & Shiokawa 1993). However, it was not possible to draw a solid conclusion due to lack of detailed information about the space densities and X-ray luminosity distributions of these classes of X-ray sources.
Unless the GRXE is truly diffuse emission, it should eventually be possible to resolve it into a finite number of discrete sources. As the sensitivity of X-ray telescopes has been increasing, a progressively higher fraction of the GRXE has been resolved (Worrall et al. 1982; Warwick et al. 1985; Sugizaki et al. 2001). However, even the deepest observations of Galactic plane regions by the currently operating Chandra and XMM-Newton observatories, in which point-source detection sensitivities erg s-1 cm-2 (Ebisawa et al. 2001; Hands et al. 2004; Ebisawa et al. 2005) were achieved, resolved not more than 10–15% of the GRXE. This was regarded as a strong indication of the GRXE being truly diffuse.
However, the hypothesis of diffuse origin of the GRXE meets strong difficulties (e.g. Koyama et al. 1986; Sunyaev, Markevitch, & Pavlinsky 1993; Tanaka, Miyaji, & Hasinger 1999; Tanaka 2002). The main problem is that the apparently thermal spectrum of the GRXE implies that the emitting plasma is so hot (5–10 keV) that it should be outflowing from the Galactic plane. A large energy supply is then required to constantly replenish the outflowing plasma.
Resolving the GRXE is additionally complicated by the fact that at fluxes near the present-day sensitivity limit ( erg s-1 cm-2) extragalactic sources outnumber Galactic ones even in the Galactic plane (e.g. Ebisawa et al. 2005). Since identification of weak sources detected in deep X-ray surveys of the Galactic plane is usually problematic and the CXB varies significantly on sub-degree angular scales, so far it has only been possible to place upper limits on the fraction of the GRXE resolved into Galactic X-ray sources (as mentioned above).
The only place where Galactic sources dominate over extragalactic ones is the inner 10′ of the Galaxy (Muno et al. 2003), and Chandra has resolved up to 30% of the “hard diffuse” emission in certain parts of this region (Muno et al. 2004, region “Close” in this paper). Moreover, the flux-number distribution of Galactic X-ray sources detected in this Galactic Center survey shows no cutoff down to the Chandra detection limit, implying that at least an order of magnitude deeper observations will be needed to resolve the bulk of the hard X-ray emission from the Galactic Center if the source flux-number distribution continues with the same slope to lower fluxes than presently accessible.
It is therefore worth considering alternative ways to solve the problem of the GRXE origin, in particular via studying its spatial distribution. The distribution of the GRXE over the sky is still poorly known, mainly because of its large extent (approximately ) and low surface brightness (few erg s-1 cm-2 deg-2). The investigation of the GRXE in the HEAO-1/A2 experiment (e.g. Iwan et al. 1982; Worrall et al. 1982) was significantly hampered by point source confusion, whereas instruments with much better spatial resolution were not able to cover a sufficiently large solid angle of the sky (e.g. Sugizaki et al. 2001; Hands et al. 2004).
In this paper we present a brightness distribution of the GRXE measured in the 3–20 keV energy band by the RXTE/PCA instrument and show that this distribution closely follows the near-infrared brightness of the Galaxy, known to be a good tracer of the stellar mass distribution. We further compare the inferred Galactic ridge X-ray emissivity per unit stellar mass with the cumulative emissivity of point X-ray sources in the Solar neighborhood, determined by Sazonov et al. (2005), and argue that the bulk of the GRXE is likely composed of weak discrete sources of known types.
2 RXTE observations and analysis
The best instrument so far for large-scale mapping of the X-ray (above 2 keV) sky is the PCA spectrometer aboard the RXTE observatory (Bradt et al. 1993). It combines a large effective area ( cm2 at 6 keV) and a moderate field of view ( radius). The latter enables both to achieve a good coverage of the sky in the course of the mission (as compared to focusing instruments) and to alleviate the source confusion problem (as compared to X-ray collimators with larger fields of view). Over its 10-year lifetime RXTE/PCA has performed a large number of scan and slew observations over the whole sky, and we previously made use of these observations to catalog X-ray sources detected at high Galactic latitudes (Revnivtsev et al. 2004; Sazonov & Revnivtsev 2004) and to study the CXB (Revnivtsev et al. 2003). We now take advantage of the good coverage of the Galactic plane region by RXTE/PCA to study the GRXE.
We use the same set of observations and apply the same analysis as in Revnivtsev et al. (2004). Throughout the paper we will use only data from the first layers of all PCA detectors (PCUs) in the 3–20 keV energy band. The net exposure time of the utilized observations normalized to the single PCU effective area (1300 cm2) is approximately 29 Ms.
2.1 Flux measurement uncertainties
Apart from statistical uncertainties (photon noise), PCA measurements of X-ray flux are subject to systematical uncertainties. The current version of the RXTE/PCA software (LHEASOFT 5.2) enables an accuracy of background (instrumental plus the CXB flux averaged over the whole sky) subtraction of cnts/s/PCU/beam in the 3–20 keV energy band, which corresponds to erg s-1 cm-2 deg-2 for a Crab-like spectrum (e.g. Markwardt et al. 2002).
Another factor that needs to be taken into account in studying the GRXE (with subtracted contribution of bright point sources) is small-scale variations of the CXB intensity (mainly due to unresolved extragalactic sources within a 1-deg2 field of view of the PCA), which introduces an uncertainty of erg s-1 cm-2 deg-2 (3–20 keV) in measuring the X-ray surface brightness in a given direction (Revnivtsev et al. 2003). Note however that for most of the sky regions studied here this uncertainty does not exceed statistical errors.
Almost everywhere in the Galaxy, except in the very central regions where we practically cannot study the GRXE because of high concentration of bright point sources, the interstellar gas column density does not exceed atoms cm-2. Photoabsorption in this gas attenuates the GRXE flux at 3–20 keV by less than 5%. We neglect this small effect in the subsequent analysis.
3 Map of the GRXE
In Fig. 1 we present an X-ray intensity map of the sky around the Galactic plane convolved with the response of the PCA collimator (triangular shape with a radius , see Revnivtsev et al. 2003). The contour levels on this map are logarithmically spaced with a factor of 1.4, and the lowest shown level corresponds to an X-ray intensity erg s-1 cm-2 deg-2.
The map clearly exposes many bright point-like sources and an underlying unresolved emission – the GRXE. Henceforth we reserve the term ”GRXE” to describe Galactic X-ray emission which cannot be resolved into discrete sources with flux higher than erg s-1 cm-2. We note that the exact value of the limiting flux is unimportant unless it is higher than erg s-1 cm-2 (Sugizaki et al. 2001; Hands et al. 2004). This is explained by the fact that the density of sources with erg s-1 cm-2 is less than 1 deg-2 almost everywhere except in the central degree of the Galaxy.
The GRXE was given its name because it was originally detected as a prominent narrow ( 1–2∘) band of unresolved emission along the Galactic plane (e.g. Bleach et al. 1972; Worrall et al. 1982). However, it has since then become more evident that the unresolved X-ray emission of the Galaxy contains both a disk-like and a bulge-like component (Yamauchi & Koyama 1993; Revnivtsev 2003). The exponential scale height of the disk component of the GRXE is (Worrall et al. 1982; Warwick et al. 1985; Yamauchi & Koyama 1993), whereas it is much larger for the Galactic bulge – up to 3–5∘(Yamauchi & Koyama 1993; Revnivtsev 2003). Both components can now be clearly seen on the RXTE map shown in Fig. 1.
We will now separately consider the bulge and disk components of the GRXE.
3.1 Galactic bulge
The observed intensity distribution of the GRXE in the Galactic Center region is strongly affected by the bright point sources located there. Therefore, in order to study the underlying GRXE we should mask out bright point sources. To this end we filtered out -radius regions around point sources with flux higher then cnts/s/PCU/beam erg s-1 cm-2 (this flux conversion corresponds to the measured GRXE spectrum, Revnivtsev 2003). The catalog of detected point sources will be published elsewhere. This flux limit corresponds to a source luminosity erg s-1 for a Galactic Center distance of 8.5 kpc.
Since the number density of sources with flux higher than cnts/s/PCU/beam is quite high, we have practically no data left at upon applying the above filtering procedure (similar to the analysis of Revnivtsev 2003). At higher latitudes the number density of bright point sources drops significantly (e.g. Grimm, Gilfanov, & Sunyaev 2002) but the applied mask still severely reduces the coverage of the bulge.
Relatively bright sources ( erg s-1, or erg s-1 cm-2) below our filtering threshold might lead to significant deviations of the observed X-ray intensity map from the actual GRXE brightness distribution. However, as was already mentioned, the density of such sources is less than 1 deg-2 (except in the central degree of the Galaxy), while the typical intensity of the GRXE is erg s-1 cm-2 deg-2 (e.g. Sugizaki et al. 2001). We thus expect that our filtering criterion enables recovering the surface brightness distribution of the GRXE with approximately 10% accuracy.
In order to construct an intensity profile of the bulge component of the GRXE along the Galactic plane we selected latitudes , where the disk component of the GRXE is weak while the bulge component is still relatively bright. Also an intensity profile of the bulge perpendicular to the Galactic plane was constructed from observations at excluding . The resulting profiles are shown in Fig. 2 and Fig. 3, respectively. The shaded regions indicate the measurement uncertainties including the 10% systematics described above. One can see that the GRXE intensity profile is relatively symmetric with respect to the Galactic plane but is not symmetric along the plane with respect to .


It is natural to compare the inferred morphology of the GRXE bulge with the Galactic stellar bulge/bar (Bahcall & Soneira 1980; Blitz & Spergel 1991; Weiland et al. 1994; Dwek et al. 1995). For this purpose we use the analytic model of the bulge/bar stellar volume emissivity developed by Dwek et al. (1995), namely model G3 in this paper. This model is derived from the near-infrared surface brightness distribution of the Galaxy measured by COBE/DIRBE, which is believed to be a very good tracer of the stellar mass distribution.
Let us parameterize the volume emissivity of the bulge component of the GRXE similarly as was done for the stellar bar by Dwek et al. (1995). The observed intensity of the GRXE is proportional to the line-of-sight integral of the bulge/bar volume emissivity predicted by the model. Specifically, the X-ray flux measured within a solid angle is given by
The volume emissivity of the bar is given by
where
The major axes and of the bar are assumed to lie in the Galactic plane and the axis is inclined by an angle to our line of sight.
Just by varying the normalization of the G3 model of Dwek et al. (1995) we obtain fairly good fits to the measured GRXE intensity profiles, with reduced . This implies that the longitudinal asymmetry clearly evident in Fig. 2 is a natural observational consequence of the (triaxial ellipsoid) bar inclined to our line of sight. The near end of the bar lies in the first Galactic quadrant.
| Parameter | Value |
|---|---|
| Bulge/bar | |
| , ∘ | |
| ,kpc | |
| ,kpc | |
| ,kpc | |
| , ergs s-1 | |
| /dof | 1.24 |
| Disk | |
| 2.5(fixed) | |
| ,pc | |
| ,kpc | |
| , ergs s-1 | |
| /dof | 0.93 |
-
∗ – without bright point sources
Allowing variations of the parameters we fitted the measured GRXE intensity profiles shown in Fig. 2 and Fig. 3 in the ranges and , respectively. The derived best-fit parameters are presented in Table 1. These values agree very well with the parameters of the stellar bar obtained by Dwek et al. (1995). We show the best-fit longitudinal and latitudinal intensity profiles in Fig. 2 and Fig. 3.
It is necessary to note that the determined value of the total X-ray luminosity of the bulge given in Table 1 should be regarded with caution because our analysis did not involve detailed modelling of the innermost (cuspy) region of the bulge.
3.2 Galactic disk
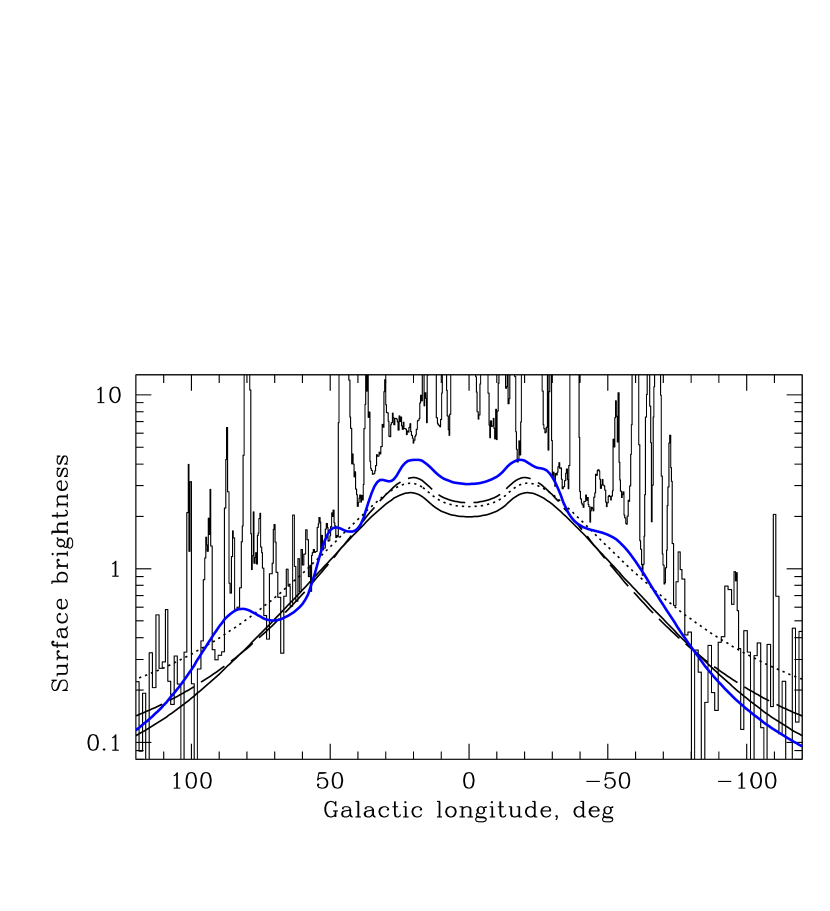
The severe confusion problem in the Galactic plane region prevents us from constructing an intensity profile of the GRXE along the Galactic plane with subtracted contribution of bright point-like sources. We can however construct a combined intensity distribution of the GRXE and bright point sources along the Galactic plane (within ), as shown in Fig. 4. On this profile the contributions of discrete sources are seen as rapid (on angular scales ) variations of the intensity. The GRXE manifests itself as an underlying smooth component. The statistical uncertainty does not exceed erg s-1 cm-2 deg-2 almost everywhere in the Galactic plane.
Despite the strong contamination by bright discrete sources we can obtain important information about the properties of the GRXE disk from the longitudinal intensity profile shown in Fig. 4.
3.2.1 Longitudinal extent
Following Bahcall & Soneira (1980); Kent, Dame, & Fazio (1991); Freudenreich (1996); Dehnen & Binney (1998), we can parameterize the volume emissivity in the disk by two exponentials (of Galactocentric distance and height above the disk plane ) with a central depression (parameter ). At radii the volume emissivity is given by
| (1) |
while at .
The very limited information that we have about the emissivity of the disk near the Galactic Center (due to bright source contamination) does now allow us to determine the parameter . We hence fixed it at the value kpc, which is approximately the size of the central stellar disk depression supposedly induced by the bulge/bar of approximately the same size (e.g. Freudenreich 1996, 1998). We note that a central disk depression within approximately kpc is also evident on the Galactic plane map of 6.7 keV line emission obtained by Yamauchi & Koyama (1993), which is much less affected by bright point sources than the GRXE continuum map obtained by RXTE.
In Fig. 4 we show a number of modelled disk intensity profiles: a) an infinite disk with an exponential scale length kpc (, dotted line), b) a disk with kpc truncated at kpc (solid line) and c) an infinite disk with kpc (dashed line). Comparison with the measured surface brightness profile demonstrates that the first model provides the worst fit: it predicts too much emission at large distances from the Galactic Center. Both the infinite disk with kpc and the finite disk with kpc and kpc match the observed profile much better. In the subsequent analysis we will assume that the GRXE disk has a scale length of kpc and is truncated at kpc. These values are very close to the parameters of the Galactic stellar disk (e.g. Freudenreich 1996; Binney, Gerhard, & Spergel 1997; Freudenreich 1998).
The GRXE is not detectable with RXTE/PCA at longitudes , with an upper limit erg s-1 cm-2 deg-2 for any line of sight. We point out that measurement of the (weak) ridge emission at these longitudes by an instrument with poor angular resolution can be strongly affected by the presence of relatively bright discrete sources. For example, the published CGRO/OSSE measurement of GRXE at (Skibo et al. 1997) is possibly dominated by emission from the active galactic nucleus IGR J21247+5058 recently discovered by INTEGRAL (Masetti et al. 2004).
3.2.2 Possible imprint of the disk spiral structure
There are indications of the GRXE being asymmetric with respect to the Galactic Center. In particular the ridge emission appears stronger at than at (see Fig. 1 and Fig. 4). This asymmetry is probably caused by a significant enhancement of the GRXE in spiral arms with respect to inter-arm regions. Such arm-interarm contrast of the volume emissivity is seen on near-infrared maps of stellar disks in spiral galaxies (e.g. Gonzalez & Graham 1996; Drimmel & Spergel 2001). The observed enhancement of the GRXE in the direction of could then be a signature of the tangent to the Crux spiral arm. In Fig. 4 we show an example of GRXE longitudinal intensity profile corresponding to a Galactic disk with spiral structure (thick solid line). For this model we assumed a simple four-logarithmic-arms spiral structure (e.g. Vallee 1995) with a pitch angle of . The width of the spiral arms was assumed to be 600 pc, and the arm-interarm volume emissivity contrast was assumed to be 2.0.
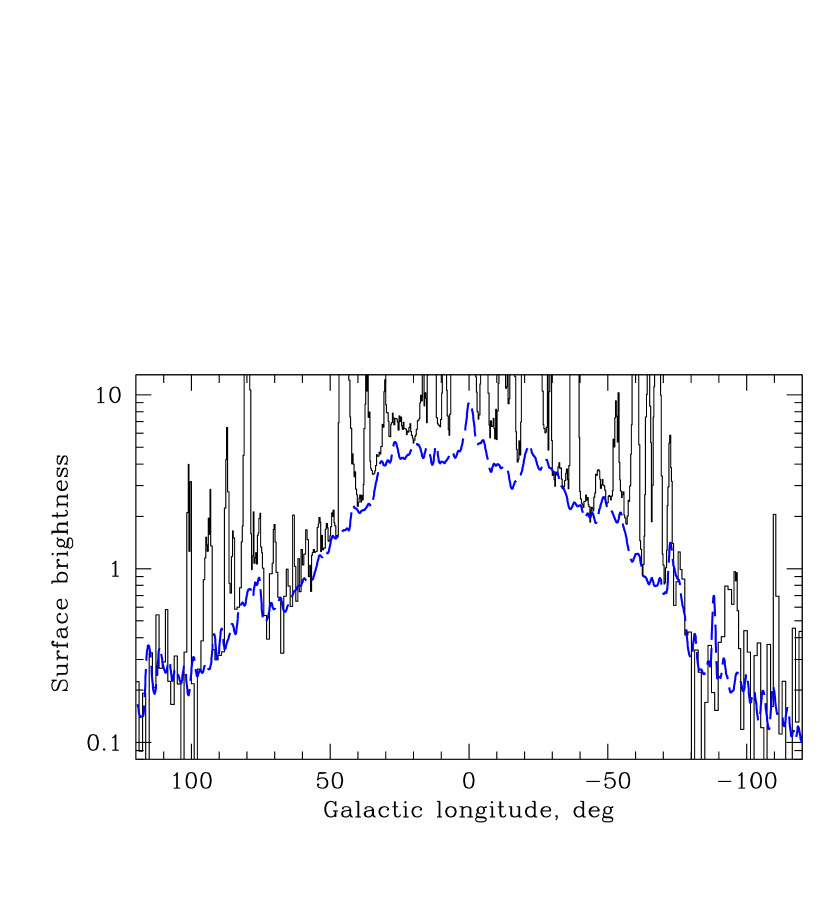
Summarizing all of the above we can conclude that the intensity of the disk component of the GRXE follows the near-infrared brightness distribution of the Galaxy. To strengthen this conclusion we present in Fig. 4b the near-infrared brightness profile of the Galaxy at obtained by COBE/DIRBE (zodi-subtracted mission average map provided by the LAMBDA archive of the Goddard Space Flight Center, http://lambda.gsfc.nasa.gov). We have chosen the spectral band centered on 3.5m, for which the interstellar extinction is fairly small, and made the simplest correction for the extinction using the map of interstellar HI gas of Dickey & Lockman (1990) and extinction law by Rieke & Lebofsky (1985). The infrared profile was additionally convolved with the PCA collimator response. A very good correspondence between the GRXE and near-infrared intensity profiles is apparent.
3.2.3 Vertical extent
As was already mentioned, our study of the GRXE in the Galactic plane strongly suffers from the high density of bright X-ray sources and limited angular resolution of RXTE/PCA. Filtering out discrete sources in the Galactic plane greatly reduces the amount of data at . Only a few regions are suitable for studying the intensity profile of the GRXE perpendicular to the Galactic plane, with evidently the best place being the region around . At this longitude there are no sources brighter than erg s-1 cm-2 (Sugizaki et al. 2001) at and no sources brighter than erg s-1 cm-2 away from the plane (Molkov et al. 2004). We present the vertical profile of the GRXE intensity at (within a stripe of width ) in Fig. 5.

One of the most interesting features of the vertical profile is the displacement of its peak from . The best-fit peak position is ( statistical uncertainty). Using available scans across known persistent sources, including supernova remnants, we estimated that the systematic uncertainty in measuring is smaller than . We therefore conclude that the observed displacement is real. A similar shift of the brightness peak was previously observed in a near-infrared spectral band (e.g. Djorgovski & Sosin 1989; Freudenreich et al. 1994; Porcel, Battaner, & Jimenez-Vicente 1997), and it was suggested to arise from the elevation of the Sun above the disk plane.
By fitting to the measured intensity profile at the disk model given by equation (1), with the Sun elevation above the Galactic plane as an additional parameter (), we obtain the best fit shown in Fig. 5 by a solid line. The best-fit parameters are presented in Table 1.
The measured vertical profile of the X-ray disk volume emissivity is very similar to that of the stellar disk (see e.g. Binney, Gerhard, & Spergel 1997). To better illustrate this we show in Fig. 5 a vertical profile of the near-infrared brightness of the Galactic disk measured at the same Galactic longitude at wavelength 3.5 m (extinction corrected). The COBE/DIRBE infrared map was convolved with the PCA collimator response. The agreement with the X-ray intensity profile is excellent.
4 Summary of the GRXE map
Below we summarize the findings of the previous two sections.
-
1.
The GRXE consists of two major components – a disk and a bulge.
-
2.
The bulge/bar component of the GRXE can be well described by a triaxial ellipsoid similar to that used for description of the Galactic stellar bar (Dwek et al. 1995). The best-fit parameters of the GRXE bulge/bar are fully compatible with those of the stellar bar.
-
3.
The vertical intensity profile of the disk component of the GRXE at exhibits a significant offset with respect to . This offset is compatible with that observed for the Galactic near-infrared (e.g. 3.5m) brightness distribution and can be explained by the elevation of the Sun above the Galactic plane by pc.
-
4.
The intensity profile of the disk component of the GRXE at within can be described by an exponent with a scale height kpc, which is compatible with the near-infrared brightness (i.e stellar mass) distribution of the disk (e.g. Binney, Gerhard, & Spergel 1997; Dehnen & Binney 1998). Further away from the Galactic plane where stellar near-infrared emission is still visible (e.g. Freudenreich 1996), the RXTE/PCA sensitivity is not sufficient to detect the ridge emission.
-
5.
The longitudinal profile of the GRXE intensity is compatible with the profile of near-infrared brightness of the Galaxy. It can be approximated by an infinite exponential disk with a scale length kpc or by a finite disk with a scale length kpc and an outer boundary at kpc. The inner stellar disk radius kpc is compatible with our data but cannot be constrained by these data.
-
6.
There are indications of asymmetry of the GRXE distribution in the Galactic plane with respect to . We propose that this asymmetry might be caused by the Galactic spiral structure. If this is the case, we expect an arm-interarm contrast of the GRXE disk volume emissivity of 2–3, as for the near-infrared surface brightness of stellar disks in spiral galaxies. The current observations do not allow us to place tight constraints on the suggested spiral structure of the GRXE.
-
7.
The integral luminosities of the bulge and disk in the 3–20 keV energy band are erg s-1 and erg s-1, respectively. The disk-to-bulge luminosity ratio . This value agrees with the disk-to-bulge stellar mass ratio, indicating that the GRXE emissivitiy per unit mass is similar in the disk and in the bulge. We note however that a precise determination of the luminosities of the disk and bulge components as well as of their ratio would require an accurate modelling of the disk component across the Galaxy and of the bulge component near the Galactic Center, and such detailed modelling is not possible with RXTE/PCA data.
Based on all these observational facts we can conclude that the GRXE surface brightness (at 3–20 keV) closely follows the near-infrared brightness of the Galaxy and thus the Galactic stellar mass distribution.
To calculate the ratio of X-ray luminosity to stellar mass it is preferable to use the bulge/bar component of the GRXE, since it is explored with RXTE/PCA in more detail compared to the disk. Assuming a bulge/bar stellar mass of 1–1.3 (Dwek et al. 1995) we find that the ratio of X-ray luminosity to stellar mass is erg s-1. The ratio of X-ray (3–20 keV) to near-infrared luminosity at 3.5 m (in the COBE/DIRBE band with a width 1 m) is . The latter estimate is based on the near-infrared luminosity of the bulge/bar (Dwek et al. 1995).
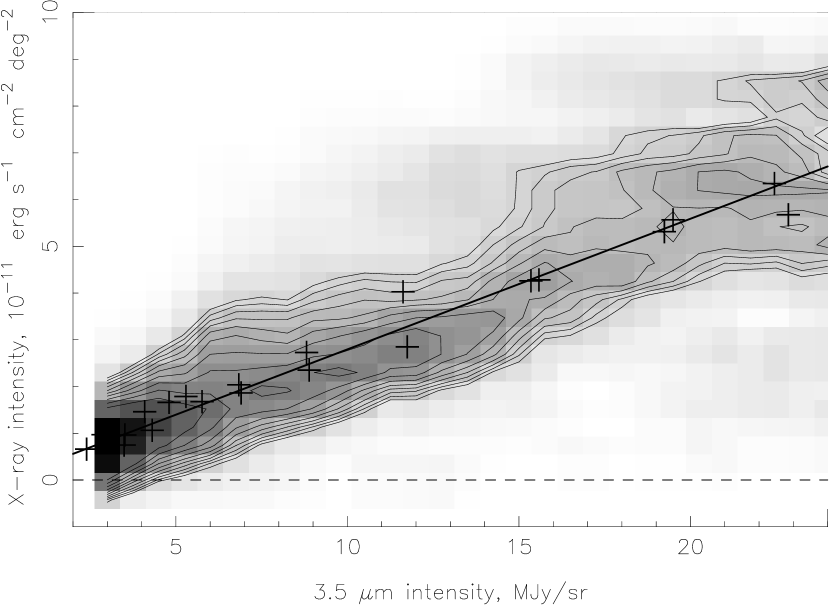

To illustrate the nearly perfect correlation between the GRXE and the Galactic near-infrared brightness we show in Fig. 6 a scatter plot of X-ray surface brightness vs. near-infrared brightness, constructed by dividing the sky into many small regions. To obtain this diagram, detected point X-ray sources were masked and the infrared sky map, having much better angular resolution than the X-ray map, was convolved with the response of the RXTE/PCA collimator. The scatter plot is shown as a gray scale map of density of measurements with superposed isodensity contours. The density is calculated within boxes of size (3MJy/sr) erg s-1 cm-2 deg-2). The observed stripe of enhanced density signifies the correlation of near-infrared and GRXE intensities. The vertical width of the stripe can be fully accounted for by the uncertainty of X-ray measurements.
The one-to-one correspondence between the GXRE map and the Galactic near-infrared brightness map permits to express GRXE intensity through infrared intensity at wavelength 3.5m for any line of sight: ( erg s-1 cm-2 deg-2)=(MJy/sr). This linear relation is derived by fitting the vertical slice of the GRXE at to the corresponding profile of near-infrared surface brightness (see Fig. 5) and is shown in Fig. 6 (solid line) together with individual measurements for the slice (crosses).
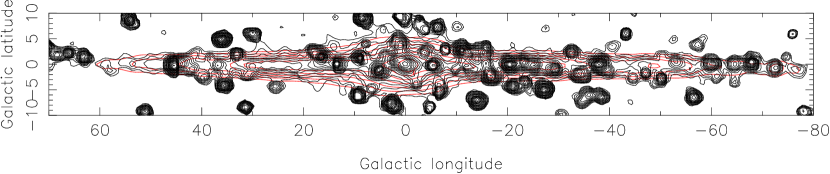
The above discussion suggests that the extinction corrected COBE/DIRBE near-infrared (3.5m) map of the sky should be nearly identical to the GRXE map upon scaling by a factor ( erg s-1 cm-2 deg-2)/(MJy/sr)=0.26. Fig. 7 demonstrates that this is indeed the case. Subtracting the rescaled near-infrared map from the observed X-ray brightness map of the Galaxy (Fig. 7, upper panel) leaves only point-like X-ray sources (Fig. 7, lower panel).
5 Broad-band spectrum of the GRXE
The infrared brightness of the Galaxy sharply rises within 10′ of the Galactic Center (Sgr A∗) because of the so-called nuclear stellar cluster (e.g. Genzel & Townes 1987; Launhardt, Zylka, & Mezger 2002). We showed above that regardless of the origin of the GRXE its surface brightness traces the near-infared surface brightness. One may therefore anticipate a sharp rise of the GRXE in the inner 10′ of the Galaxy. Such an X-ray intensity spike has indeed been observed with Chandra (Muno et al. 2003) and it was demonstrated that the total X-ray flux from the inner 10′ of the Galaxy is not dominated by bright point sources (e.g. Muno et al. 2003; Neronov et al. 2005).
If observed by a hard X-ray telescope with moderate angular resolution, such as IBIS aboard INTEGRAL (angular resolution 12′, Winkler et al. 2003), the GRXE central cusp will be perceived as a point-like source in the Galactic Center. The total flux from this source, assuming that the ratio of the GRXE emissivity to the stellar mass () is the same as in the other parts of the Galaxy, will be determined by the total mass of the nuclear stellar cluster. The innermost 30 pc (corresponding to 12′ at the Galactic Center distance) of the Galaxy enclose of stars. This predicts a 3–20 keV luminosity of erg s-1.
If we further assume that the GRXE spectrum in the 3–60 keV range is a power law with a photon index (as measured in the 3–20 keV range for the bulge component of the GRXE, Revnivtsev 2003), we can roughly predict the hard X-ray luminosity (20–60 keV) of the GRXE from the central cusp: erg s-1. This proves to be only a factor of 2 less than the hard X-ray luminosity of the Galactic Center ”point source” measured by INTEGRAL/IBIS (Neronov et al. 2005; Belanger et al. 2005), which may be considered a good agreement in view of uncertainty concerning the mass of the nuclear stellar cluster and the solid angle subtended by the INTEGRAL source. This also leaves open the possibility that the GRXE from the nuclear region of the Galaxy, which is known to be peculiar in many respects, may be somewhat different from the rest of the Galaxy.
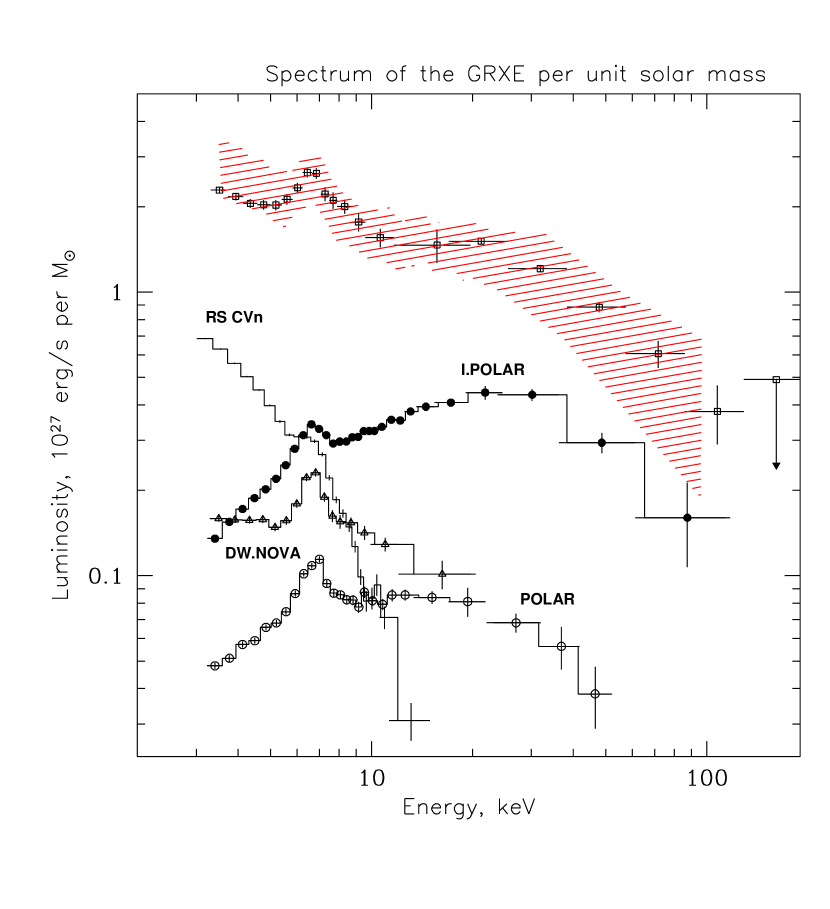
Given the good correspondence between the predicted hard X-ray flux from the central stellar cusp (based on the correlation between the GRXE and the Galactic stellar mass) and the measured flux from the Galactic Center hard X-ray source, it is interesting to attach the INTEGRAL/IBIS spectrum of the Galactic Center source at energies above 20 keV to the spectrum of the large-scale GRXE measured below 20 keV by RXTE/PCA. Both spectra need to be normalized to the same stellar mass. We show in Fig. 8 the resulting combined spectrum covering a broad energy range from 3 to keV. This spectrum may to a first approximation be regarded as a broad-band spectrum of the GRXE. However, one should keep in mind the possibility that the actual hard X-ray spectrum of the GRXE from regions away from the Galactic Center may prove somewhat different, since the Galactic Center is a peculiar region.
6 Galactic ridge X-ray emission as a superposition of point sources
In the previous sections we presented evidence that the GRXE volume emissivity traces the Galactic stellar density and estimated the ridge X-ray emissivity (3–20 keV) per unit stellar mass as erg s. It is interesting to compare this number with the cumulative X-ray emissivity of known classes of X-ray sources.
It is known (see e.g. Sazonov et al. 2005) that there is a clear tendency of spectral hardening with increasing source luminosity. Specifically, the weakest known X-ray sources ( erg s-1) are characterized by multi-temperature thermal spectra peaking in the soft X-ray regime (stellar coronal sources, see e.g. Schmitt et al. 1990; Güdel 2004), while the brightest sources contributing to the GRXE ( erg s-1) have very hard spectra with significant energy output above 10 keV (intermediate polars, see e.g. Suleimanov, Revnivtsev, & Ritter 2005). Therefore, it is important to consider the same energy band (3–20 keV) as was used in our GRXE study.
We have recently used the RXTE slew survey of the sky at high Galactic latitude to construct an X-ray (3–20 keV) luminosity function of nearby ( kpc) sources, covering a broad range in luminosity from coronally active stellar binaries to white dwarf binaries (Sazonov et al. 2005). Based on this luminosity function it is straightforward to estimate the contribution of point sources to the GRXE measured by RXTE in the same spectral band.
The total 3-20 keV emissivity of local Galactic X-ray sources per unit stellar mass erg s-1 or erg s-1 , if the contribution of young coronal stars is excluded or included, respectively (Sazonov et al. 2005). The bulk of the local X-ray emissivity is produced by coronally active late-type binaries and cataclysmic variables. These classes of sources represent relatively old stellar populations and their number density is thus expected to closely trace the overall stellar density in the Galaxy. On the other hand, the relative fraction of young stellar objects is expected to vary strongly from one Galactic region to another, so their locally estimated emissivity may not well represent the Galaxy as a whole. We find that the local X-ray emissivity, excluding the (small) contribution of young coronal stars, agrees within the uncertainties with the GRXE emissivity, erg s, found in this paper. This suggests that the bulk of the GRXE may be composed of weak X-ray sources of known classes, mostly coronally active binaries and cataclysmic variables.
If the GRXE is indeed superposed of known populations of X-ray sources, then its energy spectrum must be a sum of the spectra of these sources. In Fig. 8 we compare the measured spectrum of the GRXE with typical spectra of those classes of sources that are expected to contribute significantly to the GRXE. Also a composite spectrum is shown (the dashed region), which is a weighted sum of the individual spectra. The weights describing the fractional contributions of different types of sources were fixed at the values determined by Sazonov et al. (2005) for X-ray sources in the Solar neighbourhood, namely intermediate polars : polars : dwarf novae : coronally active binaries – 1:0.2:0.6:2.0. As can be seen in Fig. 8, the composite spectrum turns out to be very similar to the GRXE spectrum.
7 On the way of resolving the GRXE
It is impossible to place strong constraints on the contribution of truly diffuse emission to the GRXE based on the X-ray luminosity function of local sources. First, there remains significant uncertainty as concerns the local Galactic X-ray volume emissivity. But even if future dedicated survey missions like ROSITA (e.g Predehl et al 2003) will determine this quantity more accurately, there will still remain significant uncertainty owing to the fact that the locally determined unit-stellar-mass X-ray emissivity may represent other parts of the Galaxy only approximately.
It appears that the only possibility to tightly constrain the possible contribution of truly diffuse emission to the GRXE is to detect the weakest point sources at kpc distances and to subtract their contribution from the GRXE. In pursuing this goal, one will likely face the following observational challenges.
7.1 Surface brightness limit
Far away from the Galactic Center and the Galactic plane the GRXE is characterized by low surface brightness. It may be anticipated that below a certain intensity level the GRXE will be lost in the cosmic variance or small scale fluctuations of the CXB.
This implies that it should be difficult to study the GRXE in regions characterized by surface brightness less than erg s-1 cm-2 deg-2 (CXB intensity is erg s-1 cm-2 deg-2). Higher GRXE surface brightness is observed only in the Galactic plane and in the Galactic bulge/bar. The best observational target in this respect is the Galactic Center region, but there the confusion limit may become a problem.
7.2 Confusion limit
In regions of very high GRXE surface brightness (e.g. the Galactic Center region), the surface density of Galactic sources can be very high and observations may be hampered by the confusion limit. For example, observation with Chandra, with its excellent angular resolution (), of the Galactic Center region will become confusion limited if the surface density of sources increases by a factor of 40 (to sources arcmin-2) compared to published observations (Muno et al. 2003).
7.3 Sensitivity limit
The observational sensitivity should be aimed to enable the detection of sources contributing more than e.g. 80–90% of the total X-ray luminosity of discrete Galactic sources (excluding bright X-ray binaries). Using the cumulative luminosity function of Sazonov et al. (2005) we can estimate that sources with luminosities down to erg s-1 will need to be detected. For the Galactic Center region, where most sources dominating the total flux are located at the Galactic Center distance ( kpc), it will be necessary to achieve a sensitivity limit of erg s-1 cm-2, which is a factor of improvement over the current limit (Muno et al. 2003).
We can also assess the required sensitivity for a given Galactic plane region using our model of the Galaxy (section 3.2) and the luminosity function of Galactic X-ray sources (Sazonov et al. 2005). We use the Galactic plane region at as an example. The resulting cumulative number-flux function and cumulative X-ray surface brightness as a function of flux are presented in Fig. 9. These dependencies were calculated for the standard 2–10 keV band to faciliate comparison with X-ray missions such as Chandra and XMM-Newton. Note that the relative contributions of different classes of sources are sensitive to the choice of energy band. In particular, the contribution of coronally active binaries to the GRXE at 2–10 keV is expected to be more important compared to the 3–20 keV band (see e.g. Fig. 8). Also it should be noted that one should be careful while comparing the presented figure with CHANDRA results, because the effectively sensitive energy band of CHANDRA does not continue to energies higher than keV.


It follows from Fig. 9 that in order to resolve most of the GRXE into discrete sources and place tight constraints on the contribution of truly diffuse emission to the GRXE it is necessary to reach point source flux limits erg s-1 cm-2. Interestingly, such sensitivity is not unfeasible for Chandra (XMM-Newton will be strongly limited by confusion already at fluxes erg s-1 cm-2). Similar sensitivities were already achieved in deep surveys of extragalactic fields (e.g. Giacconi et al. 2002; Moretti et al. 2003). Moreover, the predicted number density of sources above the required flux limit ( deg-2, Fig. 9, upper panel), will not create a confusion problem for Chandra.
At higher energies ( keV) lower sensitivities are needed, erg s-1 cm-2. This follows from the fact that according to the picture presented here the dominant contribution to the GRXE at these energies likely comes from polars and intermediate polars with high luminosities ( erg s-1). The surface density of such sources will be deg-2. Both the required sensitivity and angular resolution should be achievable with the projected focusing hard X-ray telescopes, e.g. NuSTAR (e.g. Harrison et al. 2004).
8 Conclusions
-
•
In this paper we have shown that the 3–20 keV map of the GRXE closely follows the near-infrared (3.5 m) brightness distribution of the Galaxy and thus traces the Galactic stellar mass distribution.
-
•
The GRXE map reveals the presence of the Galactic bulge/bar in the inner 3–4 kpc. The parameters of the bar determined from the X-ray data are fully compatible with those obtained from near-infrared observations.
-
•
We demonstrated that the point-like source IGR J174562901 in the Galactic Center observed by INTEGRAL/IBIS is likely concentrated GRXE from the innermost . We used this fact to extend the GRXE energy spectrum up to 100 keV.
-
•
Comparison of the GRXE luminosity per unit stellar mass with the cumulative emissivity of X-ray sources in the Solar neighborhood suggests that the bulk of the GRXE is likely superposed of emission from weak Galactic X-ray sources, mostly cataclysmic variables and coronally active binaries.
-
•
The GRXE energy spectrum in the 3–100 keV range can be explained as a composition of spectra of different X-ray source classes weighted in accordance with their relative contributions to the local X-ray emissivity.
-
•
Based on the model of Galactic stellar mass distribution we predict that in order to resolve % of the GRXE in the 2–10 keV band into discrete sources, it will be necessary to achieve a flux limit erg s-1 cm-2. This sensitivity is within Chandra capabilities.
-
•
For the hard X-ray regime (20–100 keV) the requirement to sensitivity is much less strict, since the dominant contributors to the GRXE in this energy band are intermediate polars and polars with relatively high X-ray luminosities. The required flux limit erg s-1 cm-2 can be achieved by next-generation hard X-ray telescopes.
Acknowledgements.
Research has made use of data obtained from High Energy Astrophysics Science Archive Research Center Online Service, provided by the NASA/Goddard Space Flight Center. We acknowledge the use of the Legacy Archive for Microwave Background Data Analysis (LAMBDA). Support for LAMBDA is provided by the NASA Office of Space Science. MR thank Ralf Launhardt for his advices during the work with COBE/DIRBE data and Andrii Neronov for provided information about XMM-Newton results on the Galactic Center.References
- Bahcall & Soneira (1980) Bahcall J. N., Soneira R. M., 1980, ApJS, 44, 73
- Belanger et al. (2005) Belanger G., et al., 2005, astro, arXiv:astro-ph/0508128
- Binney, Gerhard, & Spergel (1997) Binney J., Gerhard O., Spergel D., 1997, MNRAS, 288, 365
- Bleach et al. (1972) Bleach R. D., Boldt E. A., Holt S. S., Schwartz D. A., Serlemitsos P. J., 1972, ApJ, 174, L101
- Blitz & Spergel (1991) Blitz L., Spergel D. N., 1991, ApJ, 379, 631
- Bradt et al. (1993) Bradt H., Rotshild R. & Swank J. 1993, Astron. Astrophys. Suppl. Ser. 97, 355
- Cooke, Griffiths, & Pounds (1970) Cooke B. A., Griffiths R. E., Pounds K. A., 1970, IAUS, 37, 280
- Dehnen & Binney (1998) Dehnen W., Binney J., 1998, MNRAS, 294, 429
- Djorgovski & Sosin (1989) Djorgovski S., Sosin C., 1989, ApJ, 341, L13
- Dickey & Lockman (1990) Dickey J. M., Lockman F. J., 1990, ARA&A, 28, 215
- Drimmel & Spergel (2001) Drimmel R., Spergel D. N., 2001, ApJ, 556, 181
- Dwek et al. (1995) Dwek E., et al., 1995, ApJ, 445, 716
- Ebisawa et al. (2001) Ebisawa K., Maeda Y., Kaneda H., Yamauchi S., 2001, Sci, 293, 1633
- Ebisawa et al. (2005) Ebisawa K., et al., 2005, astro, arXiv:astro-ph/0507185
- Freudenreich et al. (1994) Freudenreich H. T., et al., 1994, ApJ, 429, L69
- Freudenreich (1996) Freudenreich H. T., 1996, ApJ, 468, 663
- Freudenreich (1998) Freudenreich H. T., 1998, ApJ, 492, 495
- Genzel & Townes (1987) Genzel R., Townes C. H., 1987, ARA&A, 25, 377
- Giacconi et al. (1962) Giacconi R., Gursky H., Paolini R., Rossi B. 1962, Phys.Rev.Lett. 9, 439
- Giacconi et al. (2002) Giacconi R., Zirm A., Wang J. et al. 2002, ApJS, 139, 369
- Gonzalez & Graham (1996) Gonzalez R. A., Graham J. R., 1996, ApJ, 460, 651
- Grimm, Gilfanov, & Sunyaev (2002) Grimm H.-J., Gilfanov M., Sunyaev R., 2002, A&A, 391, 923
- Güdel (2004) Güdel M., 2004, A&ARv, 12, 71
- Hands et al. (2004) Hands A. D. P., Warwick R. S., Watson M. G., Helfand D. J., 2004, MNRAS, 351, 31
- Harrison et al. (2004) Harrison F., NuSTAR Science Team, 2004, HEAD, 8,4105
- Iwan et al. (1982) Iwan D., Shafer R. A., Marshall F. E., Boldt E. A., Mushotzky R. F., Stottlemyer A., 1982, ApJ, 260, 111
- Kent, Dame, & Fazio (1991) Kent S. M., Dame T. M., Fazio G., 1991, ApJ, 378, 131
- Koyama et al. (1986) Koyama K., Makishima K., Tanaka Y., Tsunemi H., 1986, PASJ, 38, 121
- Koyama et al. (1989) Koyama K., Awaki H., Kunieda H., Takano S., Tawara Y., 1989, Natur, 339, 603
- Launhardt, Zylka, & Mezger (2002) Launhardt R., Zylka R., Mezger P. G., 2002, A&A, 384, 112
- Lebrun et al. (2004) Lebrun F., et al., 2004, Natur, 428, 293
- Lindqvist, Habing, & Winnberg (1992) Lindqvist M., Habing H. J., Winnberg A., 1992, A&A, 259, 118
- Masetti et al. (2004) Masetti N., Palazzi E., Bassani L., Malizia A., Stephen J. B., 2004, A&A, 426, L41
- Moretti et al. (2003) Moretti A., Campana S., Lazzati D., Tagliaferri G., 2003, ApJ, 588, 696
- Markwardt et al. (2002) Markwardt, C., Jahoda, K. & Smith, D. A. 2002, http://lheawww.gsfc.nasa.gov/users/craigm/pca-bkg/bkg-users.html
- Molkov et al. (2004) Molkov S. V., Cherepashchuk A. M., Lutovinov A. A., Revnivtsev M. G., Postnov K. A., Sunyaev R. A., 2004, AstL, 30, 534
- Mukai & Shiokawa (1993) Mukai K., Shiokawa K., 1993, ApJ, 418, 863
- Muno et al. (2003) Muno, M. P., et al. 2003, ApJ, 589, 225
- Muno et al. (2004) Muno, M. P., et al. 2004, ApJ, 613, 326
- Neronov et al. (2005) Neronov A., Chernyakova M., Courvoisier T. J. -., Walter R., 2005, astro, arXiv:astro-ph/0506437
- Ottmann & Schmitt (1992) Ottmann R., Schmitt J. H. M. M., 1992, A&A, 256, 421
- Porcel, Battaner, & Jimenez-Vicente (1997) Porcel C., Battaner E., Jimenez-Vicente J., 1997, A&A, 322, 103
- Predehl et al (2003) Predehl, P., Friedrich, P., Hasinger, G., Pietschon, W., & the ROSITA Team 2003, Astronomische Nachrichten, 324, 128
- Revnivtsev (2003) Revnivtsev M., 2003, A&A, 410, 865
- Revnivtsev et al. (2003) Revnivtsev M., Gilfanov M., Sunyaev R., Jahoda K., Markwardt C., 2003, A&A, 411, 329
- Revnivtsev et al. (2004) Revnivtsev M., Sazonov S., Jahoda K., Gilfanov M., 2004, A&A, 418, 927
- Rieke & Lebofsky (1985) Rieke G. H., Lebofsky M. J., 1985, ApJ, 288, 618
- Sazonov & Revnivtsev (2004) Sazonov S. Y., Revnivtsev M. G., 2004, A&A, 423, 469v
- Sazonov et al. (2005) Sazonov S., et al., 2005, A&A submitted, astro-ph/??
- Schmitt et al. (1990) Schmitt J. H. M. M., Collura A., Sciortino S., Vaiana G. S., Harnden F. R., Rosner R., 1990, ApJ, 365, 704
- Skibo et al. (1997) Skibo J. G., et al., 1997, ApJ, 483, L95
- Sugizaki et al. (2001) Sugizaki M., Mitsuda K., Kaneda H., Matsuzaki K., Yamauchi S., Koyama K., 2001, ApJS, 134, 77
- Suleimanov, Revnivtsev, & Ritter (2005) Suleimanov V., Revnivtsev M., Ritter H., 2005, A&A, 435, 191
- Sunyaev, Markevitch, & Pavlinsky (1993) Sunyaev R. A., Markevitch M., Pavlinsky M., 1993, ApJ, 407, 606
- Tanaka, Miyaji, & Hasinger (1999) Tanaka Y., Miyaji T., Hasinger G., 1999, AN, 320, 181
- Tanaka (2002) Tanaka Y., 2002, A&A, 382, 1052
- Terrier et al. (2004) Terrier R., Lebrun F., Belanger G. et al. 2004, Proceedings of the 5th INTEGRAL Workshop, Munich 16-20 February 2004. ESA SP-552, astro-ph/0405207
- Vallee (1995) Vallee J. P., 1995, ApJ, 454, 119
- Valinia & Marshall (1998) Valinia A., Marshall F. E., 1998, ApJ, 505, 134
- Worrall et al. (1982) Worrall D. M., Marshall F. E., Boldt E. A., Swank J. H., 1982, ApJ, 255, 111
- Worrall & Marshall (1983) Worrall D. M., Marshall F. E., 1983, ApJ, 267, 691
- Warwick, Pye, & Fabian (1980) Warwick R. S., Pye J. P., Fabian A. C., 1980, MNRAS, 190, 243
- Warwick et al. (1985) Warwick R. S., Turner M. J. L., Watson M. G., Willingale R., 1985, Natur, 317, 218
- Warwick et al. (1988) Warwick R. S., Norton A. J., Turner M. J. L., Watson M. G., Willingale R., 1988, MNRAS, 232, 551
- Weiland et al. (1994) Weiland J. L., et al., 1994, ApJ, 425, L81
- Winkler et al. (2003) Winkler C., et al., 2003, A&A, 411, L1
- Yamauchi et al. (1990) Yamauchi S., Kawada M., Koyama K., Kunieda H., Tawara Y., 1990, ApJ, 365, 532
- Yamauchi & Koyama (1993) Yamauchi S., Koyama K., 1993, ApJ, 404, 620
- Yamauchi et al. (1996) Yamauchi S., Kaneda H., Koyama K., Makishima K., Matsuzaki K., Sonobe T., Tanaka Y., Yamasaki N., 1996, PASJ, 48, L15