High Spectral Resolution Observations of the Massive Stars in the Galactic Center
Abstract
We present high-resolution near-infrared spectra, obtained with the NIRSPEC spectrograph on the W. M. Keck II Telescope, of a collection of hot, massive stars within the central 25 arcseconds of the Galactic center. We have identified a total of twenty-one emission-line stars, seven of which are new radial velocity detections with five of those being classified as He I emission-line stars for the first time. These stars fall into two categories based on their spectral properties: 1) those with narrow 2.112, 2.113 He I doublet absorption lines, and 2) those with broad 2.058 He I emission lines. These data have the highest spectral resolution ever obtained for these sources and, as a result, both components of the absorption doublet are separately resolved for the first time. We use these spectral features to measure radial velocities. The majority of the measured radial velocities have relative errors of 20 km s-1 , smaller than those previously obtained with proper-motion or radial velocity measurements for similar stellar samples in the Galactic center. The radial velocities estimated from the He I absorption doublet are more robust than those previously estimated from the 2.058 emission line, since they do not suffer from confusion due to emission from the surrounding ISM. Using this velocity information, we agree with previous stellar velocity studies that the stars are orbiting in a somewhat coherent manner but are not as defined into a disk or disks as previously thought. Finally, multi-epoch radial velocity measurements for IRS 16NE show a change in its velocity presumably due to an unseen stellar companion.
1 INTRODUCTION
The dynamic environment created by the presence of a supermassive black hole at the Galactic center is thought to inhibit the classical process of star formation initiated through the spontaneous contraction of material to densities above the Jeans limit (Morris 1993). As a result, external influences may be required such as shocks due to cloud collisions, supernovae, and stellar winds to compress the material prior to star formation. These methods for star formation may skew the initial mass function (IMF) toward the production of massive stars and, indeed, the stellar population in the central parsec of the galaxy, as well as the nearby Quintuplet and Arches clusters, contains a significant number of the massive stars. While the Galactic center would seem to be a hostile environment for recent star formation, the region is also replete with young stars with the central parsec hosting a large number of young, massive He I emission-line stars (Rieke & Lebofsky 1987, Lebofsky & Rieke 1987; Forrest et al. 1987; Krabbe et al. 1991; Rieke 1993; Blum et al. 1995).
This paradox of recent star formation in an inhospitable environment is even more dramatic for the young stars within one arcsecond of the supermassive black hole (Genzel et al. 1997; Eckart et al. 1999; Figer et al. 2000; Gezari et al. 2002; Ghez et al. 2003). Many stellar dynamic models have been used to try to explain the presence of all stars observed in the central parsec. For instance, rather than in situ star formation, one mechanism proposed to explain the presence of the young stars involves the in-fall of a parent supermassive stellar cluster from outside the central parsec due to dynamical friction. This mechanism would have to explain the observed stellar populations both within the central arcsecond and in the surrounding He I emission-line star cluster (Kim et al. 1999; Portegies-Zwart et al. 2001; Gerhard 2001; Kim et al. 2004). N-body simulations of the massive cluster’s in-fall via dynamical friction, however, do not result in a large enough population of He I emission-line stars compared to what is known from observations, nor do the simulations address the presence of the stars in the central arcsecond (Gerhard 2001; Kim & Morris 2003; Paumard et al. 2003; Kim et al. 2004). Another mechanism which could insert young, massive stars into the central parsec is the presence of an intermediate mass black hole within the in-falling cluster. Such a black hole would act as a gravitational seed dragging the massive stars along during in-fall (Hansen & Milosavljević 2003; Kim et al. 2004). While there is no definitive evidence to date for an intermediate-mass black hole within the central parsec, one small cluster of stars, IRS 13, is a prominent X-ray source and is a candidate location for the presence of an IMBH (Maillard et al. 2004). Finally, young stars could be inserted into an orbit one arcsecond from Sgr A* through multi-body interactions from in-falling massive binary systems (Gould & Quillen 2003). With the young star problem being key to understanding star formation within the central parsec, it becomes essential to carry out a complete census of this stellar population in order to test the star formation models.
Many early-type stars in the central parsec, including the brightest members of the IRS 16 cluster, have been identified as luminous blue variable (LBV) candidates, or Wolf-Rayet (WR) stars, based on the atomic transitions and equivalent widths (EWs) of their observed emission lines (Krabbe et al. 1995; Blum et al. 1996; Paumard et al. 2001, 2003, hereafter P2001, P2003; Genzel et al. 2000, hereafter G2000; Tamblyn et al. 1996). The presence of ionized gas within the central parsec often generates confusion when classifying stellar spectra requiring high spatial resolution observations which have only been possible within the past few years with 5 to 10 meter class telescopes. The Wolf-Rayet stars in the central parsec, and in the nearby Quintuplet and Arches clusters, including late-type WC and Ofpe/WNL stars, constitute the largest population of such stars in the Galaxy (Figer et al. 1995; Figer et al. 1996; Cotera et al. 1996; Figer et al. 1999; Figer et al. 2002; Blum et al. 2001; Genzel et al. 2000).
In this paper, we present new high-spectral resolution near-infrared spectra of a collection of massive, hot stars within the central parsec of the Galaxy. Section 2 describes the data set obtained for this work, Section 3 describes the techniques used to extract information from the spectra, Section 4 reviews the information we can derive from the data, and Section 5 discusses the implications of these results.
2 OBSERVATIONS
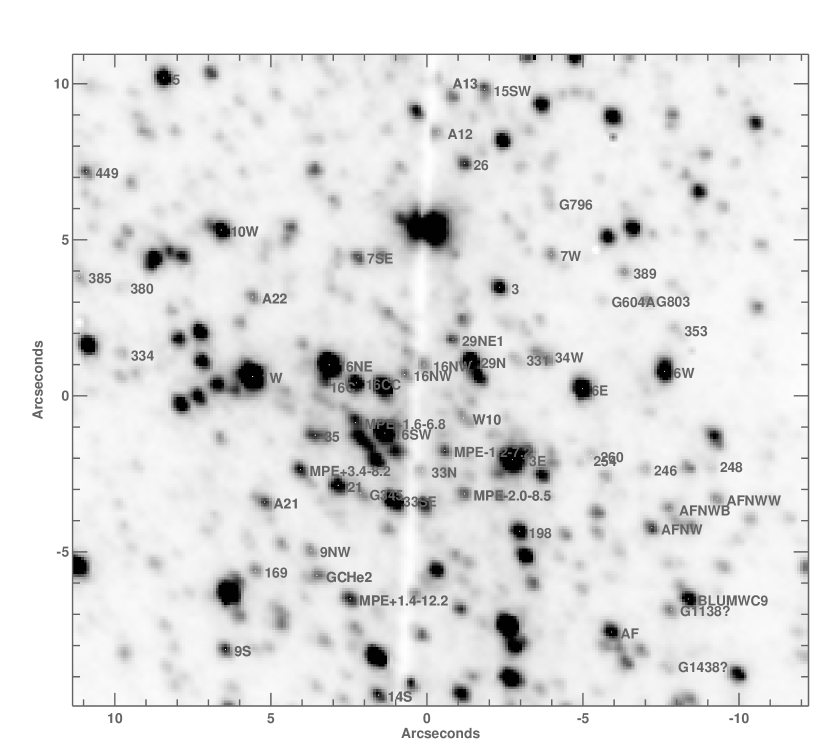
The observations were obtained on June 4, 1999, and July 4, 1999 with NIRSPEC, the facility near-infrared spectrograph, on the Keck II telescope (McLean et al. 1998), in high-resolution mode covering K-band wavelengths (1.98 to 2.32 ). The long slit (24”) was used in a north-south orientation, and the telescope was offset by a fraction of a slit width to the west between exposures (see Figure 1). Two data cubes were built from the spectra obtained on the two nights. The field observed in July is almost entirely contained within the field covered in June which covers a 2424 arcsecond region. Spectra of 40 stars, half of them hot, appear in both data cubes.
The slit viewing camera (SCAM) was used to obtain images simultaneously with the spectra. These images make it easy to determine the slit orientation on the sky when the spectra were obtained. From the SCAM images, we estimate seeing (FWHM) of 06 on the first night and 04 on the second night. The plate scales for the spectrograph (014/pixel along the spectral axis and 02/pixel along the spatial axis) and imager (018/pixel) were taken from Figer et al. (2000). We chose to use the 5-pixel-wide slit (072) for the June slit scan and 3-pixel-wide slit (043) for the July slit scan in order to match the seeing on the respective nights. The corresponding resolving power was R14,000 in June, and R23,300 in July, measured from sky OH and arc lamp lines of known wavelengths in the two data sets. The slit positions were nearly parallel in the June scan, aligned with the long axis along the north-south direction, while they were quite skewed in the latter part of the July scan because of problems with telescope tracking and/or image rotator control during these commissioning runs. The NIRSPEC cross-disperser and the NIRSPEC-7 and NIRSPEC-6 filters were used to image six echelle orders onto the 10242-pixel InSb detector field of view. Note that the two filters were used in concert in July in order to ensure complete rejection of light in unwanted cross-disperser orders.
Some prominent features within the spectral range of our data set include diffuse and stellar lines of: Br emission at 2.1661 , Fe III at 2.2178 , He I at 2.0581 , and the edge of the CO(2-1) transition at 2.2935 . Table 1 provides a list of known photospheric, telluric and interstellar medium (ISM) lines observed within the wavelength ranges considered in this paper. Quintuplet Star 3, which is featureless in this spectral region (Figer et al. 1998), was observed as a telluric standard (Moneti et al. 1994). Arc lamps containing Ar, Ne, Kr, and Xe, and spectra of the sky, were observed to set the wavelength scale. In addition, a continuum lamp was observed through an etalon filter in order to produce an accurate wavelength scale in between arc lamp and sky lines (predominantly from OH). A field relatively devoid of stars, the “dark spot” (=17h44m49.s, =-28.54’6.”8, J2000), was observed to provide a dark current plus bias plus background image. A quartz-tungsten-halogen (QTH) lamp was observed to provide a flattened image. There are still some visible telluric lines best seen in Figure 4 (shown with a vertical dotted line) which did not go away completely from the sky calibration.
3 DATA REDUCTION AND ANALYSIS
We provide a brief overview of the data reduction procedure here with a more complete discussion provided in Figer et al. (2003). We removed sky emission, dark current, and residual bias, by subtracting images taken at the location of the ”dark spot”. Due to the changing sky levels during the scan, the sky level in the dark sky image was scaled before subtracting it from target images. The scale factor was chosen such that it produced the minimum variance of residual sky line features in selected regions of the image after flat-fielding. The images were then flattened by dividing them by the QTH lamp image. These flattened images were then cleaned of bad pixels using a two-pass procedure. First, we replaced any pixel with a value five times the average of its neighbors within a 5 by 5 pixel area by the median of the neighbors in that area. Second, we replaced pixels with values that were higher or lower than the values of both immediate neighbors in the dispersion direction, and deviated by more than 10 times the poisson noise from those two neighbors.
Out of the roughly 60 sources in our sample which have been classified as hot stars based on previously published photometry and/or spectra, we identify 20 stars with spectral features falling into two distinct classes: 1) those stars with He I 2.112, 2.113 doublet absorption lines (see Table 4 and Figures 2 and 3), and 2) those stars with broad He I 2.058 emission lines (see Table 6 and Figure 4). A list of all the notable stellar spectral features identified in this sample of stars is given in Table 2.
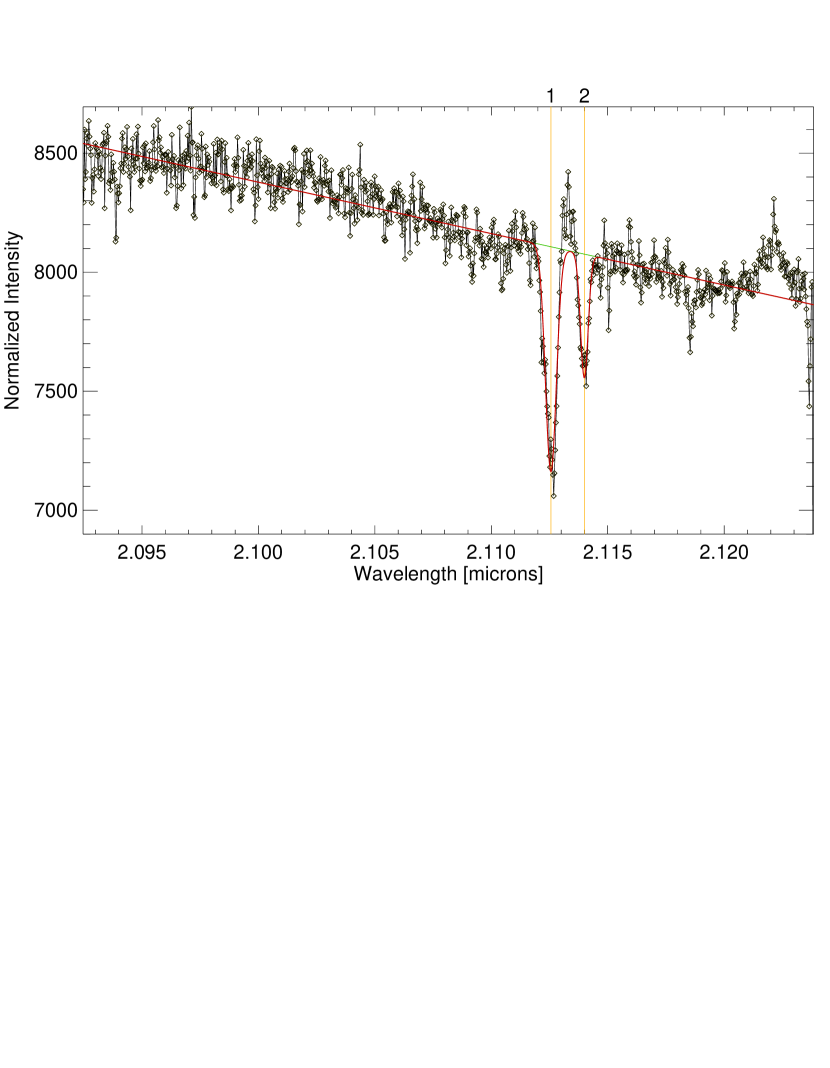
The radial velocities of the stars with the 2.112, 2.113 doublet are initially estimated from the centroid of a gaussian fitted to each individual component of the doublet. First, the continuum level is modeled with a first order polynomial and then the gaussian fits are applied to each of the absorption features using the IDL spectral line fitting program lineplot. The two absorption lines produce two separate estimates for the radial velocity (see Figure 5), and when the doublet is detected in both the June and July data sets, there are four separate estimates of the radial velocity. The radial velocities estimated from the gaussian fits and their uncertainties are given in Table 4, which includes the average velocity estimated from the available measurements. The uncertainties are calculated as either the standard deviation of the values from four measurements (two lines, two observations) or the half range of two measurements (two lines, one observation). The dominant source of uncertainty is measurement error when fitting the line. If there were more lines detected, then a cross-correlation of the observed spectrum with a model template would produce the smaller uncertainties reported for the radial velocities of the cool stars from this same data set (Figer et al. 2003). Most of the radial velocities of the He I emission-line stars estimated from the 2.112 and 2.113 lines (with the exception of IRS 16C) are consistent with published values (P2001, see Table 4). The radial velocities and classifications of these sources are more robust than those of P2001 and G2000 since they are based on an absorption feature, which is not as biased from local ISM emission as the 2.058 He I emission-line used previously.
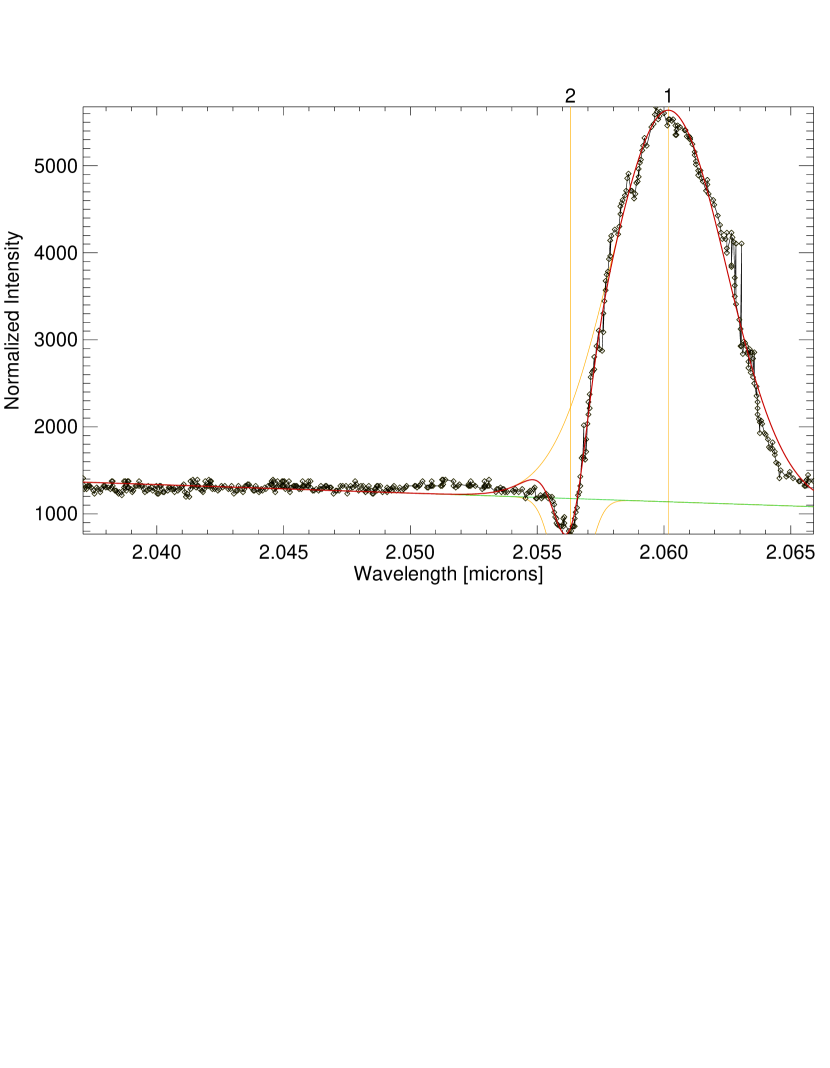
The broad He I emission feature at 2.058 (see Figure 6) is modeled as a single gaussian component along with an additional gaussian absorption feature on the blue side of the emission feature (a P Cygni profile). The radial velocities estimated from the center of the emission feature are listed in Table 6 along with the FWHM of the emission feature thought to approximate the outflow velocity of the stellar wind. For two sources (IRS 9S and G1138), the radial velocity was estimated from the 2.1125 He I emission line due to low signal to noise in the 2.058 line. Since none of the broad-line sources are present in the July data set, we also estimate the radial velocities from the emission-line sources by cross-correlating the spectrum around the 2.058 He I emission line with a template consisting of a gaussian at the rest wavelength of the line and the observed FWHM. The radial velocities estimated from both methods are given in Table 6 as well as their average and the half range. These radial velocity measurements are also consistent with previously published values (P2001; G2000). Figure 7 compares all the radial velocities estimated in this paper to their previously published values. We have adjusted all the radial velocities from the geocentric to the heliocentric frame by removing Earth motion, +6.6 km s-1 in June and -8.1 km s-1 in July, where a positive value indicates motion toward the Galactic center. The error in the resultant velocity due to this adjustment is estimated to be 0.10 km s-1 .
To verify that our line fitting procedure provides a valid radial velocity for each star, we also cross-correlated the spectra of IRS 16NE and the AF star with a non-LTE stellar atmospheric model of the spectrum (Najarro et al. 1999, see Figure 8). The model accounts for any effect the winds have on the position and shape of the photospheric lines, such as blue shifting the location of the minima of the absorption doublet. Also, when a P-Cygni profile is present, the radial velocity estimate from the theory always lies on the bluer side of the emission component and not at the position of the peak of the feature. Furthermore, the FWHM estimate from the broad emission line component of the P-Cygni profile is not necessarily a direct measure of the terminal velocity of the wind. The case of the He I 2.058 line is even worse since the absorption and emission components will depend on wind parameters such as mass-loss rate, the terminal velocity, and the shape of the velocity field. From the cross-correlations, we estimate radial velocities of 49 and 239 km s-1 for IRS 16NE and the AF star, respectively. This is an offset of 24 and 18 km s-1 from the values reported in Tables 4 and 6 estimated from gaussian fitting and gaussian cross-correlation. These offsets represent a potential correction factor to all the measured radial velocities due to the wind effects on the shapes of the spectral lines.
4 RESULTS
In total we have added five newly classified He I emission-line stars (-9.13-2.14, A12, A13, G1438 and G1138) to the population of such stars observed within the central few parsecs of the Galactic center. This increases the total number of stars definitively identified as He I emission-line stars to around sixty when combined with similar surveys, the most recent including Paumard et al. (2001, 2003, 2004), Genzel et al. (2000, 2003), and Ott (2004). The other two stars with new radial velocity estimates are known He I emission line stars (AFNWB and GCHe2, Tamblyn et al. 1996). With the aid of adaptive optics and/or larger telescopes, these high spatial resolution surveys have confirmed the identities of many well known He emission-line stars classified originally based on lower spatial resolution observations (Krabbe et al. 1995; Tamblyn et al. 1996; Libonate et al. 1995; Najarro et al. 1997 and references within). The Paumard et al. surveys covered an area of 4024 arcseconds with 38 He I emission-line star detections separated into two primary categories - broad and narrow emission-line stars based on the FWHM of their He I 2.058 emission line. P2001 used both their spectral features and difference in luminosity (the broad-line stars are fainter on average than the narrow-line stars) to classify the narrow-line stars as LBV-like stars and the broad-line stars as Wolf-Rayet stars. The survey by Ott (2004) shares many sources with the Paumard et al. survey with 26 He I emission-line star detections. They used the three measured velocity components to separate the stars into clockwise and counter-clockwise rotating populations based on their normalized angular momenta. A recent high spatial resolution study of the stellar population within the central parsec done with the VLT SPIFFI integral field spectrograph has identified IRS 16SE2 as a WN 5/6 star (Horrobin et al. 2004). This study also classified IRS 3 as a WC 5/6 star, however, its classification is still under debate (Pott et al. 2005). A list of those stars with published radial velocities which were not observed in this work is given in Table 7, providing a complete list of radial velocities for the identified He I emission-line stars in the central parsec. For those stars with no available spectra, Ott (2004) also identifies 400 stars as potential He I emission-line stars or main-sequence, early-type stars based on a CO-band index estimated from 2.29 and 2.26 AO images available from the Gemini North Galactic center Demonstration Science data set. Finally, Tanner et al. (2005) added six stars embedded within the Northern Arm to the population of early-type stars using the standoff distances and position angles of the bowshock surrounding these sources.
The types of spectral features observed around these stars fall into two distinct classes: 1) those stars with the He I 2.112, 2.113 absorption doublet, and 2) those with the He I 2.058 broad emission line. For comparison, Figures 9 and 10 show the spectra of the stars with either the He I 2.112, 2.113 doublet or the He I 2.058 broad emission line at the 2.058 and 2.112/2.113 spectral region, respectively, to show that the stars with one of the two designations do not have the other type of spectral feature. Most of the sources in both classes also exhibit complex Br emission line features at around 2.058 due to emission from the diffuse gas within the mini-spiral which pervades the region. IRS 16NE also has some additional He I absorption features near the Br line due to hydrogenic helium. When we consider both the total the equivalent width of both lines in the He I 2.112, 2.113 feature (provided in Table 3) and the absence of any detectable N III 2.1155 emission, we determine that the stars with the He I absorption doublet have the spectral features resembling late O to early B stars similar to the stars within one arcsecond of Sgr A* (Hansen et al. 1996; Ghez et al. 2003; Schödel et al. 2003).
Some sources in our sample are notable for having no detectable emission or absorption features falling in the two classes mentioned above or for having published classifications which contradict our results. IRS 34W has been classified as a narrow-line star based on its 2.058 emission line and a variable star based on its light curve (Paumard et al. 2003; Ott et al. 2003), however, we detect no 2.112, 2.113 absorption feature for this source (see Figure 11), as is seen in our spectra of the other ”narrow-line” sources classified in Paumard et al. (2001, 2003). We do not observe a distinct broad He I emission line in the spectra of either IRS 29N or 16SE2 other than some narrow-line emission created by the surrounding ISM (see Figure 12). These two stars are classified as broad-line sources in P2003 based on the FWHM of their 2.058 He I emission line. Blum et al. (1995) originally classified the source BSD WC9, also known as Blum WC9, as a WC9 Wolf-Rayet star based on the detection of C IV and C III lines with P2003 providing the more general classification of a broad-line He I star. While we observe no broad He I emission line, we do detect the 2.112, 2.113 absorption feature which suggests a potential misclassification for this star (see Figures 3 and 12). One alternative to miss-classification for these sources is that, as a result of their variable nature, their spectral features changed over the duration of the different observing epochs as has been observed in stars of similar spectral type (Morris et al. 2004). Figure 12 shows a portion of the spectrum of AFNWW which has a distinctive absorption feature with no trace of the expected emission component. Two of the stars with new radial velocity detections (G1138 and G1438) were classified at ”CO” stars in Genzel et al. (2000). We have also observed the two stars which lie at the center of the mini-cavity and Eastern Cavity (Stolovy et al. 1999). While both MPE-2.0+8.5 and A21 are definitely hot stars based on a lack of CO absorption in their NIRSPEC spectra, we do not observe any stellar photospheric features from which we would be able to estimate a mass-loss rate. The question remains as to whether or not these stars are the sole contributors to the winds necessary to create the cavities in which they are embedded and whether the cavities exist at all (Paumard et al. 2004). If A21 and MPE-2.0+8.5 are truly hot stars, and are truly at the centers of the mini-cavity and Eastern Cavity, respectively, then they might excite those cavities. Finally, no distinguishable photospheric lines were detected in any of the Northern Arm sources or IRS 3.
Table 8 presents a list of those stars which are classified as hot stars based on their lack of prominent CO absorption features, but which do not have any distinguishable photospheric lines in our data set. Those sources which do not have any previously published name were assigned a designation based on their RA and Dec offsets from Sgr A* in arcseconds. Some of the stars with detectible He I emission lines also show a noticeable dip in the region of the CO absorption features, but the weak strength of this feature and its presence in definitively classified He I emission line stars suggests that the absorption is most likely the result of pollution from the numerous background red giants comprising the older stellar population in the Galactic center (Haller et al. 1996).
By increasing the sample of He I emission-line stars, we can look for trends in the spatial distribution and kinematics of these stars. Figure 13 shows the spatial distribution of the sources detected in this paper, P2001 and G2000. Paumard et al. (2001) claim that the narrow- and broad-line sources are distributed in two distinct centralized and ring-like populations on the plane of the sky over a region similar to that covered in this study. The distinction in the spatial distribution of the narrow- and broad-line sources is not as discernable in Figure 13, with the addition of a few narrow-line stars at distances greater than five arcseconds from Sgr A*. However, the prominence of the IRS 16 cluster of narrow-line sources near Sgr A* is still impressive and is not biased in our survey due to a drop off of sensitivity since the slit was scanned over a large field of view. To quantify any true asymmetry in the spatial distribution of the stars on the plane of the sky, we calculate an asymmetry factor, Q, defined as the difference in the number of broad- and narrow-line stars within and beyond a set of specified radii.
| (1) |
The differences are normalized by the area of the inner and outer regions. The set of asymmetry factors estimated from the data as a function of distance from Sgr A* has a distinctive peak at a radius of about 25 (see Figure 14) after falling off from Sgr A*. When we run ten thousand iterations of a Monte Carlo code in which the stars are placed randomly within the same field-of-view as the data, the same or greater value of the asymmetry factor as that derived from the data only occurs 0.5% of the time (see Figure 14), suggesting that the distribution of stars within the central parsec is not a random distribution.
With the addition of seven new RV measurements, we can also compare the kinematics of the broad- and narrow-line populations using the stars with both proper motion and radial velocity measurements given in this paper and in the literature. Figure 15 shows a plot of the measured radial velocities as a function of offset from Sgr A*. This plot includes both the narrow-line (filled circles) and broad-line sources (open circles) with no significant difference in the velocity offsets for these two populations. Most of the stars lie along a diagonal going through the position of Sgr A*, supporting previous claims that these stars comprise at least one coherent rotating disk (Levin & Beloborodov 2003; P2001; G2000).
The stars can be further divided into two separate populations of clockwise and counter-clockwise orbital orientations through their normalized angular momentum along the line of sight, Jz/J, the same method employed by Genzel et al. (2003). This term is -1 when the orbit is counterclockwise tangential, 0 when its radial, and +1 when its clockwise on the plane of the sky. When using our sample of 26 stars with published proper motion and radial velocity measurements, there are 15 stars in the clockwise population and 11 stars in the counter-clockwise population corresponding to positive and negative normalized angular momentum values, respectively (See Figure 16). Genzel et al. (2003) report 14 and 12 stars in these two populations, however, neither the radial velocities nor the identities of these stars have been published to date. We estimate the orientations of the clockwise and counter-clockwise disks by minimizing the dot product of the unit normal vector and the stellar velocity vectors as done in Levin & Beloborodov (2003) and Genzel et al. (2003). When the same stars are used with updated proper motion values from Ott (2004) and radial velocity values from this paper and the literature, we get a larger reduced chi squared value of 36 for the clockwise disk suggesting the need for a re-evaluation of the dynamics of these stars given the additional data and improved uncertainties. Also, IRS 29N is reported as a clockwise star in Levin & Beloborodov (2003), however, this may be an sign error since, when we use the proper motion and radial velocity for this star from Genzel et al. (2000), we get the opposite result that it is a counter-clockwise orbiting star. When we include all the stars with published proper motion and radial velocities measurements shown in Figure 16 with distances less than 7 arcseconds to reduce image distortion effects to the proper motion values, the fits to the clockwise and counter-clockwise disks are poor with reduced chi-squared values of 30 for the 13 clockwise stars and 13 with 6 clockwise counter-clockwise stars. These chi-squared values can be compared to the 2 and 4.8 estimated for the 12 clockwise and 12 counter-clockwise stars, respectively, in Genzel et al. (2003) although we do not know which of our stars are in their sample. To improve these disk fits, we remove four stars that appear to be outliers in velocity space when the velocities are plotted from a frame of reference within the disk. This improves the fits to a small degree reduced chi squared values of 16 and 1.3 but with only ten and five stars remaining in the clockwise and counter-clockwise disks, respectively. The normal vectors of these best fitting disks are =[-0.500.06,-0.770.04,0.910.07] and =[-0.180.1,-0.060.1,-0.770.1] and are consistent with the two disks derived in Genzel et al. (2003). Figure 17 shows the velocity of all the stars on the plane on the sky, as well as those stars used in the best fitting disks as seen from an observer within the disk. While the stars do seem to fall along the vertical axis is this plot, there is still a large scatter about the axis. When we derive a fit from the combined sample of clockwise and counter-clockwise stars the reduced chi-squared value is 42 suggesting that, while the two disk model is still a better fit to the data the stars are not orbiting in as flat a disk as previously thought.
Comparisons of the radial velocities estimated from NIRSPEC spectra of both IRS 16NE and 16NW taken in 1999 and later in 2003 (see Figure 18) reveal an unexpected change of 60 km s-1 in the radial velocity of IRS 16NE over the five year time span. IRS 16NE is three arcseconds away from Sgr A* compared to the 1.2 arcsecond separation of IRS 16NW for which we detected no acceleration and use as a comparison to 16NE in Figure 18. However, the large error bars associated with the previous measurements (See Table 9) of the radial velocity for this source do not allow us to see any trends in the acceleration of the source indicative of any orbital motion. Ghez et al. (2004) report proper motions for IRS 16NE of 9712 km s-1 East and -38319 km s-1 South with no detectable accelerations as large as that detected along the line of sight. More likely, this star is a spectroscopic binary system which may have contributed to the population of stars within one arcsecond of Sgr A* by ejecting stars through gravitational interactions (Gould & Quillen 2003).
5 DISCUSSION
This high-spatial resolution spectroscopic survey of the central tens of arcseconds of the Galactic center has added five new He I emission-line stars, an increase of almost 10%, to the known population while also reducing the uncertainties on the remaining previously published sources. These five new sources include four narrow-line sources with He I 2.112, 2.113 absorption features and one broad-line sources with wind broadened He I 2.058 emission features. The spectra presented here are superior to those previously published due to both higher spatial and spectral resolution. The high spectral resolution allows us to detect both components of the He I 2.112, 2.113 doublet which has not been observed before in many of these sources.
The occurrence of a few conflicting spectral classifications (IRS 29N and Blum WC9) shows the importance of high spatial resolution observations to be able to distinguish between crowded sources common in the Galactic center, as well as high spectral resolution observations to be able to discern between photospheric and ISM features. Some of the earliest spectral classifications based on low spatial resolution data were erroneous due to the misidentification of Br as being a photospheric line as opposed to originating from the ISM within the mini-spiral (Krabbe et al. 1995). In order to create a complete understanding of the stellar population within this region we must be able to separate the mini-spiral emission from that of the stars. Reproducing the spectral features of the mini-spiral based on its known kinematics and density could then be used to separate emission from the gas and the stars.
Paumard et al. (2001, 2003) use the narrow FWHM of the 2.058 line as well as the large K magnitudes of the IRS 16 sources to claim they are LBV-like stars. This, however, did not consider whether the stars show any sign of variability, nor do they have spectra resembling those associated with known LBV’s (Humphreys & Davidson 1994; Figer et al. 1998). Ott et al. (1999) provided light curves of IRS 16C, 16CC, 16NW, and 33E showing no sign of variability. Finally, it would be surprising, indeed if these stars were all bona fide LBVs given their short lifetimes and relative paucity in the rest of the galaxy. We conclude that the narrow-line stars, with the exception of IRS 16NE, more closely resemble B supergiants based on the equivalent width of their He I 2.112, 2.113 lines, the absence of any detectible NIII 2.1155 emission and their similarity to such stars identified in the Quintuplet (Hansen et al. 1996; Figer et al. 1999). Despite our determination that the narrow-line sources have spectral types near early B stars, we cannot trace the precursor (20 M☉) stars back to a precise epoch of star formation since stars in this phase race back and forth on the Hurtzsprung-Russell diagram. The same ambiguities exist for estimating an exact mass for these stars since the precursor mass for a WC star can range from 25 to 120 M☉ (Abbott & Conti 1987).
Table 10 provides a list of the number of OB supergiants (OBI), early transitional objects including LBV and sgB[e], red supergiants (RSG), and WN and WC Wolf-Rayet stars identified in the Central cluster, the nearby Arches and Quintuplet clusters and the young galactic open cluster, Westerlund 1 (Wd 1) (Clark et al. 2005; Figer et al. 2004 and reference within). As we are improving our knowledge of the stellar populations of these clusters, it appears that Central and Quintuplet clusters have similar distributions of spectral types which is not surprising given their similar cluster mass and age (Figer et al. 2004). The larger number of Wolf-Rayet stars in the Central cluster compared to Wd 1 might be due to the different environments in which these two clusters of similar age formed (Clark et al. 2004).
As mentioned in Section 4, our radial velocity results marginally agree with the hypothesis that the He I emission-line stars are orbiting coherently in either a clockwise and counter-clockwise orbiting disk. These results are based on measurements of just four out of six of the phase-space coordinates (x, y, vx and vy). While we have increased the number of stars with radial velocity measurements, their line-of-sight distance from Sgr A* is unknown. Those sources embedded within the Northern Arm overcome this issue by utilizing the three-dimensional models of the Northern Arm by Paumard et al. (2003b) to deduce their line-of-sight distance. The orbital parameters of the Northern Arm sources, IRS 1W and 10W, estimated from all six phase space coordinates, are consistent with those of the clockwise orbiting disk, supporting the existence of at least one of the two disks. The improved uncertainties for both the proper-motion and radial velocity measurements result in fits with larger reduced chi-squared values than those previously published suggesting that the disks may not be as coherent as previously thought. If the orbits of the He I emission-line stars do comprise one or more coherent structures, then this lends credence to the hypothesis that the young star population is the result of the in-fall of a massive star cluster. In fact, it has been recently suggested that the nearby compact cluster of stars known as IRS 13 could be the remnants of the core of such a cluster (Maillard et al. 2004). However, the cluster in-fall models of Kim and Morris (2003) predict up to a factor of ten too many He I emission-line stars in the central few arcseconds so our increase in the known population of these stars does not help this discrepancy.
Because of their high mass-loss rates, the population of He I emission-line stars has been hypothesized to be a significant source of accretion of material onto Sgr A* (Quataert et al. 2003; Melia et al. 1999). However, the bulk of the accretion comes from the copious mass-loss of the IRS 13 sources. When we estimate the additional contributions from our newly identified sources to the effective accretion rate onto Sgr A*, despite increasing the population, there is not a significant additional source of material accreting onto Sgr A*.
6 CONCLUSIONS
We have added five new He I emission-line stars to the known population of hot, massive stars in the central parsec of the galaxy and have confirmed the stellar classification of an additional fourteen stars. These stars are joined by two others in our sample which have radial velocities not published to date. With improved uncertainties for both the proper-motions and radial velocities of these stars, we somewhat agree with the hypothesis that the stars form two coherent disks although the degree of coherence is still under speculation as our fits to the two disk model are not all that satisfactory and are in a different orientation than that previously published. The addition of more He I emission-line stars to the sample and improved uncertainties on the proper motions of the stars further from Sgr A* will help come to a firm conclusion on the dynamics of these stars. These results are important for testing the origin of these young, massive stars near the supermassive black hole since this large population is still difficult to explain, given the dynamic environment of the Galactic center. Finally, we have found preliminary evidence that the He I emission-line star, IRS 16NE, may be a spectroscopic binary based on an observed change in its radial velocity over five years.
More conclusive classifications of the spectral types of these stars through careful study of their spectral features will allow us to derive a comprehensive census of these stars to also compare to the star formation models which predict the expected number stars of specific spectral types. Integral field spectrographs will greatly benefit this field as they enable deeper observations to begin to probe the main sequence. It will also be of interest to extend the wavelength coverage to longer wavelengths such as the L or L’ bands so that the additional spectral information provides more robust classifications.
References
- (1)
- (2) Abbott, D. C. & Conti, P. S. 1987, ARA&A, 25, 113
- (3) Blum, R. D., Schaerer, D., Pasquali, A., Heydari-Malayeri, M., Conti, P. S., & Schmutz, W. 2001, AJ, 122, 1875
- (4) Blum, R.D, Depoy, D. L., Sellgren, K., 1995, ApJ, 441, 603
- (5) Blum, R. D., Sellgren, K., & Depoy, D. L. 1996, ApJ, 470, 864
- (6) Clark, J. S., Negueruela, I., Crowther, P. A., Goodwin, S., & Hadfield, L. J. 2005, ASSL Vol. 329: Starbursts: From 30 Doradus to Lyman Break Galaxies, 13P
- (7) Cotera, A. S., Erickson, E. F., Colgan, S. W. J., Simpson, J. P., Allen, D. A., & Burton, M. G. 1996, ApJ, 461, 750
- (8) Eckart, A., Ott, T., & Genzel, R. 1999, A&A, 352, L22
- (9) Figer, D. F., Rich, R. M., Kim, S. S., Morris, M., & Serabyn, E. 2004, ApJ, 601, 319
- (10) Figer, D. F., et al. 2003, ApJ, 599, 1139
- (11) Figer, D. F., et al. 2002, ApJ, 581, 258
- (12) Figer, D. F., et al. 2000, ApJ, 533, L49
- (13) Figer, D. F., Kim, S. S., Morris, M., Serabyn, E., Rich, R. M., & McLean, I. S. 1999, ApJ, 525, 750
- (14) Figer, D. F., Najarro, F., Morris, M., McLean, I. S., Geballe, T. R., Ghez, A. M., & Langer, N. 1998, ApJ, 506, 384
- (15) Figer, D. F., Morris, M., & McLean, I. S. 1996, ASP Conf. Ser. 102: The Galactic Center, 102, 263
- (16) Figer, D. F., McLean, I. S., & Morris, M. 1995, ApJ, 447, L29
- (17) Forrest, W. J, Shure, M. A., Pipher, J. L., and Woodward, C. E., 1987, AIPC, 155, 153
- (18) Gerhard, O. 2001, ApJ, 546, L39
- (19) Genzel, R.,et al. 2003, ApJ, 594, 812
- (20) Genzel, R., Pichon, C., Eckart, A., Gerhard, O. E., & Ott, T. 2000, MNRAS, 317, 348
- (21) Genzel, R., Thatte, N., Krabbe, A., Kroker, H., & Tacconi-Garman, L. E. 1996, ApJ, 472, 153
- (22) Genzel, R., Eckart, A., Ott, T., & Eisenhauer, F. 1997, MNRAS, 291, 219
- (23) Gezari, S., Ghez, A. M., Becklin, E. E., Larkin, J., McLean, I. S., & Morris, M. 2002, ApJ, 576, 790
- (24) Ghez, A. M., Salim, S., Hornstein, S. D., Tanner, A., Lu, J. R., Morris, M., Becklin, E. E., & Duchêne, G. 2005, ApJ, 620, 744
- (25) Ghez, A. M., et al. 2004, ApJ, 601, L159
- (26) Ghez, A. M., Duchêne, G., Matthews, K., Hornstein, S. D., Tanner, A., Larkin, J., Morris, M., Becklin, E. E., Salim, S., Kremenek, T., Thompson, D., Soifer, B.T., Neugebauer, G., McLean, I. 2003, ApJ, 586, L127
- (27) Gould, A. & Quillen, A. C. 2003, ApJ, 592, 935
- (28) Haller, J. W., Rieke, M. J., Rieke, G. H., Tamblyn, P., Close, L., & Melia, F. 1996, ApJ, 468, 955
- (29) Hansen, B. M. S. & Milosavljević, M. 2003, ApJ, 593, L77
- (30) Hanson, M. M., Conti, P. S., & Rieke, M. J. 1996, ApJS, 107, 281
- (31) Horrobin, M., et al. 2004, Astronomische Nachrichten, 325, 88
- (32) Humphreys, R. M. & Davidson, K. 1994, PASP, 106, 1025
- (33) Jackson, J. M., Geis, N., Genzel, R., Harris, A. I., Madden, S., Poglitsch, A., Stacey, G. J., & Townes, C. H. 1993, ApJ, 402, 173
- (34) Kim, S. S., Figer, D. F.,& Morris, M. 2004, ApJ, 607, L123
- (35) Kim, S. S., Morris, M., & Lee, H. M. 1999, ApJ, 525, 228
- (36) Krabbe et al., 1995 ApJ, 447, L95
- (37) Krabbe, A., Genzel, R., Drapatz, S., Rotaciuc, V., 1991, ApJ, 382, L19
- (38) Lebofsky, M. J. and Rieke, G. H., 1987, AIPC, 155, 79
- (39) Levin, Y. & Beloborodov, A. M. 2003, ApJ, 590, L33
- (40) Libonate, S., Pipher, J. L., Forrest, W. J., & Ashby, M. L. N. 1995, ApJ, 439, 202
- (41) Maillard, J. P., Paumard, T., Stolovy, S. R., & Rigaut, F. 2004, A&A, 423, 155
- (42) McLean, I. S., et al. 1998, Proc. SPIE, 3354, 566
- (43) Melia, F., & Coker, R. 1999, ApJ, 511, 750
- (44) Moneti, A., Glass, I. S., & Moorwood, A. F. M. 1994, MNRAS, 268, 194
- (45) Morris, M. 1993, ApJ, 408, 496
- (46) Morris, P. W., Crowther, P. A., & Houck, J. R. 2004, ApJS, 154, 413
- (47) Najarro, F., Hillie, D. J., Kudritzki, R. P., & Morris, P. W. 1999, ESA SP-427: The Universe as Seen by ISO, 377
- (48) Najarro, F., Krabbe, A., Genzel, R., Lutz, D., Kudritzki, R. P., & Hillier, D. J. 1997, A&A, 325, 700
- (49) Ott, T., 2004, Ph. D. Thesis
- (50) Paumard, T., Genzel, R., Maillard, J.P., Ott, T., Morris, M., Eisenhauer, F., Abuter, R., 2004, astroph/0407189.
- (51) Paumard, T., Maillard, J. P., Morris, M., A&A, 2004, 826, 81
- (52) Paumard, T., Maillard, J., & Morris, M. 2003a, Astronomische Nachrichten Supplement, 324, 605
- (53) Paumard, T., Maillard, J., & Stolovy, S. 2003b, Astronomische Nachrichten Supplement, 324, 303
- (54) Paumard, T., Maillard, J. P., Morris, M., & Rigaut, F. 2001, A&A, 366, 466
- (55) Portegies Zwart, S. F., McMillan, S. L. W., & Gerhard, O. 2003, ApJ, 593, 352
- (56) Pott, J. -., et al. 2005, ArXiv Astrophysics e-prints, arXiv:astro-ph/0505189
- (57) Quataert, E., Narayan, R., & Reid, M.J., 1999, ApJ, 517, L101
- (58) Reid, M. J., & Brunthaler, A. 2004, ApJ, 616, 872
- (59) Rieke, M. J., 1993, AIPC, 278, 37
- (60) Rieke, G. H. and Lebofsky, M. J., 1987, AIPC, 155, 91
- (61) Schödel, R., Ott, T., Genzel, R., Eckart, A., Mouawad, N., & Alexander, T. 2003, ApJ, 596, 1015
- (62) Stolovy, S. R., McCarthy, D. W., Melia, F., Rieke, G., Rieke, M. J., & Yusef-Zadeh, F. 1999, ASP Conf. Ser. 186: The Central Parsecs of the Galaxy, 186, 39
- (63) Tamblyn, P., Rieke, G. H., Hanson, M. M., Close, L. M., McCarthy, D. W., & Rieke, M. J. 1996, ApJ, 456, 206
- (64) Tanner, A., Ghez, A. M., Morris, M. R., & Christou, J. C. 2005, ApJ, 624, 742
- (65) Yusef-Zadeh, F. & Morris, M. 1991, ApJ, 371, L59
| Transition | [] | Origin | Transition | [] | Origin |
|---|---|---|---|---|---|
| He I | 2.0378 | stellar | OH | 2.1068 | Telluric |
| OH | 2.0413 | Telluric | OH | 2.1097 | Telluric |
| OH | 2.0499 | Telluric | C III | 2.1038 | Stellar |
| He I | 2.0422 | Stellar | C III | 2.1081 | Stellar |
| OH | 2.0564 | Telluric | OH | 2.1106 | Telluric |
| He I | 2.0582 | Stellar | He I | 2.1126 | Stellar |
| He I | 2.0587 | Stellar/ISM | He I | 2.1137 | Stellar |
| OH | 2.0673 | Telluric | C III | 2.1152 | Stellar |
| OH | 2.0729 | Telluric | C III | 2.1155 | Stellar |
| C IV | 2.0705 | Stellar | C III | 2.1156 | Stellar |
| He I | 2.0762 | Stellar | OH | 2.1116 | Telluric |
| C IV | 2.0796 | Stellar | OH | 2.1156 | Telluric |
| C IV | 2.0842 | Stellar | OH | 2.1177 | Telluric |
| OH | 2.0860 | Telluric | He I | 2.1203 | Stellar |
| OH | 2.0910 | Telluric | C III | 2.1217 | Stellar |
| He I | 2.0968 | Stellar | OH | 2.1233 | Telluric |
| N V | 2.0997 | stellar | H2 | 2.1218 | ISM |
| Source | He I 2.058 | He I 2.112/2.113 | He I 2.166a |
|---|---|---|---|
| IRS 16NE | P-Cygni? | abs | P-Cygni |
| IRS 16NW | em | abs | P-Cygni |
| IRS 16C | P-Cygni? | abs | P-Cygni |
| IRS 16CC | em | abs | P-Cygni? |
| IRS 16SW(W) | em+abs | abs | em |
| G1438 | … | abs | … |
| IRS 33E | em | abs | strong em |
| IRS 33N/A11 | em | abs | strong em |
| IRS 6W | em | abs | strong em |
| Blum WC9 | em | abs | weak em |
| A13 | … | abs | weak em |
| A12 | … | abs | em |
| -9.13-2.14(248)b | em | abs | em |
| AF | broad P-Cygni | broad P-Cygni | broad em |
| AFNW | broad P-Cygni | broad em | broad em |
| AFNWB | broad em | broad em | em |
| IRS 15SW | broad em | broad em | broad em |
| IRS 7W | broad P-Cygni | broad em | broad em |
| IRS 9S | em | broad em | em |
| G1138 | em | broad em | em |
| GCHe2 | em | broad em | em |
| PMα | PMδ | |||
|---|---|---|---|---|
| Source | Arcseconds | Arcseconds | km s-1 | km s-1 |
| IRS 16NE | 2.8350.007 | 1.0580.005 | 9529 | -37022 |
| IRS 16NW | -0.0280.006 | 1.2420.007 | 19524 | 7929 |
| IRS 16C | 1.1820.006 | 0.5090.027 | -35123 | 30520 |
| IRS 16CC | 1.9630.004 | 0.5630.005 | -9818 | 23221 |
| IRS 16SW(W) | 1.0070.005 | -0.9520.004 | 25721 | 9718 |
| IRS 33E | 0.6200.005 | -3.1070.004 | 17518 | 20817 |
| IRS 6W | -5.2730.004 | 0.8040.005 | 8615 | 24420 |
| IRS 33N/A11 | -0.0960.004 | -2.1660.005 | 4817 | -17218 |
| BlumWC9 | -8.418 | -6.382 | ||
| -9.13-2.14 | -9.133 | -2.135 | ||
| G1438b | -7.805 | -8.494 | ||
| A12 | -0.456 | 8.487 | ||
| A13 | -0.612 | 10.098 |
| June | July | P2001a | G2000 | ||||||
|---|---|---|---|---|---|---|---|---|---|
| Source | Vr2.112 | Vr2.113 | Vr2.112 | Vr2.113 | Vravg | EW | Vr2.058 | Vr2.058 | |
| km s-1 | km s-1 | km s-1 | km s-1 | km s-1 | km s-1 | km s-1 | km s-1 | ||
| IRS 16NE | 4 | 36 | -8 | 19 | 12 | 19 | 0.97 | 1 | 1725 |
| IRS 16NW | -65 | -28 | -64 | -40 | -49 | 18 | 1.41 | -46 | -3030 |
| IRS 16C | 108 | 127 | 98 | 131 | 116 | 15 | 1.26 | -24 | -18025 |
| IRS 16CC | 252 | 263 | 226 | 243 | 246 | 15 | 1.84 | P2003 | 24570 |
| IRS16SW(W)b | 242 | 252 | 247 | 5 | 1.66 | P2003 | 46030 | ||
| IRS 33E | 121 | 151 | 136 | 15 | 1.93 | 258 | 16060 | ||
| IRS 6W | 63 | 62 | 63 | 1 | 1.88 | -15070 | |||
| BlumWC9c | 88 | 79 | 83 | 4 | 1.34 | P2003 | |||
| -9.13-2.14†† | 42 | 37 | -8 | 19 | 22 | 22 | 1.35 | ||
| G1438†† | 139 | 157 | 148 | 9 | 0.56 | ||||
| IRS 33N/A11 | 50 | 61 | 55 | 5 | 2.40 | P2004 | |||
| A12†† | -148 | -150 | -149 | 1 | 1.29 | ||||
| A13†† | -233 | -220 | -238 | -250 | -235 | 12 | 1.16 | ||
| RAa | Dec | Vα | Vδ | |
|---|---|---|---|---|
| Source | Arcseconds | Arcseconds | km s-1 | km s-1 |
| AF | -6.5410.008 | -6.9190.006 | 3931 | 4525 |
| AFNW | -7.6990.015 | -3.5410.013 | -24861 | -29652 |
| AFNWB | -8.1770.004 | -2.8200.005 | 205144 | 179123 |
| IRS 7W | -4.0490.002 | 4.9800.004 | -1210 | -9618 |
| IRS 15SW | -1.50 | 10.10 | ||
| GCHe2 | 2.8470.005 | -5.6200.005 | 1426 | 10718 |
| G1138b | -7.873 | -6.712 | ||
| IRS 9S | 5.6830.004 | -8.2000.005 | -3613 | -18615 |
| June | Vavg | P2001 | G2000 | |||||
|---|---|---|---|---|---|---|---|---|
| Vr2.058 Fit | FWHM | Vr2.058 CC | Vr2.058 | Vr2.058 | FWHM | Vr2.058 | ||
| Source | km s-1 | km s-1 | km s-1 | km s-1 | km s-1 | km s-1 | km s-1 | km s-1 |
| AF | 248 | 749 | 265 | 257 | 10 | 192 | 826 | 14050 |
| AFNW | 206 | 1324 | 187 | 197 | 10 | 159 | 1300 | 15070 |
| AFNWB† | 218 | 1690 | 283 | 251 | 30 | |||
| IRS 7W | -346 | 811 | -207 | -277 | 70 | -292 | 1031 | -30050 |
| IRS 15SW | -204 | 790 | -124 | -164 | 40 | -179 | 894 | -23050 |
| GCHe2† | 108 | 844 | 194 | 151 | 40 | |||
| G1138†† | 212 | 1677 | 150 | 181 | 30 | |||
| IRS 9S | 180 | 1321 | 146 | 163 | 20 | 20050 | ||
| RAa | Dec | Vα | Vδ | Vr(P2001)b | Vr(G2000) | Type | |
|---|---|---|---|---|---|---|---|
| Source | Arcseconds | Arcseconds | km s-1 | km s-1 | km s-1 | km s-1 | |
| IRS 34W | -4.1320.004 | 1.6460.004 | -9717 | -18617 | -175 | -21530 | Narrow |
| ID180 | 9.4740.001 | 0.580.017 | -73210 | -1080 | 198 | Broad | |
| He1N3 | 3.01 | 3.52 | 615 | Broad | |||
| IRS 7E2 | 4.3940.005 | 4.9760.004 | 20910 | -4623 | P2003 | Broad | |
| IRS 29N | -1.6660.004 | 1.4560.004 | 18110 | -12910 | P2003 | Broad | |
| IRS 15NE | 1.60 | 11.40 | P2003 | -8050 | Broad | ||
| IRS 16SE2/35W | 2.9040.004 | -1.1700.004 | 5225 | 13114 | P2003 | 26590 | Broad |
| W10 | -1.4190.004 | -0.2700.005 | -12421 | -23519 | 27070 | ||
| IRS 16SE1 | 1.8690.001 | -1.0710.001 | 17410 | 10210 | 45060 | ||
| IRS 29NE1 | -0.910.004 | 2.040.005 | -36715 | 1620 | -130100 | ||
| IRS 7SE | 2.55 | 3.19 | 309159 | 429105 | -8540 | ||
| IRS 7E | 4.3140.004 | 5.3280.005 | -1812 | -2119 | -2050 | ||
| AFNWW | -9.150.005 | -3.300.005 | 250100 | ||||
| IRS 1S | 5.55 | 0.45 | -300200 | ||||
| IRS 13Ec | -3.24 | -1.68 | Broad |
| Star | Comment | Star | Comment |
|---|---|---|---|
| IRS 5 | NA source | G803 | |
| IRS 26 | G604A | ||
| IRS 10W | NA source | IRS 29NE1 | |
| IRS 3 | featureless | W10 | G2000 |
| A22/OSUHe1 | IRS 35 | ||
| IRS 29NE1 | G2000 | G345 | |
| IRS 29N | WC9/Broad star (P2001) | AFNWW | G2000 |
| IRS 1W | NA source | IRS 9NW | |
| G796 | 16SE2 | WN5/6 star (Horrobin et al. 2004) | |
| IRS 34W | Narrow line star (P2001) | +10.82+7.27 | |
| MPE+1.6-6.8 | -6.42+4.06 | ||
| IRS 35W | Broad line star (P2003) | +11.04+3.92 | |
| IRS 6E | WC9 star Krabbe et al. 1995 | +9.70+3.58 | |
| IRS 21 | NA source | -8.05+2.22 | |
| MPE-2.0-8.5 | center of mini-cavity | -3.00+1.27 | |
| IRS 2 | NA source | -5.36-1.82 | |
| A21 | center of Eastern cavity | -5.14-1.94 | |
| IRS 20 | -7.08-2.26 | ||
| MPE+1.4-12.2 | -10.03-4.49 | ||
| IRS 14S | +5.40-5.52 | ||
| A22 | |||
| 124 |
| Epoch | Vz | Reference |
|---|---|---|
| km s-1 | ||
| Spring 1996 | 1725 | Genzel et al. (2000) |
| July 25 1997 | 125 | Paumard et al. (2001) |
| June 4 1999 | 416 | this paper |
| June 21 2003 | -5211 | this paper |
| Cluster | OB1 | Early Trans | RSG | WN | WC |
|---|---|---|---|---|---|
| Quintupleta | 14 | 2 | 1 | 5 | 11 |
| Archesa | 20 | 0 | 0 | 6 | 0 |
| Centera | 10 | 1 | 2 | 10 | 15 |
| Wd 1b | 25 | 5 | 3 | 7 | 6 |