The Circumstellar Environments of NML Cyg and the Cool Hypergiants
Abstract
We present high-resolution HST WFPC2 images of compact nebulosity surrounding the cool M–type hypergiants NML Cyg, VX Sgr and S Per. The powerful OH/IR source NML Cyg exhibits a peculiar bean-shaped asymmetric nebula that is coincident with the distribution of its HO vapor masers. We show that NML Cyg’s circumstellar envelope is likely shaped by photo-dissociation from the powerful, nearby association Cyg OB2 inside the Cygnus X superbubble. The OH/IR sources VX Sgr and S Per have marginally resolved envelopes. S Per’s circumstellar nebula appears elongated in a NE/SW orientation similar to that for its OH and HO masers, while VX Sgr is embedded in a spheroidal envelope. We find no evidence for circumstellar nebulosity around the intermediate–type hypergiants Cas, HR 8752, HR 5171a, nor the normal M–type supergiant Cep. We conclude that there is no evidence for high mass loss events prior to 500-1000 yrs ago for these four stars.
1 Introduction
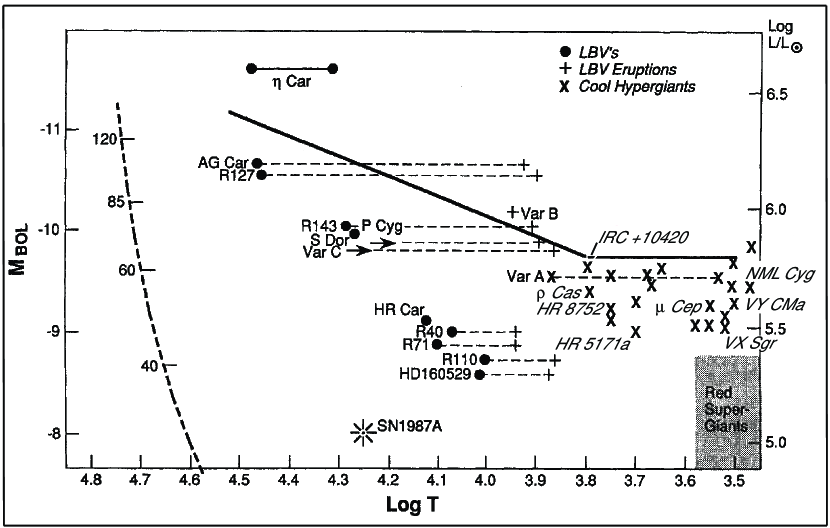
A few highly unstable, very massive stars lie on or near the empirical upper luminosity boundary in the HR diagram (Humphreys & Davidson, 1979, 1994; Humphreys, 1983, and Figure 1, this paper). These include the Luminous Blue Variables, the cool hypergiants, and even rarer objects, all related by high mass loss phenomena, sometimes violent, which may be responsible for the existence of the upper boundary. In this paper, we use the term ‘cool hypergiant’ for the stars that lie just below this upper envelope with spectral types ranging from late A to M. The cool hypergiants represent a very short-lived evolutionary stage, with time scales of only a few years, or less, as a red supergiant (RSG) and possibly as short as a few thousand years in transit from the main sequence to the red supergiant stage and back again to warmer temperatures. Very high mass loss rates have been measured for many of these stars. Recent observations of two of these stars, the warm OH/IR post-RSG IRC +10420 and the peculiar OH/IR M–type supergiant VY CMa, have yielded surprising results about their circumstellar environments, including evidence for asymmetric ejections and multiple high mass loss events (Humphreys et al., 1997; Smith et al., 2001; Humphreys, Davidson & Smith, 2002; Humphreys et al., 2005).
de Jager (1998) has suggested that most if not all of the intermediate temperature hypergiants are post-RSGs. In their post-RSG blueward evolution these very massive stars enter a temperature range (6000–9000 K) with increased dynamical instability, a semi-forbidden region in the HR diagram, that he called the “yellow void”, where high mass loss episodes occur. Based on information from our HST/STIS spectra of IRC +10420, we (Humphreys, Davidson & Smith, 2002) demonstrated that its wind is optically thick, and therefore concluded that its observed spectral changes are not due to rapid evolution, although the star may be about to shed its dense wind, cross the yellow void, and emerge as a warmer star. However, in contrast with IRC +10420, the evolutionary state of most of the cool hypergiants is not known. They may be evolving toward the RSG region or back to the blue side of the HR diagram after having lost considerable mass as RSGs. The post-RSG state for some of these stars (i.e Cas) is supported by a substantial overabundance of N and Na (Takeda & Takada-Hidai, 1994; El Eid & Champagne, 1995).
To better understand the evolution of cool, evolved stars near the upper luminosity boundary and the mass loss mechanisms that dominate the upper HR diagram, we obtained high resolution multi-wavelength images with HST/WFPC2 of seven of the most luminous known evolved stars - the M–type hypergiants, Cep (M2e Ia), S Per (M3-4e Ia), NML Cyg (M6 I), and VX Sgr (M4e Ia–M9.5 I), and the intermediate–type (F and G–type) hypergiants, Cas (F8p Ia), HR 8752 (G0-5 Ia) and HR 5171a (G8 Ia). The presence or lack of fossil shells, bipolar or equatorial ejecta, and other structures in their circumstellar environments will be a record of their current and prior mass loss episodes and provide clues to their evolutionary history. These stars were selected on the basis of their infrared emission, strong molecular emission, or peculiar spectroscopic variations to give us a snapshot of different steps in their evolution across the top of the HR Diagram. In the next section we describe the observations and data reduction procedures. In sections 3 and 4 we present the resulting images for each of these stars and their circumstellar environments. In the last section we discuss the implications for these stars’ mass loss histories and evolutionary states.
2 Observations and Analysis
The multi-wavelength images of these seven very luminous cool stars were obtained in late 1999 and early 2000 with the WFPC2 Planetary Camera on HST. The observations were planned to search for material close to the star as well as more distant nebulosity. Since we are interested in imaging faint ejecta associated with some relatively bright stars, we used a range of exposure times in each filter with the shortest to avoid saturation and minimize bleeding and the longest to detect faint emission. A variety of filters were chosen to look for changes, if any, in the circumstellar material at different wavelengths. For the OH/IR M–type hypergiants we used broad band Johnson-Cousins and medium band Strömgren filters (see Table 1). We used a combination of narrow band forbidden line filters for the intermediate–type hypergiants, as well as the normal M–type supergiant Cep. These narrow band filters were chosen mainly as continuum filters to limit the collected flux for the extremely visually bright stars. All but S Per were observed in H. We dithered our exposures with 2.5 pixel shifts in each direction on the detector in order to increase the standard PC sampling of 004555 pix by to 002277 pix. The observations are summarized in Table 1.
Prior to co-addition, the images were processed with STScI’s standard calibration using the most recent reference files. Multiple, dithered exposures allowed us to remove cosmic rays, bad pixels, and other effects during co-addition. We combined our images with the IRAF/STSDAS software package DITHER which uses drizzling (to recover image resolution from the pixel response of the camera while preserving photometric accuracy, Koekemoer et al. 2000; Fruchter & Hook 2002) and cross-correlation of sources in the field for relative alignment between dithered images. An added benefit of the DITHER package is that a short, underexposed image can be scaled by the relative exposure times and patched onto an overexposed image during the co-addition stage. We generally followed the process described by Humphreys et al. (1997) for patching underexposed point-spread functions (PSF) onto overexposed WFPC2 images. To determine the area in the long exposures to patch the PSFs, we masked the pixels that were saturated, showed signs of bleeding, or had a large percent difference from a median image. By doing this we were able to directly patch a non-saturated PSF onto the co-added image during the drizzling process. Elsewhere on a given image the short exposure is weighted significantly less than the long exposures so that its pixels are essentially ignored. The resulting “PSF-patched” image has both a higher resolution and a larger dynamic range increasing the likelihood of detecting bright material near the star and faint material far from the star. Our patched images have dynamic ranges for the PSF of up to , compared to , which is the maximum for a single non-saturated WFPC2 PC image where the background is dominated by read noise111This compares a PSF peak near saturation at 3500DN to a 3 sigma feature where the read noise of the CCD is 7e and the gain is 14e/DN..
To suppress the prominent HST diffraction spikes and rings of the bright stars in our program we used TinyTim222www.stsci.edu/software/tinytim PSFs for both subtraction and deconvolution (see Biretta et al. 2000, ch. 7). We subsampled the PSFs by to match the sampling of our drizzled images. We compared our images to several versions of these PSFs by including different combinations of the following: filter throughput, chip position, telescope focus, charge diffusion and the rms jitter of the spacecraft. For our medium and broad band filter observations we also included a model spectrum and an estimate of the interstellar reddening which is significant for many of our targets. The brightness of these sources lead to very high signal-to-noise PSFs in almost all cases. Consequently, differences between our observations and the TinyTim PSFs are apparent in both the subtraction and deconvolution residuals. These residual artifacts generally appear as rings or remnants of the bright diffraction spikes. We judged the quality of our subtractions and deconvolutions based on their chi-square fit (deconvolutions only), comparison with other point sources in the image, and the relative residuals between sources. Our ability to detect faint material near the star is limited by the quality of the PSF, and so we were careful to preserve PSF fidelity. We used both interpolation and super-sampled PSFs (5 higher sampling) separately to mitigate the effects of pixel phase in the shape of the PSF. Together these steps helped to minimize the subtraction and deconvolution residuals. NML Cyg, VX Sgr and S Per are extended and do not exhibit point-sources, and so PSF subtraction was not very illustrative. We deconvolved the PSF from our images with the IRAF/STSDAS task LUCY which uses the Richardson-Lucy technique (Richardson, 1972; Lucy, 1974; Snyder, 1990). Our images of NML Cyg, VX Sgr and S Per appeared sharper after deconvolution.
The final co-added, cleaned and PSF-patched images for the OH/IR M supergiants NML Cyg, VX Sgr and S Per (Figures 2, 7 and 8) show the presence of extended nebulosity, and are discussed individually in the next section. However, we find no evidence for extended structure around the intermediate–type hypergiants Cas, HR 8752, and HR 5171a and the normal M supergiant Cep. We will discuss the implications of these detections and non-detections on the evolutionary status of these stars in Sections 4 and 5.
3 The Circumstellar Environments of the M–type Hypergiants
NML Cyg, VX Sgr and S Per are powerful OH/IR supergiants with strong maser emission from OH, HO, and SiO plus large infrared excess radiation. Our images, the highest resolution images of these stars in visible light to date, show circumstellar material surrounding all three, but NML Cyg is the most intriguing with its asymmetric bean-like shape and the probable interaction between its strong wind and its interstellar environment due to its proximity to the Cyg OB2 association. We find no evidence in our images for circumstellar material around the normal M supergiant Cep (see Table 2), although like other RSGs Cep has a 10µm silicate emission feature due to dust. Weak K I emission has also been detected in its wind (Mauron, 1997) and in the winds of several other red giants and supergiants (Guilain & Mauron, 1996).
3.1 NML Cyg
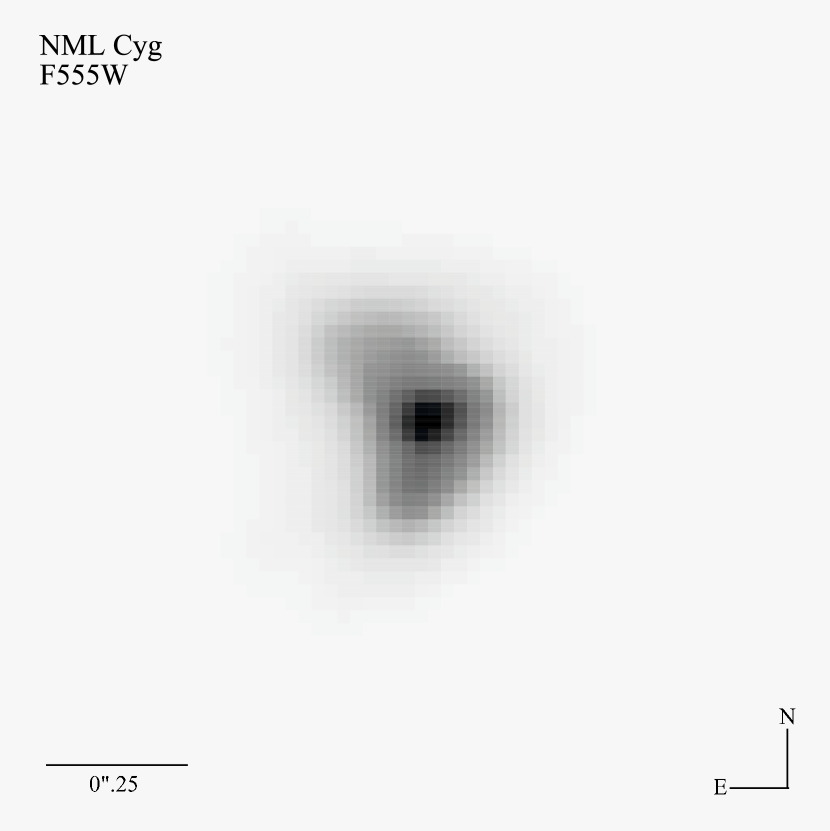
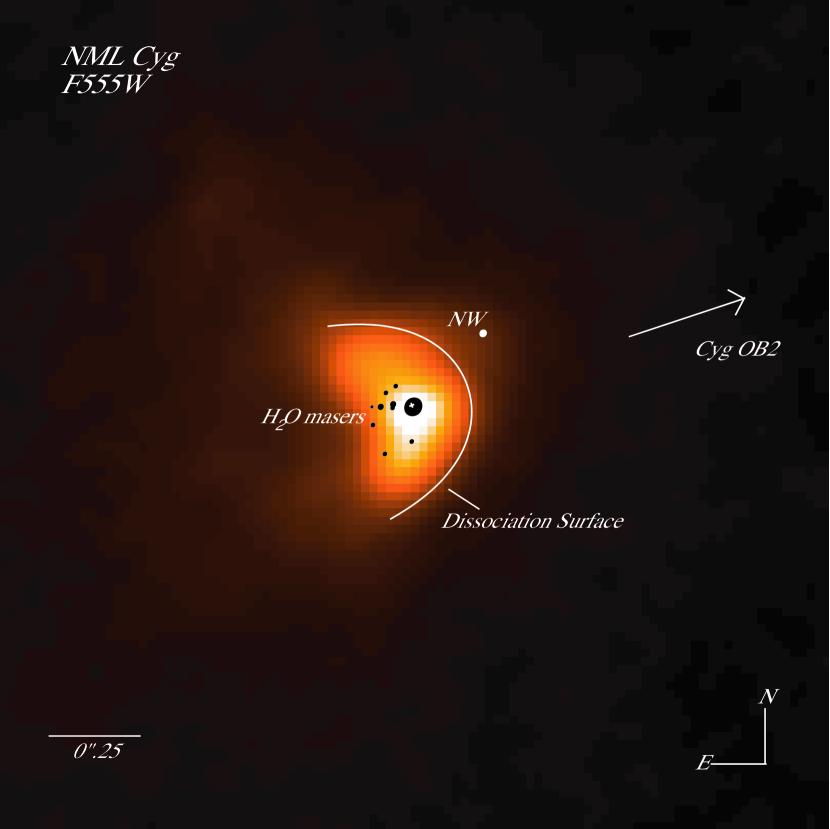
The powerful OH/IR source NML Cyg (M6 I) is approximately 1.7 kpc from the sun and pc from the large association Cyg OB2 in the X-ray emitting Cygnus X superbubble (Humphreys, 1978; Morris & Jura, 1983; Knödlseder, 2003). This distance places it near the empirical upper luminosity boundary for RSGs with a luminosity of () and a mass loss rate of (Hyland et al., 1972; Morris & Jura, 1983). Our WFPC2 images show that NML Cyg has a very obvious circumstellar nebula with a peculiar asymmetric shape; Figures 2 and 6 (deconvolved) show our F555W image. In addition to the asymmetric component to the nebula, there is a bright area that is roughly spherical and is most likely the location of the embedded star. There is little difference among the F555W, F656N and F675W images, but NML Cyg is too faint at blue wavelengths to be detected in our F439W exposure. There is no noticeable shift in position, nor any change in appearance of the obscured star with wavelength. The nebula also appears to be slightly lopsided about a line of symmetry that runs WNW/ESE, though we are unable to differentiate between instrumental effects and any true asymmetry at that level of signal. The nebulosity appears more diffuse to the North, though it is possible that this is due to blurring by a diffraction spike in the PSF. This blurring is still evident in the deconvolved image, and is not unexpected since the TinyTim PSF does not model the diffraction spikes well. The two columns of brighter pixels just to the South of the embedded star (bright spot) may be a result of a small amount of bleeding in the CCD (see Figure 2).
Monnier et al. (1997) and Blöcker et al. (2001) find that the dust around NML Cyg may be concentrated in one or more shells based on their infrared interferometry observations, with an inner radius of about 100 mas for the main dust shell. Both authors conclude that multiple shells are necessary to fit the observed profiles. Their outermost shells coincide with the outer edge of the visible nebula seen in our images (at a radius of ). Thus, it is likely that the emission that they detected is from the dust responsible for scattering the stellar light seen in our images.
Observations of NML Cyg by Masheder, Booth, & Davies (1974) show that the 1612 MHz OH masers extend up to from the star, and that the emission is elongated along a NW/SE axis with a position angle of about which has been confirmed by Benson & Mutel (1979), Diamond, Norris & Booth (1984), and others. The HO masers are much closer to the embedded star and show an asymmetric distribution to the SE (Richards, Yates & Cohen, 1996) similar in size to the optical reflection nebula (see Figure 6). Richards, Yates & Cohen (1996) have suggested that the NW/SE spatial distribution of the HO vapor masers may indicate a bipolar outflow with p.a. . Recent SiO ground state observations indicate a similar NW/SE axis, and an asymmetry in the emission towards the SE (Boboltz & Claussen, 2004, and private communication). It is also possible that the maser emission is tracing an asymmetric, episodic outflow that may be reminiscent of the arcs and other structures seen in the circumstellar nebula surrounding VY CMa (Smith et al., 2001). Given their asymmetric, one-sided distribution within NML Cyg’s nebula, one possible explanation is that the masers are protected by the star’s envelope from Cyg OB2’s radiation as discussed below.
There are remarkable similarities between the asymmetric envelope that we see and the much more distant ( from the star) 21 cm ionized hydrogen (H II) contours around NML Cyg observed by Habing, Goss & Winnberg (1982). Morris & Jura (1983) showed that the asymmetric “inverse” H II region was the result of the interaction of a spherically symmetric, expanding wind from NML Cyg and photo-ionization from plane parallel Lyman continuum photons from the luminous, hot stars in the nearby association Cyg OB2 (see Figures 1 and 2 in Morris & Jura). They described the interaction by balancing the incident ionizing flux against recombinations and atoms lost from the star. The 21 cm “emission measure” along the computed ionization surface (projected along the observer’s line-of-sight) convolved with the telescope beam from Habing, Goss & Winnberg produced normalized contours that closely matched the observed H II region (see their Figure 2). Morris & Jura demonstrated that the strength of the Lyman continuum flux from Cyg OB2 and the density of atomic hydrogen around NML Cyg are sufficient to produce the observed 21 cm emission.
The presence of ionized hydrogen surrounding an M supergiant like NML Cyg was somewhat of an enigma. To explain its presence, Morris & Jura suggested that the molecular material in the wind is photo-dissociated closer to the star so that it does not shield the atomic hydrogen from the ionizing photons (from Cyg OB2) farther out. They estimated the number of dissociating photons emitted by Cyg OB2 as roughly equal to or greater than the number of Lyman continuum photons ( cms, Morris & Jura 1983, and recently increased by a factor of 2 by Knödlseder 2003). The dissociation boundaries for HO, OH, and other molecules are expected to be closer to NML Cyg than the ionization surface. In other words, within the Cygnus X superbubble, UV photons are able to survive the roughly 100 pc journey from Cyg OB2 to NML Cyg. The Lyman continuum photons, eV, will be attenuated from the UV flux by the ionization front farther out from NML Cyg leaving the less energetic photons to dissociate the molecular material closer in.
Our images show circumstellar material much closer to NML Cyg than the surrounding H II region and coincident with the water masers (see Figure 6), as well as SiO masers, suggesting that we are likely imaging the photo-dissociation boundaries. We propose that the shape of the envelope seen in our WFPC2 images is the result of the interaction between the molecular outflow from NML Cyg and the near–UV continuum flux from Cyg OB2, i.e. analogous to an “inverse Photo-Dissociation Region” (PDR). To test our hypothesis we assume that the expansion of the envelope is spherically symmetric and that the near–UV flux, (cmsec), from Cyg OB2 is plane-parallel. We assume that the fraction of photons that photo-dissociate is , with the net dissociating flux equal to . We then calculate the relationship between the radial distance to the dissociation surface and position angle from the direction of the incident flux by balancing the incoming radiation against the molecular outflow:
| (1) |
where (s) is the number of molecules per second lost from the star, and is the angle between the radius vector and the tangent to the dissociation surface () (see Figure 4). The factor projects the incident flux onto the dissociation surface. Rearranging eq. (1), and noting that we obtain:
| (2) |
with the initial condition at . We insert in eq. (2) the minimum separation between the star and the dissociation surface and find the solution:
| (3) |
To estimate the rate that molecules are lost from NML Cyg we use . We take the dissociating near–UV flux below 13.6 eV, with , to be of the order of cms based on Morris & Jura (1983)’s reasoning and estimated Lyman continuum flux (revised by Knödlseder, 2003). In order to get an estimate for the size scale for the dissociation surfaces, , we use the radial profile shown in Figure 3. The profile is taken as a wedge in the direction of Cyg OB2. We find that two components are necessary to fit the observed shape of the profile, one for the embedded star (a gaussian, FWHM=4.7 pix, convolved with the PSF) and another for the asymmetric nebula (a gaussian, FWHM=9.4 pix, convolved with the PSF). We adopt , the FWHM/2 of the fit to the asymmetric nebula, as the size scale for the dissociation boundaries. This corresponds to about 170 AU at NML Cyg’s distance. From this we find a good order-of-magnitude estimate of , or about assuming an average mass of . This may be a lower limit since we have neglected the increased density of the maser emission.
The solution for the dissociation surface in eq. (3) is plotted in Figure 4 as it would be seen edge-on (solid curve), along with a projection of the surface that is inclined from our line-of-sight by (dot-dashed curve). If NML Cyg and Cyg OB2 are interacting, the inclination of the envelope will be roughly in the range (edge-on +/- ). For inclinations that are nearly face-on their separation quickly becomes unrealistically large for the interaction to take place and the projected shape becomes more circular. Our model is consistent with the latter in the sense that the projected surface becomes nearly circular in appearance when viewed face-on, and no longer reproduces the observed asymmetric shape. Even with the high-resolution of our WFPC2 images, we are unable to further constrain the range of inclinations for NML Cyg’s circumstellar envelope (compare the dot-dashed curve to the solid curve in Figure 4). Figure 5 shows the relative positions on the sky between NML Cyg and Cyg OB2. The relatively large angular size of Cyg OB2 as viewed from NML Cyg means that the incident UV flux is not truly plane parallel. The net effect of this would be to reshape the dissociation surface in Figure 4; making it more pointed along the direction of the incident flux, though the projected shape would still be nearly circular for low inclinations. With regards to the separation between NML Cyg and Cyg OB2 ( on the sky), an inclination of (edge-on) corresponds to about 80 pc at Cyg OB2’s distance. The range of inclinations above allows for a maximum linear separation of up to pc, and grows to nearly 500 pc for an inclination of . As an aside, if NML Cyg is assumed to be closer than Cyg OB2, then it’s distance could be as little as pc. This is near the high end of Danchi et al. (2001)’s independent distance estimate of 1220 +/- 300 pc for NML Cyg based on Doppler-measured maser velocities.
It is worth mentioning that radiation and/or gas pressure are insufficient to mold the reflection nebula into the shape that we observe. However, we can show that the incident UV flux will destroy the dust grains embedded in the nebula, shaping their distribution in the nebula along the dissociation surface.
Stochastic heating is one method that is capable of heating the grains to sufficiently high temperatures for sublimation to occur. At a distance of from NML Cyg, the blackbody temperature of a grain will be about 600 K, or even higher for non-perfect emitters. When a photon with sufficient energy is absorbed by a grain there will be a sharp increase in that grain’s temperature that can be calculated from the heat capacity per volume for silicate grains: ergs Kcm (Draine & Anderson, 1985, for K). Dust destruction will take place if this increase is enough to raise the temperature above the sublimation limit. If we assume a rod-like geometry for the grains (more plausible than an idealized spherical grain), with a length and a length to thickness ratio of , then the rise in temperature from each photon is approximately:
| (4) |
where is the energy carried by each photon. A 70Å long grain that absorbs a 10 eV photon will increase its temperature by 400 K. Larger (Å) non-porous grains will not be significantly heated by this method. Even without such drastic heating, however, grain destruction may still take place slowly through other processes such as sputtering, charging (stripping the grain of charge with each photon absorption, leading to a net repulsive coulomb force that could break the grain apart), or chemical sputtering (erosion through chemical reaction with H, N, and O). These processes could erode the larger grains sufficiently that stochastic heating becomes significant. If the grain temperature in NML Cyg’s wind is 600 K or higher, then these combined processes will be efficient in breaking up the grains outside the photo-dissociation region.
The net result is a model for NML Cyg’s circumstellar nebula that has a layered structure of photo-dissociation boundaries. Outside each dissociation surface there are fewer molecules absorbing Cyg OB2’s near–UV photons, which leaves the dust grains unprotected, and thus more likely to be destroyed. The rapid decline of dust density outside the photo-dissociation region may explain the decline in the observed amount of scattered light along the bean-shaped surface that is remarkably similar to the shape shown in Figure 4.
Alternatively, it is also possible that the near–UV photons are absorbed by the gas, heating it and resulting in a gas expansion front. The resulting acceleration (albeit small) would cause a drop in the density. If the dust were somehow accelerated by the gas (the reverse of what is normally expected for dust driven winds), then there would also be a corresponding drop in the dust density.
In Figure 6 we show the edge-on dissociation surface superimposed on our deconvolved F555W image. For display purposes, we placed the dissociation surface near the contour of the reflection nebula’s edge with the axis of symmetry aligned with the direction of Cyg OB2’s center, E of N (at : 203310, : +41°12, determined by Knödlseder 2000). We assume that the embedded star is near the peak intensity in our images, which is located at : 204625573, : +40°070027 (HST WCS J2000). To get the best match when overlaying the dissociation surface on the optical image, we shifted the apparent position of the star by about 1 pixel to the North, indicated by the small white cross near the center. Figure 6 also shows the brightest of the integrated 22 GHz HO features superimposed on our F555W image. Richards, Yates & Cohen (1996) chose as their reference for NML Cyg’s location the integrated 22 GHz maser maximum. Therefore, we established the relative coordinate system offsets by aligning the strongest water vapor maser with the white cross. The spot size assigned to each maser is roughly proportional to its flux. The overall distribution of the masers matches the size of the bright nebulosity seen in our images, with the notable exception of the NW maser. There is some diffuse signal in the area around the NW maser in our deconvolved image, although we are unable to distinguish if the low-level signal is associated with the NW maser or is a residual PSF artifact that remains after deconvolution. Note that the NW/SE symmetry axis in the maser maps is not in the direction of Cyg OB2.
It is especially interesting that the asymmetric one-sided distribution of the water masers is not only similar in extent to the reflection nebula, but also matches its convex shape. The dusty cocoon engulfing NML Cyg must be the consequence of high mass loss in the RSG stage, but its envelope has most likely been shaped by its interaction with and proximity to Cyg OB2. If the outflow from NML Cyg is bipolar (Richards, Yates & Cohen, 1996), then it appears that the molecular material SE of the star is preferentially shielded from photo-dissociation. Even without assuming bipolarity, there is more maser emission to the ESE, consistent with our model for NML Cyg’s circumstellar envelope.
3.2 VX Sgr
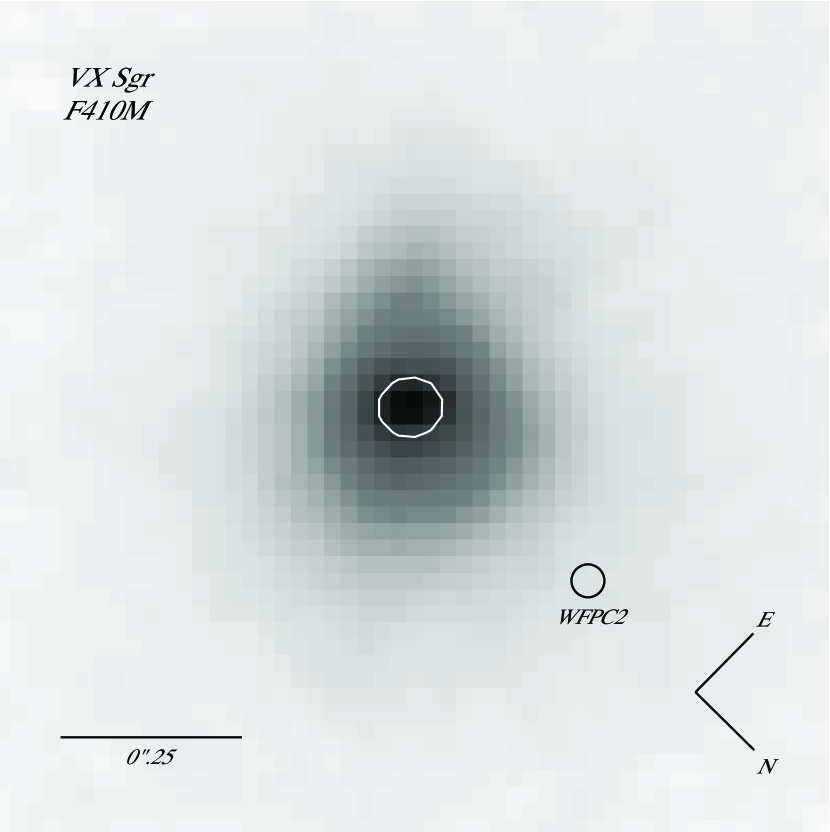
The semi-regular supergiant VX Sgr is a well studied OH/IR source whose spectral type varies from M4e Ia to as late as M9.5 I (Humphreys & Lockwood, 1972), and has been reported as late as M9.8 (Lockwood & Wing, 1982). The amplitude of the light variations in may reach 6 mag (Lockwood & Wing). Our images were taken when VX Sgr was nearing maximum light in late 1999. Its distance is not well known, but assuming it is a member of the Sgr OB1 association it is most likely in the inner spiral arm, between 1.5 to 2 kpc from the Sun (Humphreys, Strecker & Ney, 1972). Our images of VX Sgr show that it is embedded in an envelope that is only slightly resolved (Figure 7, compared to the WFPC2 PSF FWHM). There is little difference between our images, however, the F410M image was not saturated and so did not need to be PSF-patched. The extended envelope is nearly symmetric with a FWHM of , approximately 150 AU at VX Sgr’s distance.
Danchi et al. (1994) estimate the inner radius of the dust shell to be at . When combined with our measurements, we find that VX Sgr’s circumstellar envelope is a shell that is about 50 AU thick. Observations of the the HO and SiO masers show that they are from the star, whereas the OH masers extend out (Lane, 1984; Chapman & Cohen, 1986).
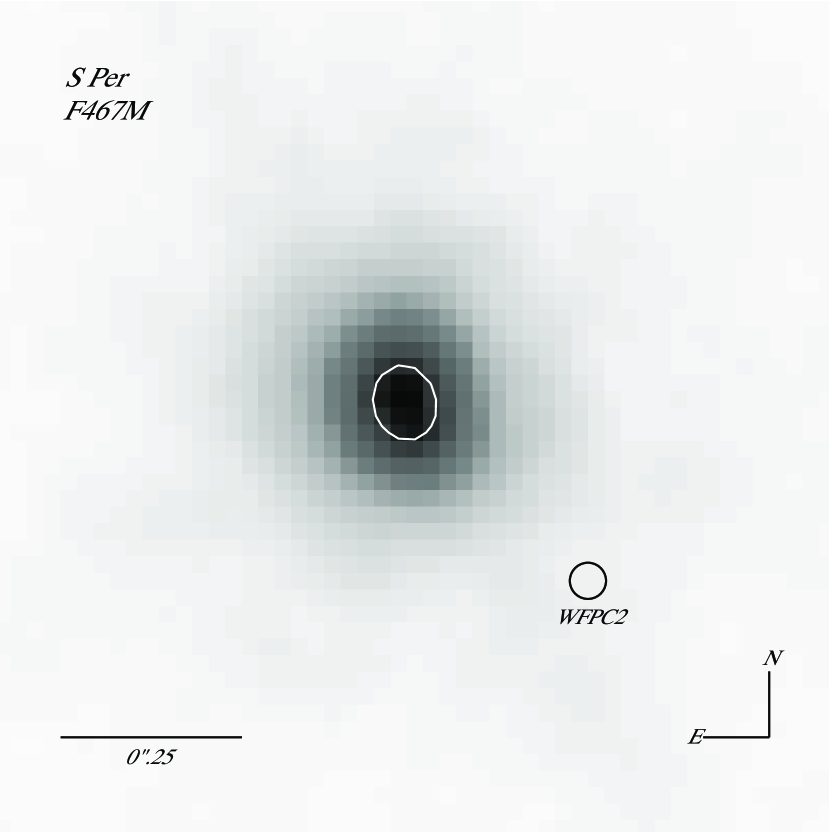
3.3 S Per
The RSG S Per (M3-4e Ia) is another well studied OH/IR source that is a known member of the Perseus OB1 association at a distance of 2.3 kpc (Humphreys, 1978). Our images show a star embedded in a circumstellar nebula (Figure 8). The envelope is across (FWHM), approximately 230 AU at S Per’s distance, and appears elongated along a NE/SW axis. Figure 8 shows the F467M image, with the best PSF-patch, together with the WFPC2 PSF FWHM. The other images are very similar. The asymmetry in the envelope could be explained by bipolarity in the ejecta or a flattened circumstellar halo.
Recent OH and HO maser observations have shown an elongated structure around S Per in good agreement with our images. Figure 1 from Richards, Yates & Cohen (1999) shows an elongated distribution for the integrated 22 GHz HO maser emission whose extent and symmetry axis match those seen in our images. The OH masers are more extended than the HO masers, and in Richards, Yates & Cohen’s Figure 5 they show some indication of a NE/SW axis. However, the OH mainline masers are more clustered, as compared to the 1612 MHz masers, with a handful of them more randomly dispersed, mainly to the North. Vlemmings, Diamond & van Langevelde (2001) also find that the water masers have a similar distribution to that of Richards, Yates & Cohen’s observations. Earlier work by Diamond et al. (1987) indicate a more E/W axis for water masers.
4 The Intermediate–type Hypergiants
Our imaging program also included three very luminous intermediate type hypergiant stars that are all well known for their records of spectroscopic and photometric variability.
Cas is the best known of this group and is famous for its historical and recent “shell” episodes (Bidelman & McKellar, 1957; Beardsley, 1961; Boyarchuk et al., 1988; Lobel et al., 2003) during which it temporarily develops TiO bands in a cool, optically thick wind with a very brief but high mass loss rate ( in 200 days, Lobel et al. 2003). After each of these events the star quickly returns to its F supergiant spectrum. Lobel et al. (2003) showed that prior to its recent episode (2000-01), Cas displayed photometric variability indicative of pulsational instability. The first infrared observations surprisingly did not show any evidence for dust, but IRAS observations showed that dust had formed sometime between 1973 and 1983 (Jura & Kleinmann, 1990), in the expanding and cooling gas presumably from its 1946 episode. By 1989 the IR excess had weakened due to the dissipation and cooling of the grains as the shell expanded. With an expansion velocity of 35–40 km s the shell should now be at from the star at its approximate distance of 2.5 kpc.
HR 8752‘s atmospheric variations have been thoroughly discussed in a series of papers by de Jager and collaborators (de Jager & Nieuwenhuijzen, 1997; de Jager, Israelian & Lobel, 1997; de Jager, 1998). It has a very high mass loss rate and apparent temperature changes of 1000 K or more (Israelian, Lobel & Schmidt, 1999), possibly due to small changes in its wind or envelope. Like Cas it does not have a large IR excess, nor is it known to have any molecular emission, although circumstellar CO lines have been reported.
HR 5171a is spectroscopically similar to HR 8752, but has a very prominent 10 m silicate feature (Humphreys, Strecker & Ney, 1971). Visual photometry of HR 5171a shows that it has been slowly getting fainter and redder (van Genderen, 1992) perhaps due to increased opacity in its wind or increased obscuration by dust.
Though these stars were excellent candidates to search for circumstellar material, we detect no evidence for shells or other ejecta. Our PSF subtractions and deconvolutions have a detection limit of approximately 5–7.5 magnitudes, or about 100 to 1000 times, fainter than the stars at an angular separation of about . Farther from the star the detection limit decreases, as there is less light in the wings of the PSF that can overwhelm any possible faint signal, and the background of the WFPC2 PC images are dominated by read noise from the stars. The angular radius from the star where the PSF contributes no more light, and read noise dominates, is given as in Tables 2 and 3. The brightness limits () corresponding to the read noise, along with the radius at which these limits take effect, are given in Table 2 for these stars and Table 3 for the M supergiants in Section 3. Of course, it may be that any nebulosity around these stars is too faint to be detected with our methods.
We have also estimated how long it would take a hypothetical shell of material ejected with constant velocity (e.g. in a shell outburst, or other episodic high mass loss event) to reach a separation of from the star (Table 4). These expansion times are calculated for both a typical hypergiant wind velocity () and a typical velocity for the violet wing of a P-Cygni profile () (e.g. see Lobel et al., 2003; Israelian, Lobel & Schmidt, 1999). The expansion time estimates in Table 4 indicate that Cas, HR 8752, and HR 5171a have been losing mass at prodigious rates for no more than about yrs. We find no evidence for high mass loss events prior to 500-1000 yrs ago for these stars. If there has been any since, then the ejecta is too faint to detect given our detection limits.
5 Mass Loss Histories and Evolutionary Status
Our original goal for this program of high resolution imaging and spectroscopy of the cool hypergiant stars using both the HST and ground based telescopes was to explore the evolutionary status and mass loss histories of these very luminous and unstable stars. Only the post-RSG IRC +10420 (Humphreys et al., 1997; Humphreys, Davidson & Smith, 2002) and the powerful OH/IR M supergiant VY CMa (Smith et al., 2001; Smith, 2004; Humphreys et al., 2005) have extensive circumstellar ejecta that has obviously been formed over hundreds of years including discrete high mass loss events.
As mentioned in the introduction, most of the stars on this program were selected because of their evidence for high mass loss and observed instabilities. Compared with VY CMa and IRC +10420, our results for the M–type supergiants were somewhat surprising. The relatively normal but highly luminous M supergiant Cep was on our observing program primarily for comparison with the high mass losing OH/IR M supergiants, S Per, VX Sgr and NML Cyg. Cep’s point-source appearance suggests that it has not yet entered the high mass loss and high dust formation period represented by the OH/IR sources that may occur near the end of their RSG stage. The circumstellar envelopes of VX Sgr and S Per are comparable to the expected extent of the region where dust would form for each star. NML Cyg has more significant nebulosity, apparently shaped by the UV radiation of the nearby hot stars in Cyg OB2. NML Cyg is optically obscured, but it is in a unique environment. It is possible that NML Cyg’s circumstellar material has been largely dissipated by the winds and radiation pressure inside the Cygnus X bubble after being photo-ionized and dissociated by the UV radiation from Cyg OB2. If NML Cyg were not located in such close proximity to Cyg OB2, it might show a much more extended nebula comparable to VY CMa.
NML Cyg, VX Sgr, S Per, and VY CMa are all very luminous RSGs and strong OH/IR sources with high mass loss rates. However, VY CMa’s mass loss rate is about ten times higher than that of the other three stars. Thus, it may be in a unique high mass loss stage that the others will eventually pass through. Given the resemblance of VY CMa’s circumstellar environment to that of IRC +10420, it is tempting to think that VY CMa is emerging from the optically thick cocoon that hides many of the OH/IR stars and is about to leave the RSG region on a blueward track as a yellow hypergiant, although there are questions about the origin of VY CMa’s diffuse nebulosity, see Humphreys et al. 2005. But then, why do the other yellow hypergiants, such as Cas, not have circumstellar nebulae if they have formerly been red supergiants with high mass loss episodes as OH/IR supergiants?
At this time, our results suggest that Cas, HR 8752, and HR 5171a appear to be point-sources and there is no evidence for distant nebulosity. However, these stars are in a dynamically unstable region of the HR diagram (de Jager, 1998; Humphreys, Davidson & Smith, 2002). Their high mass loss rates () and spectroscopic and photometric variability confirm that they are unstable (Israelian, Lobel & Schmidt, 1999), although their continuous mass loss rates are also about 10 times less than in IRC +10420. The lack of readily apparent ejecta associated with these stars suggests that if they are post-RSGs, they have only recently encountered this unstable region in their blueward evolution, and a star like Cas with its multiple shell ejection episodes may eventually resemble IRC +10420. However, the lack of more distant nebulosity or fossil shells from a previous RSG state like that of S Per or VX Sgr suggests that there has either been sufficient time for the material to dissipate or perhaps an extensive nebula like that around VY CMa, or even NML Cyg, never formed. We also note that these three stars are somewhat less luminous than IRC +10420 (and VY CMa), and therefore may have a lower initial mass leading to a net lower mass loss rate. We also must consider the possibility that the extensive nebulae and the evidence for discrete and localized high mass loss events observed in the ejecta of VY CMa and IRC +10420 may be triggered by instabilities encountered at their somewhat higher masses and luminosities; that is, in stars closer to the upper luminosity boundary.
References
- Beardsley (1961) Beardsley, W.A. 1961, ApJS, 5, 381
- Benson & Mutel (1979) Benson, J.M. & Mutel, R.L. 1979, ApJ, 233, 119
- Bidelman & McKellar (1957) Bidelman, W.P. & McKellar, A. 1957, PASP, 69, 31
- Biretta et al. (2000) Biretta, J.A. et al. 2000, WFPC2 Instrument Handbook, Version 5.0 (Baltimore:STScI)
- Blöcker et al. (2001) Blöcker, T., Balega, Y., Hofmann, K.-H., & Weigelt, G. 2001, A&A, 369, 142
- Boboltz & Marvel (2000) Boboltz, D.A. & Marvel, K.B. 2000, ApJ, 545, L149
- Boboltz & Claussen (2004) Boboltz, D.A. & Claussen, M.J. 2004, BAAS, 36, 1226
- Boyarchuk et al. (1988) Boyarchuk, A.A., Boyarchuk, M.E., & Petrov, P.P. 1988, Tartu AstroFuus Obs. Treated, 92, 40
- Chapman & Cohen (1986) Chapman, J.M. & Cohen, R.J. 1986, MNRAS, 220, 513
- Danchi et al. (1994) Danchi, W.C., Bester, M., Degiacomi, C.G. et al. 1994, AJ, 107, 1469
- Danchi et al. (2001) Danchi, W.C., Green, W.H., Hale, D.D.S. et al. 2001, ApJ, 555, 405
- Davies, Masheder & Booth (1972) Davies, R.D., Masheder, M.R.W., & Booth, R.S. 1972, Nature Phys. Sci., 237, 21
- de Jager & Nieuwenhuijzen (1997) de Jager, C., & Nieuwenhuijzen, H. 1997a, MNRAS, 290, L50
- de Jager, Israelian & Lobel (1997) de Jager, C., Israelian, G. & Lobel, A. 1997b, A&A, 325, 714
- de Jager (1998) de Jager, C. 1998, A&A Rev., 8, 145
- Diamond, Norris & Booth (1984) Diamond, P.J., Norris, R.P., & Booth, R.S. 1984, MNRAS, 207, 611
- Diamond et al. (1987) Diamond, P.J., Johnston, K.J., Chapman, J.M. et al. 1987, A&A, 174, 95
- Draine & Anderson (1985) Draine, B.T. & Anderson, N. 1985, ApJ, 292, 494
- El Eid & Champagne (1995) El Eid, M.F. & Champagne, A.E. 1995, ApJ, 451, 298
- Fruchter & Hook (2002) Fruchter, A.S. & Hook, R.N. 2002, PASP, 114, 144
- Greenhill et al. (1995) Greenhill, L.J., Colomer, F., Moran, J.M. et al. 1995, ApJ, 449, 365
- Guilain & Mauron (1996) Guilain, C. & Mauron, N. 1996, A&A, 314, 585
- Habing, Goss & Winnberg (1982) Habing, H.J., Goss, W.M., & Winnberg, A. 1982, A&A, 108, 412
- Hanson (2003) Hanson, M.M. 2003, ApJ, 597, 957
- Herbig (1974) Herbig, G.H. 1974, ApJ, 189, 75
- Humphreys, Strecker & Ney (1971) Humphreys, R.M., Strecker, D.W. & Ney, E.P. 1971, ApJ, 167, L35
- Humphreys & Lockwood (1972) Humphreys, R.M. & Lockwood, G.W. 1972, ApJ, 172, L59
- Humphreys, Strecker & Ney (1972) Humphreys, R.M., Strecker, D.W. & Ney, E.P. 1972, ApJ, 172, 75
- Humphreys (1978) Humphreys, R.M. 1978, ApJS, 38, 309
- Humphreys & Davidson (1979) Humphreys, R.M. & Davidson, K. 1979, ApJ, 232, 409
- Humphreys (1983) Humphreys, R.M. 1983, ApJ, 269, 335
- Humphreys & Davidson (1994) Humphreys, R.M. & Davidson, K. 1994, PASP, 106, 1025
- Humphreys et al. (1997) Humphreys, R.M., Smith, N., Davidson, K. et al. 1997, AJ, 114, 2778
- Humphreys, Davidson & Smith (2002) Humphreys, R.M., Davidson, K., & Smith, N. 2002, AJ, 124, 1026
- Humphreys et al. (2005) Humphreys, R.M., Davidson, K., Ruch, G., & Wallerstein, G. 2005, AJ, 129, 492
- Hyland et al. (1972) Hyland, A.R., Becklin, E.E., Frogel, J.A., & Neugebauer, G. 1972, A&A, 16, 204
- Israelian, Lobel & Schmidt (1999) Israelian, G., Lobel, A., & Schmidt, M.R. 1999, ApJ, 523, L145
- Jones et al. (1993) Jones, T.J., Humphreys, R.M., Gehrz, R.D. et al. 1993, ApJ, 411, 323
- Jura & Kleinmann (1990) Jura, M. and Kleinmann, S. G. 1990, Ap.J. 351, 583
- Knödlseder (2000) Knödlseder, J. 2000, A&A, 360, 539
- Knödlseder (2003) Knödlseder, J. 2003, IAU Symp. 212, A Massive Star Odyssey, from Main Sequence to Supernova, eds. K.A. van der Hucht, A. Herrero & C. Esteban, 505
- Koekemoer et al. (2000) Koekemoer, A.M. et al. 2000, HST Dither Handbook, Version 1.0 (Baltimore:STScI)
- Lane (1984) Lane, A.P. 1984, IAU Symp. 110, VLBI and Compact Radio Sources, eds. R. Fabnti, K. Kellermann, & G. Setti (Reidel:Dordrecht), 329
- Lobel et al. (2003) Lobel, A., Dupree, A.K., Stefanik, R.P. et al. 2003, ApJ, 583, 923
- Lockwood & Wing (1982) Lockwood, G.W. & Wing, R.F. 1982, MNRAS, 198, 385
- Lucy (1974) Lucy 1974, AJ, 79, 745
- Masheder, Booth, & Davies (1974) Masheder, M.R.W., Booth, R.S., & Davies, R.D. 1974, MNRAS, 166, 561
- Mauron (1997) Mauron, N. 1997, A&A, 326, 300
- Monnier et al. (1997) Monnier, J.D., Bester, W.C., Danchi, W.C. et al. 1997, ApJ, 481, 420
- Morris & Jura (1983) Morris, M. & Jura, M. 1983, ApJ, 267, 179
- Richards, Yates & Cohen (1996) Richards, A.M.S., Yates, J.A., & Cohen, R.J. 1996, MNRAS, 282, 665
- Richards, Yates & Cohen (1999) Richards, A.M.S., Yates, J.A., & Cohen, R.J. 1999, MNRAS, 306, 954
- Richardson (1972) Richardson 1972, J. Opt. Soc. Am., 62, 55
- Smith et al. (2001) Smith, N., Humphreys, R.M., & Davidson, K. et al. 2001, AJ, 121, 1111
- Smith (2004) Smith, N. 2004, MNRAS, 349, L31
- Snyder (1990) Snyder 1990, in Restoration of HST Images and Spectra, STScI Workshop Proceedings
- Takeda & Takada-Hidai (1994) Takeda, Y. & Takada-Hidai, M. 1994, PASJ, 46, 395
- van Genderen (1992) van Genderen, A.M. 1992, A&A, 257, 177
- Vlemmings, Diamond & van Langevelde (2001) Vlemmings, W., Diamond, P., & van Langevelde, H.J. 2001, A&A, 375, L1


| Star | Filter | (Å)aaBiretta et al. (2000) | (Å)aaBiretta et al. (2000) | Exposures (s) |
|---|---|---|---|---|
| NML Cyg | F439W | 4292.6 | 473.2 | 6500ddNo detection |
| F555W | 5336.8 | 1228.4 | 20, 100, 4400 | |
| F656N | 6563.8 | 21.5 | 20, 2260 | |
| F675W | 6677.4 | 866.8 | 0.5, 10 | |
| VX Sgr | F410M | 4085.7 | 146.8 | 260 |
| F467M | 4667.7 | 166.5 | 10, 260ccSaturated | |
| F547M | 5467.8 | 483.2 | 0.23, 26ccSaturated | |
| F656N | 6563.8 | 21.5 | 5ccSaturated | |
| S Per | F410M | 4085.7 | 146.8 | 20, 2200ccSaturated |
| F467M | 4667.7 | 166.5 | 3, 230ccSaturated | |
| F547M | 5467.8 | 483.2 | 0.11, 25ccSaturated | |
| Cep | F375N | 3732.2 | 24.4 | 10, 2100ccSaturated |
| F437N | 4369.1 | 25.2 | 0.5, 25ccSaturated | |
| F502N | 5012.4 | 26.9 | 0.11, 1ccSaturated, 25ccSaturated | |
| F656N | 6563.8 | 21.5 | 0.11ccSaturated | |
| HR 5171a | F375N | 3732.2 | 24.4 | 2300bbNo dithering |
| F437N | 4369.1 | 25.2 | 2, 226 | |
| F502N | 5012.4 | 26.9 | 0.2, 25ccSaturated | |
| F656N | 6563.8 | 21.5 | 0.5ccSaturated | |
| HR 8752 | F375N | 3732.2 | 24.4 | 5, 280ccSaturated |
| F437N | 4369.1 | 25.2 | 0.11, 25ccSaturated | |
| F502N | 5012.4 | 26.9 | 0.11, 21.4ccSaturated | |
| F656N | 6563.8 | 21.5 | 0.11, 0.5ccSaturated | |
| Cas | F375N | 3732.2 | 24.4 | 5, 230ccSaturated |
| F437N | 4369.1 | 25.2 | 0.2, 210ccSaturated | |
| F502N | 5012.4 | 26.9 | 0.11, 1ccSaturated, 25ccSaturated | |
| F656N | 6563.8 | 21.5 | 0.11, 1ccSaturated |
| Cas | HR 8752 | HR 5171a | Cep | ||||||||
|---|---|---|---|---|---|---|---|---|---|---|---|
| aaergs seccmÅsr | aaergs seccmÅsr | aaergs seccmÅsr | aaergs seccmÅsr | ||||||||
| F656N | 32 | 1.2 | 16 | 1.9 | 14 | 1.9 | 23 | 8.5 | |||
| F502N | 34 | 2.7 | 30 | 9.3 | 14 | 2.6 | 32 | 2.7 | |||
| F437N | 23 | 3.3 | 23 | 6.4 | 11 | 1.2 | 23 | 6.7 | |||
| F375N | 17 | 4.2 | 30 | 1.6 | 09 | 3.1 | 16 | 1.2 | |||
| NML Cyg | VX Sgr | S Per | ||||||
|---|---|---|---|---|---|---|---|---|
| aaergs seccmÅsr | aaergs seccmÅsr | aaergs seccmÅsr | ||||||
| F656N | 08 | 1.9 | 16 | 1.9 | ||||
| F675W | 09 | 1.8 | ||||||
| F555W | 27 | 2.0 | ||||||
| F547M | 28 | 5.7 | 26 | 6.9 | ||||
| F467M | 24 | 3.1 | 19 | 6.3 | ||||
| F410M | 13 | 5.6 | 19 | 3.4 | ||||
| Cas | HR 8752 | HR 5171a | |||
|---|---|---|---|---|---|
| Distance (kpc)aaHumphreys (1978) | 2.5 | 3.5 | 3.3 | ||
| (″) | 1.7–3.4 | 1.6–3.0 | 0.9–1.4 | ||
| (km s) | 35 | 35 | 35 | ||
| (yr) | 575–1150 | 760–1420 | 400–625 | ||
| (km s) | 100 | 100 | 100 | ||
| (yr) | 200–400 | 265–500 | 140–220 |
Note. — The expansion times are for a hypothetical shell of material ejected with constant velocity to reach a separation of from the star at which we measure the detection limits given in Tables 2 and 3. The times and correspond to typical hypergiant wind velocities and P-Cygni profile velocities, respectively.