Mira variables in the Galactic bulge with OGLE-II data
Abstract
We have extracted a total of 1968 Mira variables from the Optical Gravitational Lensing Experiment II (OGLE-II) data base in the Galactic bulge region. Among them, 1960 are associated with 2 Micron All-sky Survey (2MASS) sources, and 1541 are further identified with Midcourse Space Exploration (MSX) point sources. Their photometric properties are compared with those of Mira variables in the Large and Small Magellanic Clouds. We have found that mass-losing stars with circumstellar matter are reddened such that the colour dependence of the absorption coefficient is similar to that of interstellar matter. We also discuss the structure of the bulge. The surface number density of the bulge Mira variables is well correlated with the 2.2-m surface brightness obtained by the Cosmic Background Explorer (COBE) satellite. Using this relation, the total number of Mira variables in the bulge is estimated to be about 6 . The - relation of the Mira variables gives their space distribution which supports the well-known asymmetry of the bar-like bulge.
keywords:
stars: AGB and post-AGB – stars: mass-loss – stars: variables: other – Galaxy: bulge – Galaxy: structure – infrared: stars.1 INTRODUCTION
Mira variables are believed to be in the last stage of Asymptotic Giant Branch (hereafter AGB) evolution. They have larger amplitudes (e.g. mag in -band) than other red variables, i.e. semi-regular variables or irregular variables. As a result of the short lifetimes of Mira variables, one needs a rather large population of stars to find a sufficient number of Mira variables to perform a statistical study on them. This means that a large area should be observed repeatedly for a long enough duration to cover several pulsational periods, usually a hard task to do. However, the situation has been changed in the last decade by the gravitational microlensing search projects: Optical Gravitational Lensing Experiment (OGLE; Udalski, Kubiak & Szymanski, 1997), MAssive Compact Halo Objects project (MACHO; Alcock et al. 2000), Microlensing Observations in Astrophysics (MOA; Bond et al. 2001), and so on. Researchers investigating variable stars are now enjoying the wealth of the data provided by these projects.
The region studied most extensively is apparently the Large Magellanic Cloud: the discovery of five parallel sequences in the - diagram by Wood (2000) was followed by many papers (Noda et al. 2002, 2004; Kiss & Bedding, 2003, 2004; Groenewegen 2004; Ita et al. 2004a, 2004b; Fraser et al. 2005). Following the conclusion of Glass & Lloyd Evans (1981) and Feast et al. (1989) that the scatter around period-magnitude relation of Mira variables is small for bolometric or near-infrared magnitudes, papers focused on infrared properties of Mira variables and those of other kinds of red variables. However, the Galactic bulge region has not received full attention except for the Baade windows (Schultheis & Glass 2001; Glass and Schultheis 2002, 2003; Schultheis, Glass & Cioni, 2004). Wray, Eyer & Paczyński (2004) analyzed OGLE variables over larger area of the bulge, but they only discussed small-amplitude variables and not Mira variables. Woźniak, McCowan & Vestrand (2004) also made a detailed analysis of microvariability of Mira variables in the OGLE data, but no effort was dedicated to searching for infrared counterparts, which is indispensable to study the period-magnitude relation.
In this paper, we collected Mira variables in the OGLE data and obtained their counterparts in the 2 Micron All-sky Survey (2MASS) point source catalogue (Curti et al., 2003) and the Midcourse Space Experiment (MSX) point source catalogue (Egan et al., 2003). After we present data analyses to obtain a catalogue in Section 2, we discuss their photometric properties (Section 3) and their space distribution in the bulge (Section 4).
2 DATA
2.1 Extraction of Mira Variables from OGLE-II Data
| Fld. | ||||||
|---|---|---|---|---|---|---|
| (deg) | (deg) | (arcsec) | (arcsec) | (mag) | ||
| 1 | 1.08 | 3.62 | 32∗ | 0.12 | 0.49 | 0.21 |
| 2 | 2.23 | 3.46 | 29∗ | 0.30 | 0.07 | 0.18 |
| 3 | 0.11 | 1.93 | 102∗ | 0.50 | 0.10 | 0.33 |
| 4 | 0.43 | 2.01 | 83∗ | 0.15 | 0.15 | 0.29 |
| 5 | 0.23 | 1.33 | 120∗ | 0.04 | 0.27 | 0.60 |
| 6 | 0.25 | 5.70 | 12 | 0.35 | 0.56 | 0.13 |
| 7 | 0.14 | 5.91 | 9 | 0.50 | 0.66 | 0.13 |
| 8 | 10.48 | 3.78 | 8∗ | 0.79 | 0.45 | 0.22 |
| 9 | 10.59 | 3.98 | 9∗ | 0.73 | 0.43 | 0.21 |
| 10 | 9.64 | 3.44 | 16 | 0.79 | 0.80 | 0.24 |
| 11 | 9.74 | 3.64 | 14 | 0.80 | 1.34 | 0.24 |
| 12 | 7.80 | 3.37 | 24 | 0.49 | 0.28 | 0.24 |
| 13 | 7.91 | 3.58 | 17 | 0.46 | 0.42 | 0.21 |
| 14 | 5.23 | 2.81 | 37 | 0.32 | 0.24 | 0.29 |
| 15 | 5.38 | 2.63 | 31 | 0.30 | 0.21 | 0.32 |
| 16 | 5.10 | 3.29 | 26 | 0.13 | 0.20 | 0.22 |
| 17 | 5.28 | 3.45 | 31 | 0.17 | 0.42 | 0.21 |
| 18 | 3.94 | 3.14 | 33∗ | 0.05 | 0.15 | 0.20 |
| 19 | 4.08 | 3.35 | 34∗ | 0.02 | 0.16 | 0.21 |
| 20 | 1.68 | 2.47 | 59∗ | 0.61 | 0.08 | 0.22 |
| 21 | 1.80 | 2.66 | 53∗ | 0.55 | 0.03 | 0.22 |
| 22 | 0.26 | 2.95 | 60 | 0.47 | 0.46 | 0.31 |
| 23 | 0.50 | 3.36 | 49 | 0.46 | 0.55 | 0.30 |
| 24 | 2.44 | 3.36 | 40 | 0.74 | 0.17 | 0.32 |
| 25 | 2.32 | 3.56 | 44 | 0.52 | 0.35 | 0.28 |
| 26 | 4.90 | 3.37 | 30 | 0.68 | 0.23 | 0.23 |
| 27 | 4.92 | 3.65 | 23 | 0.69 | 0.30 | 0.21 |
| 28 | 6.76 | 4.42 | 12 | 1.33 | 0.32 | 0.20 |
| 29 | 6.64 | 4.62 | 11 | 1.36 | 0.11 | 0.19 |
| 30 | 1.94 | 2.84 | 46∗ | 0.47 | 0.02 | 0.22 |
| 31 | 2.23 | 2.94 | 52∗ | 0.46 | 0.03 | 0.20 |
| 32 | 2.34 | 3.14 | 39∗ | 0.38 | 0.10 | 0.18 |
| 33 | 2.35 | 3.66 | 31∗ | 0.31 | 0.11 | 0.20 |
| 34 | 1.35 | 2.40 | 51∗ | 0.53 | 0.00 | 0.26 |
| 35 | 3.05 | 3.00 | 28 | 0.30 | 0.18 | 0.21 |
| 36 | 3.16 | 3.20 | 26 | 0.37 | 0.12 | 0.18 |
| 37 | 0.00 | 1.74 | 104∗ | 0.04 | 0.30 | 0.40 |
| 38 | 0.97 | 3.42 | 39∗ | 0.01 | 0.40 | 0.22 |
| 39 | 0.53 | 2.21 | 94∗ | 0.03 | 0.24 | 0.30 |
| 40 | 2.99 | 3.14 | 55∗ | 0.53 | 0.10 | 0.36 |
| 41 | 2.78 | 3.27 | 36∗ | 0.84 | 0.09 | 0.33 |
| 42 | 4.48 | 3.38 | 23 | 0.06 | 0.16 | 0.24 |
| 43 | 0.37 | 2.95 | 70 | 0.48 | 0.26 | 0.44 |
| 44 | 0.43 | 1.19 | 140∗ | 0.12 | 0.28 | 0.77 |
| 45 | 0.98 | 3.94 | 27 | 0.28 | 0.42 | 0.19 |
| 46 | 1.09 | 4.14 | 28 | 0.10 | 0.50 | 0.19 |
| 47 | 11.19 | 2.60 | 13 | 0.42 | 0.25 | 0.25 |
| 48 | 11.07 | 2.78 | 11 | 0.52 | 0.19 | 0.24 |
| 49 | 11.36 | 3.25 | 7 | 0.12 | 0.04 | 0.20 |
The Optical Gravitational Lensing Experiment-II (OGLE-II) repeatedly observed 49 fields between and from 1997 to 1999 (Woźniak et al., 2002). Galactic coordinates for the fields are given in Table 1. Light curves (typically with 200–300 data points) for 221 801 objects in these fields are available on the Internet.111OGLE homepage (http://www.astrouw.edu.pl/%7Eogle/) After we excluded false data with error flags, we applied the phase dispersion minimization method (Stellingwerf, 1978) to all the light curves. We used the same software as Ita et al. (2004a) did. It gives us a period (), a regularity indicator of variation (), and a maximum-to-minimum amplitude () for each variable. Small indicates regular variation and a well-characterized period. We put the following criteria for Mira variables:
| (1) | |||||
| (2) | |||||
| (3) |
and obtained 11 207 candidates. All the light curves were further examined by eye. We found many fake detections that show very similar light curves but are fainter than the corresponding real detection at neighbouring positions, and rejected them. We also rejected some other candidates that showed double periodicity which is often seen among variables on the D sequence (Mira variables are on the C sequence; Wood 2000). Finally, we obtained 1968 Mira variables. Table 2 shows the first 10 lines of the resultant table. An entry with Fld and ID corresponds to OGLE data named ’bul_sc_.dat4’. Their properties of variation (, , , and mean magnitude ) are accompanied by identification with 2MASS and MSX point source, which will be discussed in the following sections. The full version of the table will be electronically available in the online version of this journal. The number of Mira variables for each field, , is listed in Table 1.
| Fld. | ID | 2MASS | MSX6C | [8] | Flag | |||||||
|---|---|---|---|---|---|---|---|---|---|---|---|---|
| days | mag | mag | mag | mag | mag | mag | ||||||
| 1 | 98 | 18022945-3024145 | —————– | 244.3 | 0.26 | 5.29 | 13.43 | 1.50 | 0.50 | 7.56 | 99.99 | 0 |
| 1 | 103 | 18023199-3024487 | G000.5829-03.9157 | 349.6 | 0.10 | 2.23 | 11.72 | 1.75 | 0.69 | 7.12 | 5.11 | 0 |
| 1 | 177 | 18023020-3023485 | G000.5942-03.9016 | 332.3 | 0.36 | 6.21 | 14.18 | 1.92 | 0.70 | 6.90 | 4.37 | 0 |
| 1 | 193 | 18024239-3023403 | G000.6176-03.9391 | 336.5 | 0.10 | 2.02 | 12.55 | 1.91 | 0.72 | 7.21 | 5.38 | 0 |
| 1 | 235 | 18021264-3022350 | G000.5814-03.8367 | 264.7 | 0.10 | 1.93 | 11.62 | 1.60 | 0.60 | 7.58 | 5.92 | 0 |
| 1 | 268 | 18024758-3022355 | G000.6419-03.9480 | 180.4 | 0.28 | 1.66 | 11.14 | 1.40 | 0.50 | 7.81 | 6.23 | 0 |
| 1 | 558 | 18025358-3019229 | G000.7004-03.9399 | 230.0 | 0.08 | 2.83 | 13.68 | 2.04 | 0.84 | 8.08 | 5.85 | 0 |
| 1 | 602 | 18023988-3018221 | G000.6907-03.8889 | 315.9 | 0.05 | 3.44 | 12.65 | 1.62 | 0.57 | 6.87 | 5.46 | 0 |
| 1 | 878 | 18023810-3015202 | —————– | 127.8 | 0.22 | 1.29 | 12.38 | 1.32 | 0.43 | 8.73 | 99.99 | 0 |
| 1 | 916 | 18021033-3014173 | G000.6978-03.7619 | 385.5 | 0.19 | 1.37 | 11.39 | 1.92 | 0.69 | 5.28 | 4.06 | 0 |
2.2 Cross-identification with 2MASS
Near-infrared counterparts of the OGLE-II Mira variables were searched for in the 2MASS point source catalogue (Curti et al., 2003). In order to adjust the systematic differences in positions between the two data sets, we adopted the different offsets in right ascension and declination for different fields ( and , given in Table 1). With these offsets, we found 1960 matches within a limit radius of 1 arcsec. Fig. 1 shows the differences in the right ascension and declination. It is easily seen that most of the OGLE-II Mira variables have their near-infrared counterparts within a radius of 0.5 arcsec.
Light variability causes main photometric uncertainties under discussion in this paper. Although the amplitude of light variation decreases with the wavelength for Mira variables, some of them still have an amplitude of up to 1 mag in the -band (Glass et al. 1995; Whitelock, Marang & Feast, 2000). Therefore, mean magnitudes are usually used to investigate the infrared properties of Mira variables. As the 2MASS catalogue gives us single-epoch magnitudes, unfortunately, we should be aware of the possible error caused by the difference between the mean magnitude and the single-epoch one. This error is large in comparison with the difference between photometric systems. According to Carpenter (2001), for example, the difference is less than 0.1 mag between in the 2MASS system and in the Las Campanas Observatory (LCO) system, in which system Ita et al. (2004a) derived the - relation (used in eq. 6). Therefore, we ignore the difference between and magnitudes among various systems in the following discussions.

2.3 Cross-identification with MSX
Mid-infrared counterparts were searched for in the MSX point source catalogue (Egan et al., 2003), leading to 1541 matches within a limit radius of 10 arcsec. The positional differences are plotted in Fig. 2. Among the identifications with 2MASS and/or MSX point sources, 30 Mira variables were found to be doubly detected because they lie in the overlapping regions between the neighbouring OGLE-II fields, as listed in Table 3. We put the flag 1 in the last column of Table 2 if a variable has a counterpart in another field (otherwise 0).
| Entry 1. | Entry 2. | 2MASS | MSX6C | ||
|---|---|---|---|---|---|
| Fld. | ID | Fld. | ID | ||
| 1 | 3024 | 38 | 3446 | 18020050-2947556 | G001.0639-03.5153 |
| 2 | 3933 | 33 | 3377 | 18050058-2839528 | G002.3762-03.5326 |
| 3 | 878 | 37 | 857 | 17530423-3018592 | G359.6485-02.0981 |
| 3 | 2286 | 4 | 375 | 17540566-3009027 | G359.9034-02.2048 |
| 3 | 2695 | 37 | 2835 | 17530457-3005208 | G359.8450-01.9840 |
| 3 | 4124 | 4 | 2209 | 17540599-2956549 | G000.0783-02.1041 |
| 3 | 4235 | 4 | 2509 | 17540524-2955533 | —————- |
| 3 | 4522 | 37 | 4656 | 17530343-2952379 | G000.0255-01.8727 |
| 3 | 5929 | 37 | 5926 | 17530367-2944057 | G000.1497-01.8011 |
| 3 | 6181 | 4 | 4722 | —————– | G000.2718-01.9909 |
| 3 | 7804 | 4 | 6265 | 17540688-2934463 | G000.3989-01.9203 |
| 4 | 360 | 39 | 315 | 17550808-3009531 | G000.0047-02.4062 |
| 5 | 84 | 44 | 805 | 17495238-3023328 | G359.2301-01.5432 |
| 5 | 367 | 44 | 1066 | 17495216-3020497 | —————- |
| 5 | 3681 | 44 | 4608 | 17495113-2954571 | G359.6381-01.2952 |
| 5 | 3916 | 44 | 5045 | 17495111-2952354 | G359.6717-01.2748 |
| 5 | 4498 | 44 | 5702 | 17495312-2948492 | G359.7288-01.2483 |
| 5 | 4968 | 44 | 6453 | 17495414-2944533 | G359.7876-01.2184 |
| 8 | 297 | 9 | 210 | 18233244-2206346 | —————- |
| 18 | 1821 | 19 | 1540 | 18073300-2724048 | G003.7556-03.4096 |
| 18 | 5324 | 19 | 4649 | 18073420-2649523 | G004.2579-03.1377 |
| 20 | 1 | 34 | 1945 | 17584836-2920304 | —————- |
| 21 | 2270 | 30 | 1627 | 18005408-2902532 | G001.5985-02.9364 |
| 21 | 2895 | 30 | 2129 | 18005341-2858004 | G001.6689-02.8940 |
| 21 | 5977 | 30 | 5077 | 18005369-2836083 | G001.9870-02.7149 |
| 30 | 1821 | 31 | 159 | 18015154-2902159 | G001.7114-03.1135 |
| 30 | 4589 | 31 | 1759 | 18015346-2840498 | G002.0268-02.9441 |
| 31 | 793 | 32 | 877 | 18025457-2854244 | G001.9396-03.2480 |
| 40 | 1674 | 41 | 957 | 17513443-3320272 | —————- |
| 40 | 3769 | 41 | 3089 | 17513529-3251234 | G357.2979-03.1164 |
The -band (8.28 m with the width of 3.36 m) has the highest sensitivity among the six photometric bands of the MSX survey. The majority of identified objects have a quality flag (Excellent) and all have flags better than (Fair/Poor) in the -band, while more than two thirds of objects have a flag of (Limit) or (Not Detected) in other bands. Therefore, we decided to use only the -band flux in our discussions. The -band magnitudes (denoted as [8]) were obtained using the zero magnitude flux of 58.49 Jy (Egan et al., 2003). Names and [8] magnitudes for identified sources are listed in Table 2. The 427 objects without the MSX counterpart have relatively short periods ( days) and blue colours [ ], i.e. fainter magnitudes according to the period- relation and little excesses in mid infrared. They are naturally expected to be faint in the -band.

2.4 Interstellar extinction

The OGLE-II fields were chosen in the relatively low extinction regions in the Galactic bulge. Still they are located at low galactic latitudes where the interstellar extinction is generally strong. In order to estimate the extinction for each OGLE-II field, we measured how much the red giant branch shifts along a reddening vector in the colour-magnitude diagram. Comparing the position of the branch for each field with that for the Baade window NGC 6522 field, the positional difference was interpreted as being the result of the extinction difference between the two fields. The extinction value for the NGC 6522 field itself was taken as from Schultheis et al. (2004). The procedures were adopted on both the versus diagram and the versus diagram. Slopes of the reddening vectors were taken from Rieke & Lebfsky (1985):
| (4) | |||||
| (5) |
The extinction values obtained from both diagrams agree very well within mag for every field. The results are given in Table 1. As shown in Fig. 3, our results are consistent with the values for OGLE-II fields obtained by Sumi (2004). Although a metallicity gradient within the bulge can cause shifts on our estimates due to the dependence of the colour of giant branch, such a gradient was not detected and is considered to be small (Ibata & Gilmore 1995; Frogel, Tiede, & Kuchinski, 1999; Ramiréz et al. 2000). A difference of 0.2 dex in [Fe/H] results in a shift of 0.03 mag in . No reddening correction was applied to mid-infrared data since they are small and uncertain.
3 DISCUSSION: Photometric properties
3.1 Completeness of the sample
The saturation limit of OGLE-II observation is about . As a result, the extinction-corrected magnitudes are limited to in Fig. 4. Some bright variables could be missing from our sample. However, fewer than 10 per cent are brighter than 11 mag in -band magnitude distribution of late-type M giants toward the Baade window obtained by Blanco, McCarthy & Blanco (1984). Their distribution shows a similar decrease toward brighter region () as is shown by our histogram in Fig. 5. Furthermore, kinematic studies showed these bright Mira variables to have a small velocity dispersion, and they are probably foreground objects in the outer bulge or disc (Feast & Whitelock 1987; Sharples, Walker & Cropper, 1990).
On the other extreme, no variables fainter than were detected. As shown in Fig. 4, the fainter boundary for the short-period Mira variables is clearly delineated, but the long-period Mira variables seem to extend to below the detection limit. While the reddest sources in our sample show 2, some OH/IR stars near the Galactic Centre have as large as 3 mag (Wood, Habing & McGregor, 1998). Such red objects have also been found among the IRAS sources in the Galactic bulge between (Whitelock, Feast & Catchpole, 1991). These extremely red objects are undergoing heavy mass loss which leads to large . In such cases, -band flux should be reduced to below the detection limit. Fig. 6 compares the period distribution of our sample with that for the IRAS sample by Whitelock et al. (1991). While their sample lacks short-period, and probably blue, Mira variables, it contains more significant component at 700 days than our sample. Probably, some long-period red variables are missing from our sample. In this regard, it is interesting that the OGLE-II objects with [8] Jy (filled portion in Fig. 6) have a more similar period distribution to the IRAS sources.


3.2 Mass-losing O-rich star or C-rich star ?


Schultheis et al. (2004) compared the red variables in three regions, namely the NGC 6522 field, the Large Magellanic Cloud (LMC), and the Small Magellanic Cloud (SMC). In the NGC 6522 field, they noted the absence of variables with , which are rather common in both Magellanic Clouds (MCs). They assigned those red objects to carbon-rich (C-rich) stars which are absent in the Galactic bulge. Fig. 7 shows the colour-magnitude and the colour-colour diagrams of the Mira variables in the OGLE-II fields. In contrast to the NGC 6522 field, our sample shows a red tail extending to . However, Fig. 8 shows the fraction of such red variables is so small that the difference is not significant. Fig. 8 also presents the colour distribution of Mira variables in both MCs, the data for which were collected from Ita et al. (2004b) using the same criteria, i.e. (1)–(3). As Schultheis et al. (2004) mentioned, the distribution is clearly different among three galaxies. This is caused by the different combinations of oxygen-rich (O-rich) stars and C-rich stars, as is discussed in the following.
Fig. 9 shows the relationship between the colour and the amplitude . Ita et al. (2004b) argued that the dichotomy for the LMC is caused by the difference between O-rich stars (bluer) and C-rich ones (redder). A distinction between O- and C-rich stars is not apparent in Fig. 8, but is clearly seen in Fig. 9 as two separate branches. While the distribution of O-rich Mira variables forms a rather sharp ridge at for the LMC, the ridge is wider and stretches to a redder colour for the bulge. This can be explained by the fact that the giant branch star with the higher metal content has the redder colour as shown for Galactic globular clusters (Frogel, Cohen & Persson, 1983; Ferraro et al. 2000). On the other hand, the peak disappears for the SMC. This is probably because the lower metal content for the SMC reduces the fraction of O-rich stars.
The dichotomy in Fig. 9 for the LMC disappears for the bulge. The O-rich branch dominates, and the redder part looks extended from the branch. This is in accordance with the fact that so far no bright carbon star at the tip of the AGB has been found within the Galactic bulge (Blanco & Terndrup, 1989). The top of Fig. 10 shows that Mira variables in the redder part have longer periods. The middle panel and the bottom one plot the colour and the mid-infrared magnitude [8], respectively, against . These panels show Mira variables with periods longer than have [8]-band excesses indicating thick dust shells produced by mass-loss phenomena. It is interesting that the -[8] relation clearly has a turn-off in contrast to the -[12] relation by Whitelock et al. (1991) with only long period variables (). The slope turns up to a larger one () from a value similar to that of the - relation ().


3.3 The - relation
Fig. 11 shows the - diagram for the OGLE-II Mira variables. The solid line is a - relation of the LMC Mira variables (Ita et al. 2004a) after the correction of difference in the distance modulus. Crosses representing Mira variables with occupy a fainter region because of the circumstellar extinction in the -band. Fig. 12 shows the difference between and the -absolute relation:
| (6) |
for each variable, against . For the both MCs, it is clearly shown that Mira variables with deviate from the constant values. The circumstellar extinction is responsible for this -band darkening because the reddened variables have longer periods as those in the bulge do (see Fig. 10).
The distribution for the bulge seems different from those for the MCs and the deviations seem to occur even for bluer Mira variables. The distribution for the bulge has a large spread compared with the MCs. This is caused by the depth of the bulge along the line of sight. As stars in the bulge have a rather wide range of metallicities (Zoccali et al. 2003, and references therein), there could also be an effect from some kinds of metallicity dependence. Although Ita et al. (2004a) claimed they found the metallicity dependence of the zero point between both MCs, it is still a subject of controversy (see Feast 2004, for a review).
Solid lines in Fig. 12 are least-square fitted lines for Mira variables with after one 2- clipping. It is interesting that their slopes are similar to the reddening coefficient ( for the bulge; for the LMC; for the SMC). This indicates circumstellar matters around Mira variables have optical characteristics similar to those of interstellar matters in the near infrared range ().
4 DISCUSSION: The structure of the bulge
4.1 Surface number density
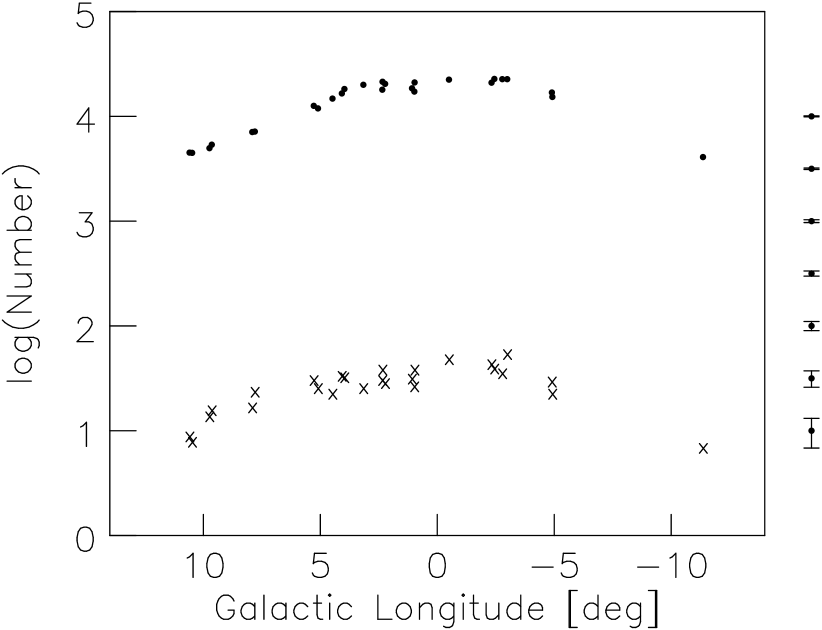
In Fig. 13, the number of Mira variables for each OGLE-II field with is plotted against the galactic longitude (cross). The amount of Poisson noise along the -axis is illustrated on the right-hand side of the figure. The distribution is rather flat between and drops to the half maximum at around . We also confirmed this feature in the distribution of red clump stars (filled circles in Fig. 13) using the result obtained by Sumi (2004). This is because the surface brightness of the bulge is a so-called ’boxy’-type and the brightness does not vary along between the region (see, for example, fig. 1 by Dwek et al. 1995).
We compared the surface number density with the surface brightness obtained by the Diffuse Infrared Background Experiment (DIRBE) onboard the Cosmic Background Explorer satellite (COBE). We used the Zodi-subtracted mission average map which is available on the Web.222http://lambda.gsfc.nasa.gov/product/cobe/ In order to extract the surface brightness of the bulge (excluding the disc), we basically followed the method of Weiland et al. (1994). First, we need to know the interstellar extinction. Between the obtained in Section 2.4 and the COBE colours at the OGLE-II fields, we found the relation
| (7) |
as shown in Fig. 14. From this equation, we obtained as the intrinsic colour of the bulge population. It is a reasonable colour for old and metal-rich stellar population. For example, a recent population synthesis model by Mouhcine & Lançon (2003) predicts a stellar population with (or [M/H]) would have such a colour over a wide range of ages between 16 Gyr and 2 Gyr. We regard the above equation as being applicable to areas other than those observed by the OGLE-II survey, and used this relation to estimate the interstellar extinction.
After the correction of the interstellar extinction, we subtracted the disc contribution. The disc is described in an exponential form:
| (8) |
where is the scale-hight for each galactic latitude, fitting to the observed surface brightness between . With the obtained disc components subtracted, the surface brightness of the bulge component for each field is obtained by averaging the values within from the central coordinate of the field. Fig. 15 shows the relationship between the thus-obtained surface brightness and the number of Mira variables for each field.
The specific frequency of Mira variables per unit apparent brightness is 0.059 Jy-1 from the slope of the figure. Assuming a distance of 8 kpc for the bulge, the frequency per unit -band absolute brightness is 0.094 MJy-1. For metal-rich globular clusters, Frogel & Whitelock (1998) determined the specific frequency of long-period variables to be 0.11 MJy-1 (see their eq. 2). Considering that they didn’t include variables with , whereas they account for about 10 per cent of our sample, the frequency for the bulge is 25 per cent smaller than that for the globular clusters. This can be because the high metal content in the bulge enhances the mass loss and abbreviates the lifetimes of Mira variables as Frogel & Whitelock (1998) suggested. The total number of Mira variables were estimated to be by integrating the surface brightness distribution over the and region.


4.2 Radial distribution
The period-magnitude relation of Mira variables has been widely applied as a distance indicator. A recent example is Rejkuba (2004) where the relation is used to obtain the distance to the galaxy NGC 5128 (Cen A). Furthermore, Lah, Kiss & Bedding (2005) explored the three-dimensional structures of the MCs. We expect that the structure of the bulge can also be traced by Mira variables. It is considered to be shaped like a bar inclined from the Sun-Galactic Centre line of sight by 15-40 after many works with various methods (distribution of luminous late-type stars, Nakada et al. 1991; gas dynamics, Binney et al. 1991; Nakai 1992; surface brightness distribution, Blitz & Spergel 1991; Dwek et al. 1995; distribution and kinematics of SiO masers, Deguchi et al. 2002; peak of luminosity function due to red clump stars, Stanek et al. 1994; Nishiyama et al. 2005). Using 104 Mira variables, Whitelock & Catchpole (1992) also showed the asymmetry of the bulge.
In Fig. 16, the distribution of OGLE-II Mira variables are projected on the galactic plane. Distances to individual variables are obtained by adopting the relation (6). As the very red objects tend to deviate from this relation, we used only stars with to avoid the circumstellar extinction. Unfortunately, we had to use single-epoch magnitudes from the 2MASS catalogue, instead of average magnitudes which are usually used for the distance estimation. The uncertainty in our estimate from single-epoch magnitudes causes the distance uncertainty to rise by up to kpc in the extreme case. Still we notice that there are far less stars at nearer region to the Sun on the negative longitude side than on the positive side. This asymmetry should reflect the elongated shape of the bulge. It is expected that more dense surveys, i.e. toward a number of galactic longitudes, will reveal the detailed structure of the bulge. It is also interesting to investigate the kinematics of the Mira variables and to combine them with the space distribution.

5 SUMMARY
We collected 1968 Mira variables in the bulge from OGLE-II data base. 1960 objects were cross-identified in 2MASS point source catalogue, and 1541 objects in MSX point source catalogue. Interstellar extinctions for the near-infrared magnitudes of 2MASS were corrected by our estimates of the extinction values , which are consistent with by Sumi (2004). They are also consistent with those obtained with the surface brightness colours from COBE/DIRBE data. Based on the catalogue of Mira variables, some photometric properties were discussed. Our results include: (1) the separation between O-rich Mira variables and C-rich ones in the colour-amplitude diagram, (2) the preference for periods longer than of mass-losing stars demonstrated in the period-colour diagram and the period-[8] diagram, and (3) that those mass-losing stars are affected by their own circumstellar matter that have similar reddening vectors to that of interstellar extinction.
We also discussed the structure of the bulge. The number of Mira variables is proportional to the COBE/DIRBE surface brightness, for which interstellar extinction and disc contribution were corrected. Using the coefficient of proportionality, we estimated the total number of Mira variables in the bulge is about . Our analysis provided a panoramic view of the bulge although it is a preliminary result due to the lack of repeated observations in the infrared. However, we clearly detected the asymmetry between the positive galactic-longitude side and the negative side, which is commonly considered as evidence of the bar-like shape of the bulge.
ACKNOWLEDGMENTS
We are grateful to the OGLE project team who released the large amount of data we used. This publication also makes use of data products from the Two Micron All-sky Survey, which is a joint project between the University of Massachusetts and the Infrared Processing and Analysis Center/California Institute of Technology, funded by the National Aeronautics and Space Administration and the National Science Foundation. We further used data products from the Midcourse Space Experiment. Processing of the data was funded by the Ballistic Missile Defense Organization with additional support from NASA Office of Space Science. This research has also made use of the NASA/IPAC Infrared Science Archive, which is operated by the Jet Propulsion Laboratory, California Institute of Technology, under contract with the National Aeronautics and Space Administration. We acknowledge the use of the Legacy Archive for Microwave Background Data Analysis (LAMBDA) for the COBE data. Support for LAMBDA is provided by the NASA Office of Space Science. One of the authors (MN) is financially supported by the Japan Society for the Promotion of Science (JSPS) for Young Scientists.
Note added in proof
Croenewegen & Blommaert (2005) have also made an analysis of Mira variables in the OGLE-II data, and independently obtained some similar results to ours. In particular, they present estimations of the structure using simulations.
References
- Alcock et al. (2000) Alcock C. et al., 2000, ApJ, 541, 734
- Blanco et al. (1984) Blanco, V. M., McCarthy, M. F., Blanco, B. M., 1984, AJ, 89, 636
- Blanco & Terndrup (1989) Blanco, V. M., Terndrup, D. M., 1989, AJ, 98, 843
- Bond et al. (2001) Bond I. A. et al., 2001, MNRAS, 327, 868
- Binney et al. (1991) Binney, J., Gerhard, O. E., Stark, A. A., Bally, J., Uchida, K. I., 1991, MNRAS, 252, 210
- Blitz & Spergel (1991) Blitz, L., Spergel, D. N., 1991, ApJ, 379, 631
- Carpenter (2001) Carpenter, J. M., 2001, AJ, 121, 2851
- Curti et al. (2003) Curti, R. M. et al., 2003, Explanatory Supplement to the 2MASS All Sky Data Release (Pasadena: Caltech)
- Deguchi et al. (2002) Deguchi, S., T. Fujii, T., Nakashima, J., Wood, P. R., 2002, PASJ, 54, 719
- Dwek et al. (1995) Dwek, E. et al., 1995, ApJ, 445, 716
- Egan et al. (2003) Egan, M. P., et al., 2003, The Midcourse Space Experiment Point Source Catalog Version 2.3, Air Force Research Laboratory Technical Report (AFRL-VS-TR-2003-1589)
- Feast & Whitelock (1987) Feast, M. W., Whitelock, P. A., 1987, in Kwok, S., Pottasch, S. R., eds, Late stages of stellar evolution, Reidel, Dordrecht, p. 33,
- Feast et al. (1989) Feast, M. W., Glass, I. S., Whitelock, P. A., Catchpole, R. M., 1989, MNRAS, 241, 375
- Feast (2004) Feast, M. W., 2004, ASPC, 310, 304
- Ferraro et al. (2000) Ferraro, F. R., Montegriffo, P., Origlia, L., Fusi Pecci, F., 2000, AJ, 119, 1282
- Fraser et al. (2005) Fraser O. J., Hawley S. L., Cook, K. H., Keller, S. C., 2005, AJ, 129, 768
- Frogel et al. (1983) Frogel, J. A., Cohen, J. G., Persson, S. E., 1983, ApJ, 275, 773
- Frogel et al. (1999) Frogel, J. A., Tiede, G. P., Kuchinski, L. E., 1999, AJ, 117, 2296
- Frogel & Whitelock (1998) Frogel, J. A., Whitelock, P. A., 1998, AJ, 116, 754
- Glass & Lloyd Evans (1981) Glass, I. S., Lloyd Evans, T., 1981, Nature, 291, 303
- Glass et al. (1995) Glass, I. S., Whitelock, P. A., Catchpole, R. M., Feast, M. W., 1995, MNRAS, 273, 383
- Glass & Schultheis (2002) Glass, I. S., Schultheis, M., 2002, MNRAS, 337, 519
- Glass & Schultheis (2003) Glass, I. S., Schultheis, M., 2003, MNRAS, 345, 39
- Groenewegen (2004) Groenewegen, M. A. T., 2004, A&A, 425, 595
- Ibata & Gilmore (1995) Ibata, R. A., Gilmore, G. F., 1995, MNRAS, 275, 605
- Ita et al. (2004a) Ita, Y. et al., 2004a, MNRAS, 347, 720
- Ita et al. (2004b) Ita, Y. et al., 2004b, MNRAS, 353, 705
- Kiss & Bedding (2003) Kiss, L. L., Bedding, T. R. 2003, MNRAS, 343, L79
- Kiss & Bedding (2004) Kiss, L. L., Bedding, T. R. 2004, MNRAS, 347, L83
- Lah et al. (2005) Lah, P., Kiss, L. L., Bedding, T. R., 2005, MNRAS, 359, L42
- Mouhcine & Lançon (2003) Mouhcine, M., Lançon, A., 2003, 402, 425
- Nakai (1992) Nakai, N., 1992, PASJ, 44, L27
- Nakada et al. (1991) Nakada, Y., Deguchi, S., Hashimoto, O., Izumiura, H., Onaka, T., Sekiguchi, K., Yamamura, I., 1991, Nature, 353, 140
- Nishiyama et al. (2005) Nishiyama, S. et al., 2005, ApJ, 621, L105
- Noda et al. (2002) Noda, S. et al., 2002, MNRAS, 330, 137
- Noda et al. (2004) Noda, S. et al., 2004, MNRAS, 348, 1120
- Ramiréz et al. (2000) Ramiréz, S. V., Stephens, A. W., Frogel, J. A., DePoy, D. L, 2000, AJ, 120, 833
- Rejkuba (2004) Rejkuba, M., 2004, A&A, 413, 903
- Rieke & Lebfsky (1985) Rieke, G. H., Lebofsky, M. J., 1985, ApJ, 288, 618
- Schultheis & Glass (2001) Schultheis, M., Glass, I. S., 2001, MNRAS, 327, 1193
- Schultheis et al. (2004) Schultheis, M., Glass, I. S. Cioni, M.-R., 2004, A&A, 427, 945
- Sharples et al. (1990) Sharples, R., Walker, A., Cropper, M., 1990, MNRAS, 1990, 246, 54
- Stanek et al. (1994) Stanek, K. Z., Mateo, M., Udalski, A., Szymański, M., Kaluźny, J., Kubiak, M., 1994, ApJ, 429, L73
- Stellingwerf (1978) Stellingwerf, B. F., 1978, ApJ, 224, 953
- Sumi (2004) Sumi, T., 2004, MNRAS, 349, 193
- Udalski et al. (1997) Udalski A., Kubiak M., Szymanski M., 1997, AcA, 47, 319
- Weiland et al. (1994) Weiland, J. L. et al., 1994, ApJ, 425, L81
- Whitelock et al. (1991) Whitelock, P. A., Feast, M. W., Catchpole, R. M., 1991, MNRAS, 248, 276
- Whitelock & Catchpole (1992) Whitelock, P. A., Catchpole, R. M., 1992, in Blitz, L. eds, The center, bulge, and disk of the Milky Way, Dordrecht, Kluwer, p. 103
- Whitelock et al. (2000) Whitelock, P. A., Marang, F., Feast, M. W., 2000, MNRAS, 319, 728
- Wood et al. (1998) Wood P. R., Habing, H. J., McGregor, P. J., 1998, A&A, 336, 925
- Wood (2000) Wood, P. R., 2000, PASA, 17, 18
- Woźniak et al. (2002) Woźniak, P. R., Udalski, A., Szymanski, M., Kubiak, M., Pietrzynski, G., Soszynski, I., Zebrun, K., 2002, Acta Astron., 52, 129.
- Woźniak et al. (2004) Woźniak, P. R., McGowan, K. E., Vestrand, W. T., 2004, ApJ, 610, 1038
- Wray et al. (2004) Wray, J. J., Eyer, L., Paczyński, B., 2004, MNRAS, 349, 1059
- Zoccali et al. (2003) Zoccali, M. et al., 2003, A&A, 399, 931
Supplementary material
The following supplementary material is available online.
Table 2. The result table of Mira variables. In case of null identification with 2MASS or the MSX point source, 99.99 and 9.9 are put for magnitudes and colours, respectively. Flag 1 indicates double detection in the neighbouring fields (otherwise 0; see Table 3).