Intra-group diffuse light in
compact groups of galaxies.
HCG 79, HCG 88 and HCG 95
Abstract
Deep and images of three Hickson Compact Groups, HCG 79, HCG 88 and HCG 95, were analyzed using a new wavelet technic to measure possible intra-group diffuse light present in these systems. The method used, OV_WAV, is a wavelet technic particularly suitable to detect low-surface brightness extended structures, down to a per pixel, which corresponds to a 5--detection level in wavelet space. The three groups studied are in different evolutionary stages, as can be judged by their very different fractions of the total light contained in their intra-group halos: % for HCG 79 and % for HCG 95, in the band, and HCG 88 had no component detected down to a limiting surface brightness of . For HCG 95 the intra-group light is red, similar to the mean colors of the group galaxies themselves, suggesting that it is formed by an old population with no significant on-going star formation. For HCG 79, however, the intra-group material has significantly bluer color than the mean color of the group galaxies, suggesting that the diffuse light may, at least in part, come from stripping of dwarf galaxies which dissolved into the group potential well.
keywords:
dark matter — galaxies: clusters: general — galaxies: evolution — galaxies: interactions — intergalactic medium1 Introduction
Galaxy interactions can strip matter from galaxies, forming tidal debris such as tails, shells and bridges. When the interacting galaxies are fairly isolated, this material tends to fall back onto the parent galaxy. First the most bound, lowest angular momentum and later the loosely bound, high angular momentum material is reaccreted (Hibbard & Mihos, 1995; Mihos, 2003). Stars may form loops and shells while the gas may form rotating warped disks, as, for example, in the case of Cen A (Mihos & Hernquist, 1996; Naab & Burkert, 2001; Barnes, 2002). The gas in those features can also form stars, giving rise to structures like tidal dwarf galaxies – TDG’s (Zwicky, 1956; Schweizer, 1987; Mirabel, Lutz & Maza, 1991; Braine et al., 2000).
Inside a dense structure, such as in a galaxy cluster, the material is easily stripped from the member galaxies and the tidal features are quickly dispersed by the combination of the cluster tides and ram pressure stripping from the hot intracluster medium, being only partially re-absorbed by the individual systems. The dispersed matter from the tidal features will, over time, settle onto the cluster potential well and form a very faint intracluster diffuse light component (Mihos, 2003).
The first mention to intracluster light was by Zwicky (1951), to describe an extended envelope of low surface brightness intergalactic matter observed in the Coma cluster. Other studies have detected diffuse light envelopes in clusters, such as de Vaucouleurs (1960); Uson, Boughn & Kuhn (1991); Scheick & Kuhn (1994), and more recently Gonzalez et al. (2000); Feldmeier et al. (2004); Adami et al. (2005); Zibetti et al. (2005) (See Vílchez–Gómez, 1999, for a review). The intracluster light can represent 10 to 50% of the total cluster light, but the measurements have large uncertainties. In addition, low surface brightness arcs (Trentham & Mobasher, 1998; Gregg & West, 1998; Calcáneo–Roldán, 2000), individual stars (Ferguson, Tanvir & von Hippel, 1998), novae (Neill, Shara & Oegerle, 2005) and planetary nebulae (Feldmeier, Ciardullo & Jacoby, 1998; Arnaboldi et al., 2002) are being observed in clusters and share the same origin as the diffuse envelope: stripped material from the cluster galaxies.
The intracluster light offers a direct way to study the dynamical evolution of structures, enabling the study of past galaxy encounters, the dark matter content, history of accretion onto the system and tidal stripping (Dressler, 1984). The amount of intracluster light can indicate the evolutionary stage of a system, working as an evolutionary clock, being also sensitive to dark matter distribution, since the shape of the dark matter halo affects the amount of stripped matter. The presence of substructures such as low surface brightness arcs gives us information about the orbits of the galaxies involved in the interaction episodes. Other unanswered questions such as the origin of the Ultra Compact Dwarf Galaxies – UCDs (Drinkwater et al., 2003) and the formation mechanism for S0 galaxies (Quilis, Moore & Bower, 2000) may also be related to the intracluster light.
Simulations and theoretical work (Gallagher & Ostriker, 1972; Merritt, 1983; Richstone & Malumuth, 1983; Moore, Lake & Katz, 1998; Korchaginm, Tsuchiya & Miyama, 2001; Dubinski, Koranyi & Geller, 2003; Mihos, 2003; Gnedin, 2003; Napolitano et al., 2003; Murante et al., 2004; Willman et al., 2004; Sommer–Larsen, Romeo & Portinari, 2005) have greatly increased our knowledge on the formation of the intracluster light in clusters and groups. It is still unknown, however, how the specific properties of the intracluster light component correlate with cluster properties, given the large uncertainties involved and the few numbers of studies available in this area. It is fair to say that we are still in the process of forming a global picture, gathering all information on cluster/group dynamical stages yielded by measurements of intracluster light. One important addition to the literature data on this area is the determination of the levels of background light in selected compact groups of galaxies. This is one of the main contributions of this paper.
Compact groups of galaxies are very dense environments (projected densities between and ), with low velocity dispersions (, Hickson et al., 1992), where interactions should be frequent and the stripping of material from the galaxies should be an efficient process. A simple visual inspection of compact groups of galaxies from Hickson’s catalogue (Hickson Compact Group catalogue – HCG, Hickson, 1982) suggests that several of them may contain a diffuse background light envelope.
Previous studies of compact group galaxies using photographic plates were unsuccessful in detecting the intra-group light component (IGL). Rose (1979) did not detect any diffuse component and Pildis, Bregman & Schombert (1995a) have detected an IGL component in only one of the seven groups studied. A diffuse component was detected by Sulentic & Lorre (1983) and Moles, Márquez & Sulentic (1998) and more recent studies using CCDs, Nishiura et al. (2000) and White et al. (2003), have identified IGL in HCG 79 and HCG 90, which corresponded to 13% and 45% of the total light of the group in the band, respectively. These previous studies measured the background light by modeling the galaxies with elliptical isophotes, removing them from the images and measuring what was left behind. This poses difficulties first of all because the interacting galaxies are often not well fit by elliptical isophotes and second because the IGL, being a very low surface brightness component, usually at a level of less than 1% of the night sky brightness, and being typically distributed over a large area of the group, can be easily contaminated by the light from the group galaxies.
In this paper we describe a new method to isolate the contribution from the IGL in compact groups, the OV_WAV (Epitácio Pereira, Rabaça & Da Rocha, 2005), which uses the à trous wavelet transform to perform this separation. This method is independent of galaxy and star modeling and sky level subtraction. Our method is similar to the one recently applied by Adami et al. (2005) to study intracluster light in the Coma cluster. We have applied the method to images of three compact group galaxies: HCG 79, HCG 88 and HCG 95. In §2 we present the observational data. Section 3 presents the data reduction with a brief description of the OV_WAV modeling and the tests applied to the data. In §4 the analysis of the data and the results are presented. A discussion and summary are presented in section 5. Throughout this work we use , , , when necessary.
2 Sample and Observational Data
2.1 The Sample
We have selected three groups from Hickson’s catalogue (Hickson, 1982) which seem to be in different evolutionary stages: 1) HCG 79, which contains many signs of galaxy interaction and an IGL component which is readily noticeable by eye inspection, 2) HCG 88, with very few signs of interaction, despite its very small 2D velocity dispersion of 31 km s-1, 3) HCG 95, which presents clear signs of recent interaction such as tails and bridges.
2.1.1 HCG 79
HCG 79, also known as “Seyfert Sextet”, was originally identified as a sextet of galaxies (Seyfert, 1948) and later catalogued by Hickson (1982) as a quintet. The sixth object is in fact a luminous tidal debris. A decade later, this group was shown to be a quartet with a mean recession velocity of and a discordant recession velocity galaxy at (Hickson et al., 1992). The velocity dispersion of the group is . At a distance of (), the mean separation of the galaxies is only . It is therefore the most compact group in Hickson’s list (Hickson, 1982).
The four galaxies present signs of morphological distortions. There are signs of a bar (HCG 79B), tidal tails (HCG 79B and HCG 79D), a dust lane (HCG 79A) and emission in radio, infrared, [Nii] and (HCG 79A and HCG 79B, Mendes de Oliveira & Hickson, 1994), disturbed rotation curves (HCG 79A and HCG 79B, Bonfanti et al., 1999) and nuclear activity (HCG 79A, HCG 79B and HCG 79D). Signs of the nuclear activity were detected and classified by Shimada et al. (2000) using [Nii], [Sii] and ratios. The group presents a prominent IGL envelope, possible to be identified by eye inspection and irregular envelopes of Hi (Williams, McMahon & van Gorkom, 1991) and X-rays (Pildis, Bregman & Evrard, 1995b). These suggest that recent or on-going interaction has taken place within this system. The group data are summarized in table 1.
2.1.2 HCG 88
This system is composed by a quartet of late-type galaxies aligned in a filamentary structure, with a mean recession velocity of (Hickson et al., 1992) and a velocity dispersion of only . The mean separation of the galaxies is , at a distance of ().
The group members present some morphological distortions, such as low luminosity extensions (HCG 88B). They are detected in , infrared and radio emission (Mendes de Oliveira & Hickson, 1994) but none of the galaxies have highly perturbed rotation curves (Plana et al., 2003). About 90% of the detected Hi content of this group is still associated with the disks of the galaxies (Verdes–Montenegro et al., 2001). de Carvalho et al. (1997) identified two other (optically fainter) galaxies at the same redshift of the group. A summary of the group data are presented in table 1.
2.1.3 HCG 95
This system was catalogued by Hickson (1982) as a quartet of galaxies with a mean recession velocity of , a velocity dispersion of and a mean separation of , at a distance of ().
By simple eye-inspection of a broad-band image of the group one promptly notices very obvious morphological peculiarities: two tidal tails in the HCG 95A and HCG 95C region, which seems to connect A and C, and a double nucleus in HCG 95C. HCG 95C is most probably an on-going merger of two disk galaxies, also in interaction with HCG 95A (an elliptical galaxy). Mendes de Oliveira & Hickson (1994) noted radio and infrared emission as well as morphological distortions in HCG 95B.
Reconstructed IRAS frames show infrared emission in this group centered on HCG 95C and enclosing the whole group (Allam et al., 1996). An upper limit to the X-ray detection was given by Ponman et al. (1996) using ROSAT data. Hi was also detected in this group (Huchtmeier et al., 2000; Verdes–Montenegro et al., 2001).
Vílchez & Iglesias–Páramo (1998) detected emission in the nuclei of HCG 95A and HCG 95C and in one of the large tidal tails (the eastern tail). Such tail seems to contain a few tidal dwarf galaxies candidates (Iglesias–Páramo & Vílchez, 2001). emission was also detected along the HCG 95D edge-on disk. HCG 95B (CGCG 406–067) had emission detected along its disk (Iglesias–Páramo & Vílchez, 1998), but at a radial velocity of , instead of at the group’s velocity. This indicates that this non-member galaxy is in the foreground of the group. Besides the discrepant radial velocity of HCG 95B published by Hickson et al. (1992) (), other similarly erroneous values were published at the RC3 (, de Vaucouleurs et al., 1991) and Fouqué et al. (1992) (). However, a spectrum of this galaxy obtained with the 1.52 meter telescope at ESO on November 2002 confirmed the result of Iglesias–Páramo & Vílchez (1998), that its radial velocity is indeed and not around . According to those authors, the morphological distortions presented by this galaxy would have been caused by a nearby dwarf galaxy. The group properties are also summarized in table 1.
| HCG 79 | HCG 88 | HCG 95 | |
|---|---|---|---|
| RA | |||
| DEC | |||
| 4371 () | 6040 () | 11859 () | |
| Distance | 62.4 () | 86.3 () | 169.4 () |
| Vel. Disp. | 121 ( | 31 () | 356 () |
| Mean. Sep. | 7.7 () | 106 () | 48 () |
| Num. Gal. | 4 | 4 | 3 |
2.2 Observational data
and deep images were obtained at the CFHT (Canada–France–Hawaii Telescope). The filters used were B and R from the Mould system, but the resulting magnitudes were transformed into the standard Johnson-Morgan-Cousin B and R magnitudes using a set of standard stars obtained in the same nights, as explained below.
Images of HCG 79 were obtained using the SIS (Sub–arcsecond Imaging Spectrograph), with exposure times of 2700 seconds () in the band and 1800 seconds () in the band. The average seeing values were and for the and images, respectively, and the field size with a pixel size of 0.173 arcsecond (the detector was binned 2 x 2). The photometric zero points were obtained using standard stars from Landolt (1992) and from the Galactic globular clusters M92 and NGC 7006 (Christian et al., 1985).
Images for HCG 88 and HCG 95 were obtained using the MOS (Multi–Object Spectrograph), with a pixel size of 0.314 arcsecond and a field size of . The exposure times for the HCG 88 images were and for the and images respectively, with a similar mean seeing in both filters of . The HCG 95 images had exposure times of and for the and images respectively, with a similar mean seeing in both filters of . The photometric zero points were, also in this case, calibrated using the Galactic globular clusters M92 and NGC 7006 (Christian et al., 1985).
The characteristics of the images are summarized in table 2.
| Group | Band | Inst. | Date | Exp. | Seeing | FOV | Pixel |
|---|---|---|---|---|---|---|---|
| (Sec.) | () | ||||||
| HCG 79 | B | SIS/CFHT | Aug, 93 | 2700 () | 0.173 | ||
| R | SIS/CFHT | Aug, 93 | 1800 () | 0.173 | |||
| HCG 88 | B | MOS/CFHT | Jul, 94 | 3600 () | 0.314 | ||
| R | MOS/CFHT | Jul, 94 | 4800 () | 0.314 | |||
| HCG 95 | B | MOS/CFHT | Jul, 94 | 2400 () | 0.314 | ||
| R | MOS/CFHT | Jul, 94 | 3000 () | 0.314 |
3 Data Reduction
The IGL is a very low surface brightness component, usually at a level of less than 1% of the night sky brightness, but typically distributed over a large area of the group. Many effects can appear as contaminating features to the signal one wants to measure. First those caused by technical problems at the time one takes the data, such as instrumental scattering, i.e., spurious light inside the telescope, flatfielding, which must be better than 1%, ghosts or fringing, vignetting and CCD bleeding. Other problems that make it difficult to measure the IGL component: the background light is dimmed by the light from the group galaxies and bright stars, which should be modeled and removed from the image; measuring the sky level accurately; contamination from faint galaxies beyond the detection limit; galaxy absorption and galactic cirrus.
Assuming one has the technical problems under control, the two main problems of detecting background light are the sky level subtraction and modeling of the bright galaxies and stars superimposed onto the group image. To overcome those problems we have applied a wavelet based technic, the OV_WAV package (Epitácio Pereira et al., 2005), in which the necessary information to treat those effects is internally determined by the package. The description of the technic is given below.
A similar technic was recently employed by Adami et al. (2005) to study intracluster light in the Coma cluster. This work uses the same wavelet transform, the à trous, and the same object reconstruction algorithm, but in our case we have chosen to reconstruct each of the detected objects individually. With this individual object reconstruction, we are able to select only the structures which compose the IGL.
The basic image reduction procedures (bias correction, flatfielding and image combining) were done using the IRAF111IRAF is distributed by the National Optical Astronomy Observatories, which is operated by the Association of Universities for Research in Astronomy, Inc., under cooperative agreement with the National Science Foundation. package (Image Reduction and Analysis Facility). The photometric calibrations with standard stars were performed using DIGIPHOT.PHOTCAL under IRAF. The final combined images were then processed with the OV_WAV package, described below, running under IDL (Interactive Data Language - Developed by Research Systems Inc. – RSI).
3.1 The OV_WAV Package
The OV_WAV is a multiscale package for astronomical data reduction, based on the à trous wavelet transform (Epitácio Pereira et al., 2005). Astronomical images are usually hierarchically organized, i.e., smaller structures are located inside larger structures. Thus, stars may be projected onto a galaxy, which in turn may be projected onto a large diffuse envelope (as in our case), which is then projected onto the sky brightness level. Multiscale analysis is very well suited for this kind of study, since it can separate the structures found in an image by their characteristic sizes. The à trous wavelet transform is a redundant discrete transform, appropriate for digital astronomical images, since it conserves flux and avoids the errors introduced by the discretization process of a continuous function.
The general procedure is an improved version of the procedure described by Starck, Murtagh & Bijaoui (1998), which consists in deconvolving the signal into wavelet coefficients (since images are a 2D signal, each wavelet coefficient corresponds to a plane), identifying the objects representations in the wavelet space, defining the objects with a “multiscale vision model” (Bijaoui & Rué, 1995) and reconstructing the detected objects.
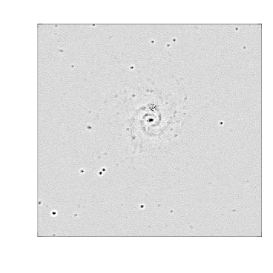
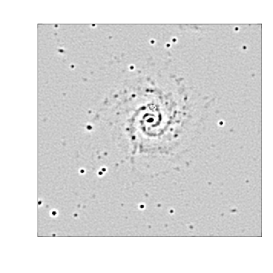
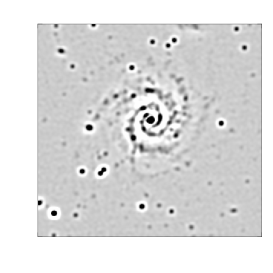
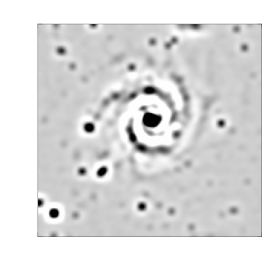
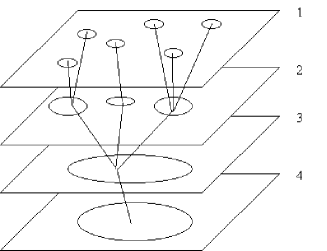
A given object is represented in the wavelet space in different subsequent wavelet coefficients. Those representations are identified in each coefficient using a threshold, which depends on the representation of the image noise in each of the coefficients. As each coefficient contains only structures of a certain size ( pixels, where is the index of the wavelet coefficient), the representation of the noise in each coefficient also has the same characteristic size. In the first coefficient () we only have structures with the size of one pixel, and in this case the noise is basically the pixel to pixel noise, which is usually high. For all further coefficients () the representation of the noise has larger characteristic size ( pixels, pixel, pixels, …) and has a considerably reduced intensity. Extended low surface brightness objects, which have very low signal to noise ratios () in normal space, will be identified in the largest coefficients with higher , since they will only be affected by very low intensity noise, with the characteristic size of the coefficient. By this special relation between the signal and the noise representations in wavelet space, this method is very efficient in detecting low surface brightness structures, which would usually be lost if traditional technics would be employed. As an example of deconvolution of an object, figure 1 shows the representation of a spiral galaxy (HCG 88C) in 9 wavelet coefficients, where the reduction of the noise with the increase of the characteristic size of the coefficient can be noticed.

The object’s representations in each coefficient are identified, defining valid regions, and those regions are interconnected, forming the object as a whole. The region which contains the pixel with the highest flux of all other regions of this object will be considered the “main region” of the object and the object will be marked as detected in this particular coefficient. This way the detected objects are separated into characteristic sizes. With this technic, it is possible to separate different size objects and structures like point sources, resolved small sources, larger galaxies, the IGL component and the sky brightness without any assumption about the shape of the sources or the sky level. A schematic version of the connectivity tree of regions in different wavelet coefficients composing the object can be seen in figure 2.
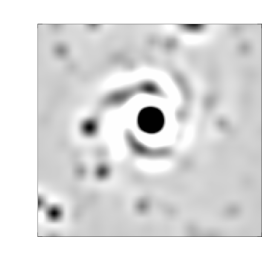
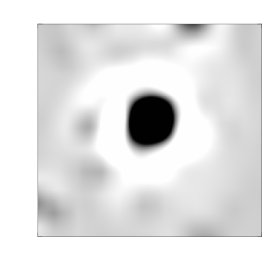
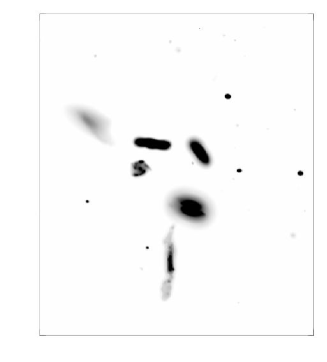
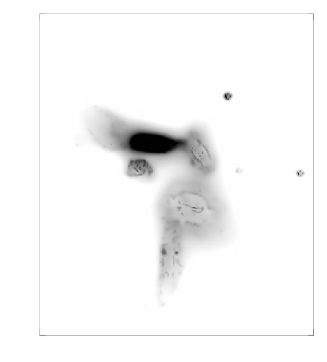
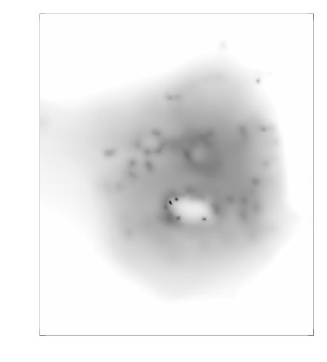
The reconstruction of an object marked as detected in a certain coefficient (), will use all the lower coefficients, the main coefficient and one larger coefficient (). This procedure favors the detection of bright small sources, as point sources and galaxy central parts, so that the image has to be processed in a sequence of iterations. In the first iteration we have the detection of the small bright sources, which are reconstructed and subtracted from the image. In the second iteration fainter and larger sources are identified, as for example the outer parts of bright point sources and galaxies’ halos. These are then reconstructed and subtracted from the image to allow another iteration. In the third iteration the IGL starts showing up. An example of multiple iteration image analysis can be seen in figure 3. For a complete description of the package and the method see Epitácio Pereira et al. (2005).
3.2 Package Test and Simulations
We have performed tests and simulations to define an optimized set of configuration parameters to detect IGL and the confidence level of our results with the OV_WAV.
A B-Spline filter was used for deconvolving the image in wavelet coefficients, the Anscombe noise transformation from Poissonian to Gaussian noise was applied and the valid regions were detected at a 5--detection level. The convergence reconstruction was reached when the flux difference between two iterations was smaller than of the last iteration total flux.
3.2.1 Simulated Images
Using the ARTDATA.MKOBJECTS task, inside IRAF, we have generated three different configurations of artificial fields to test the setup of configuration parameters and the confidence level of our results. The fields are with a Poissonian sky noise.
a) In the first configuration, we have included four galaxies with an exponential brightness profile, with total magnitudes within a range of two magnitudes. The galaxies were added within a very small projected distance from one another, in an attempt to mimic a compact group, with a maximum distance among the centers of the objects of about 30 pixels and without any kind of diffuse component. In this case our main goal was to test if any diffuse-like contamination could be introduced in our results due to the overlapping of the various galaxy halos.
b) The second configuration was a very extended exponential profile galaxy, with an effective radius of 50 pixels (the galaxies in configuration (a) had effective radii or about 3 to 4 pixels). The extended profile covered most of the image, emulating what we expect for an IGL component. This configuration had no other galaxies superimposed onto it, in order to evaluate the IGL detection efficiency without any contamination effect. This second test was performed with three different IGL luminosities, with a central () ratio per pixel of , and and mean of , and , respectively, the latter two being indeed very low signals. These correspond to cases A, B and C respectively, in table 3.
c) The third image configuration has the IGL component as simulated in (b), with the four galaxies of configuration (a) above superposed onto it. The IGL component was also generated using the three different IGL luminosities.
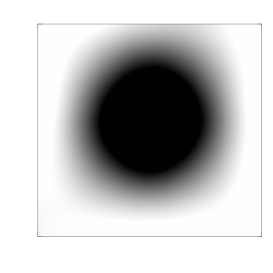
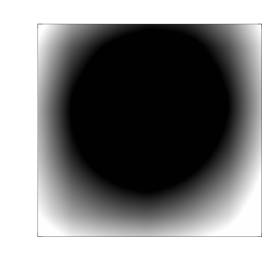
We had, in the end, a set of seven different images to analyze. The configurations for the three simulated images are shown in figure 4.

3.2.2 Analysis Parameters
The analysis of each image was performed deconvolving it in 10 wavelet coefficients, where the last coefficient corresponds to a characteristic size of 512 pixels (), which is the approximate size of the image. Two parameters were varied to evaluate the package performance. One was the object definition criterion for valid regions, which can be the “standard” case, where a minimum of two valid regions connected on subsequent wavelet coefficients define an object, or the “restricted” case, where at least three valid regions connected on subsequent wavelet coefficients are needed to define an object. The other parameter is the definition of whether a pixel belongs to a certain region or not. One possibility is the “hard thresholding”, where a flag (0 or 1) is assigned to a pixel, to mark if it belongs to the region or not. The alternative is the so called “combined evidence thresholding”, where a weight (from 0 to 1) is assigned to a given pixel.
Four possible sets of parameters were tested: I – using restricted criterion and combined evidence thresholding; II – using restricted criterion and hard thresholding ; III – using the standard criterion and the combined evidence thresholding; and IV – using the standard criterion and the hard thresholding.
The combined evidence thresholding is very sensitive to small size sky fluctuations that can appear in subsequent wavelet coefficients, creating spurious small scale object detections. We have forced the use of the hard thresholding up to the third coefficient ( pixels), to avoid such a problem. This procedure does not affect the analysis of the galaxies nor IGL component present in the images, since their characteristic sizes are much larger than those of the structures detected in the third-coefficient image.
3.2.3 Simulation Results
We first performed a global analysis of the simulated images, evaluating the differences in the integrated fluxes between the artificial models and the reconstructed objects and the quality of the reconstruction process.
Using any of the four parameter setups I to IV described above, the four galaxies of the first image (without diffuse component) can be perfectly separated. Two possible contaminating effects were identified using setups I and II (with the restricted criterion). At the fourth iteration, a “false” common halo formed by the overlapping galaxies was identified as an object, which despite being centered on the galaxies, could be mistakenly identified as part of the IGL component. A second larger “false” common halo can also be noticed in the reconstructed objects of a further iteration. With setups III and IV (those without the restricted criterion) a single “false” common halo was identified. This halo contains almost the same structure identified with setups I and II as two different objects, but more extended. The more extended single “false” halos identified in setups III and IV, indicate that those objects were detected at a larger wavelet coefficient, which would be more difficult to separate from the IGL component in a real case. The identification of these different contamination sources show the superior capability of the restricted criterion in separating embedded structures offering a more reliable object reconstruction. The contamination by those artifacts is about 2% in all cases.
In reconstructing the IGL component alone (without galaxies) we find that none of the cases I to IV presents a good description of the central region of the simulated IGL exponential profile. In other words, the central cuspy model is never reconstructed properly. Indeed, the very central profile does not follow the original circular light distribution and a radial distortion of the light profile can be noticed, which is caused by the reconstruction process using the different wavelet coefficients. This effect is stronger in the cases which do not use the combined evidence thresholding. The radial distortions for the cases with and without the combined evidence thresholding are shown in figure 5. There are no differences from the reconstructions for the cases with and without the restricted criterion.

In the third image configuration (galaxies+IGL), the galaxies reconstruction presents the same characteristics of the case without the IGL component, i.e., they present a “false” common halo in all four setups. There is a large difference in the reconstruction of the central part of the IGL component. The light of this part is actually included in the reconstruction of the galaxy component, to which it does not represent any considerable increase in flux, because of the low surface brightness of this component. The reconstruction of this component suffers from all the same effects noticed before.
A second step in the analysis of the simulated images is to study the radial profile of the IGL. Comparing the models with the reconstructed objects, for the three different intensities of the IGL component, with and without the galaxy component superposed, we can establish to which light level or our results are reliable. The central regions were poorly reconstructed and we are not taking them into account in this radial study. We have defined a cutoff radius for the analysis, after which the reconstruction of the object is no longer reliable. This radius was defined based on the flux differences between the model and the reconstructed object in each radial ring analyzed. For the maximum acceptable flux loss of the reconstructed object, we have assumed a conservative limit of 10%. In each of the six images with IGL component, this cutoff radius corresponds to a detected of about 0.1. We have generated then a new set of images, with different sky levels and sky noise levels, to test the significance of this limit. With this new set of images we confirm the cutoff radius corresponding to a limit of 0.1. This way, we have defined a minimum detected of 0.1 as the detection limit for the reconstructed objects using the OV_WAV, which represents a great improvement over the previous studies on detecting extended low surface brightness structures. A of 0.1 may seem to be an unrealistically low value for the detected structures, however we note that as the parts that compose the objects were detected in the wavelet space with a 5--detection level, these are indeed significant, even though they are very faint in normal space.
We have analyzed the artificial images using the minimum cutoff limit of 0.1 for the reconstructed objects and its corresponding models, and the comparison presented consistent results, showing that the objects reconstruction is very reliable within this limit of . The results can be seen in table 3.
| Parameters setup | |||||
| Image | Comp. | I | II | III | IV |
| Only Gal | Gal | -0.1% | +0.1% | -2.3% | -0.2% |
| Only IGL | IGL A | -8.4% | -10.0% | -8.4% | -10.0% |
| IGL B | -4.4% | -5.2% | -4.7% | -5.2% | |
| IGL C | -9.1% | -21.9% | -6.9% | -2.2% | |
| Gal+IGL | Gal | +1.0% | +1.0% | +1.1% | +1.3% |
| IGL A | -11.1% | -12.7% | -11.9% | -13.7% | |
| Total A | -2.0% | -2.4% | -2.0% | -2.4% | |
| Gal | +1.4% | +1.5% | +3.1% | +3.1% | |
| IGL B | -14.1% | -12.1% | -26.4% | -25.6% | |
| Total B | -0.6% | -0.2% | -0.6% | -0.5% | |
| Gal | +1.1% | +1.1% | +0.1% | +0.2% | |
| IGL C | -37.9% | -27.5% | -33.5% | -50.9% | |
| Total C | -1.0% | -0.4% | -1.7% | -2.5% | |
Column (1) indicates the image type, described in the text.
Column (2) indicates the analyzed component: “Gal” for the galaxies
component; “IGL” for the diffuse intra-group light component, with three
different brightness A, B and C, from brighter to fainter; and “Total”
for galaxies + IGL, with brightness A, B and C (see section 3.2.1b).
Columns (3-6) show the percentage of light difference from the
reconstructed to the model components for parameters setups I-IV, as
described in the text. Positive signal indicates a light gain during
the reconstruction and negative signal indicates a light loss.
To estimate the errors, we have used a relation of the mean of the reconstructed objects and its corresponding light loss. For the galaxy component, high surface brightness structures, the typical light loss is of 1%, and taking into consideration the possible contamination effect discussed above, as a 2% contamination, the galaxy component final error is typically of 2.2%. To estimate the errors of the low surface brightness structures, we have interpolated the –light loss relation obtained from our simulations. A 10% minimum error value was defined to structures with mean higher than 0.5, not covered by the simulations. At the faint-end, the simulated cases cover the detected range of values. For a complete description of the input parameters of the OV_WAV and the tests applied to define its confidence levels, see Epitácio Pereira et al. (2005).
4 Analysis and Results
Based on the simulations results, we chose to use the restricted criterion and the combined evidence thresholding (case I), which gave the best IGL reconstruction results. The procedure for each group is described below.
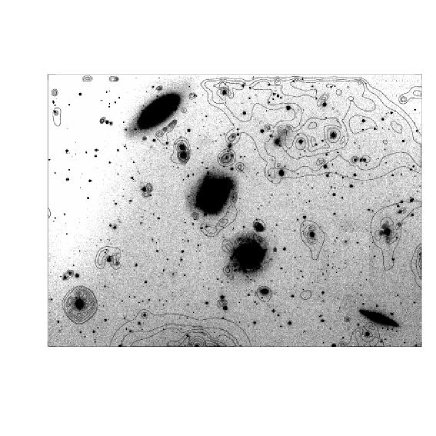
4.1 HCG 79
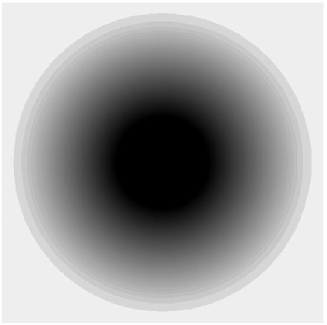
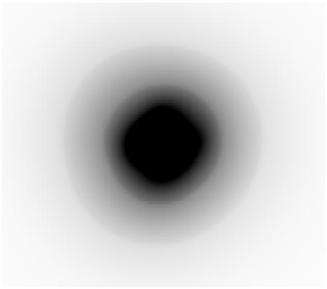
The HCG 79 images in the and bands were deconvolved in 11 wavelet coefficients ( pixels, about the size of the image). As described before, the objects were reconstructed in multiple iterations. Using the results of the multiple iterations we can recompose, separately, the group galaxies and faint structures which form the IGL component of this group, as can be seen in figure 6.
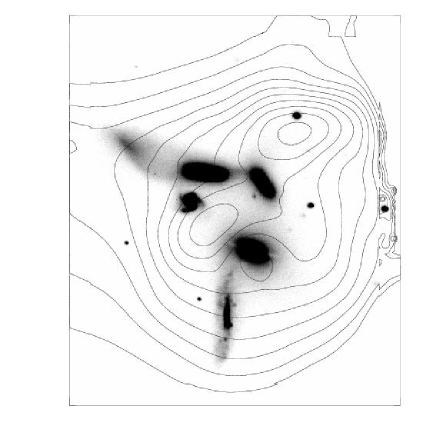
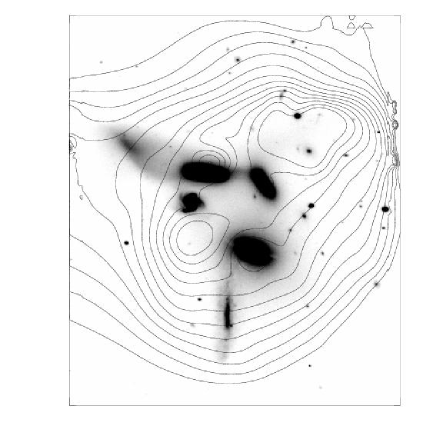
We have detected a irregular shape IGL component, that represents % of the total light in the band and % in the band, which corresponds to an apparent magnitude of and , up to the surface brightness detection limits of and . This is a bright IGL component with a mean of in the band and in the band, much brighter than the simulated cases. The detection limits correspond to the surface brightness of () in each band.
The mean surface brightness of the IGL component is and , which is magnitudes in and magnitudes in fainter than the sky brightness, while the detection limits are and magnitudes fainter than the sky brightness levels in and , respectively. The IGL component has a mean color , which is bluer than the galaxies’ component that has (typical color for early-type galaxies), and bluer than the expected value for an intracluster component (Trentham & Mobasher, 1998; Zibetti et al., 2005; Sommer–Larsen et al., 2005) formed by an old population with no significant on-going star formation, but not very different from the blue sources detected by Adami et al. (2005) in the Coma cluster. The extinction corrections were made using Rieke & Lebofsky (1985) extinction laws and Schlegel, Finkbeiner & Davis (1998) extinction maps. Measurements of the IGL and galaxy components given above were performed in the same areas for the and bands.
Taking into account the IGL component in each of the groups we recalculated the mass to light ratios () for HCG 79 and HCG 95, correcting the values estimated by Hickson et al. (1992) for the previously undetected luminous component. We note, however, that these determinations of mass-to-light ratio are very uncertain, given that the spectroscopic mass of the group was obtained from velocities of only a few group members. No X-ray mass estimates were found for these groups in the literature. For HCG 79 the drops from to .
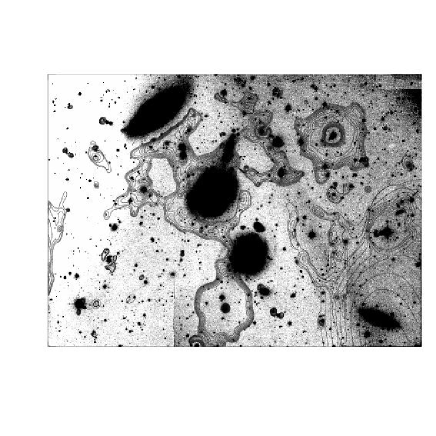
4.2 HCG 95
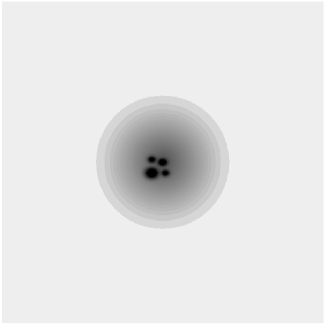
The same procedure was applied to this group and the results can be seen in figure 7.
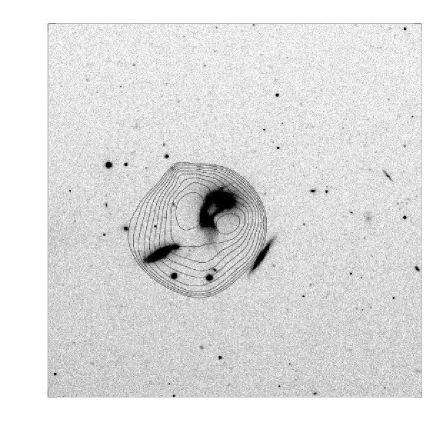
In the case of HCG 95, the results were analyzed disconsidering the discordant-redshift galaxy HCG 95B, which is not part of the group, as mentioned in Section 2.1.3. We have detected an almost spherical IGL component, much less prominent than the one in HCG 79, concentrated around the system HCG 95A/C. This is not surprising, given that there are strong interactions going on in this group - in fact the interaction between A and C may be the main source of this IGL component. We estimated that % of the total light in the band and % in the band are in this IGL component, which corresponds to an apparent magnitude of and , up to the limiting surface brightness of and . In this case, for the band, the mean is only , and for the band, a brighter IGL component was detected with mean of .
The IGL component has a mean surface brightness of and , which is 5.0 and 5.1 magnitudes fainter that the sky levels for the and bands, respectively. The detection limits are 5.9 magnitudes fainter than the sky level in the band and 7.8 magnitudes in the band. The mean color of the IGL is and the galaxies have . In this group, both the galaxies and the IGL have colors consistent with those of old stellar populations. The tidal tails of the system HCG 95A/C were considered as part of the galaxy component not as part of the IGL.
Also for this group we recalculate the , taking into account the intra-group component, which drops from (Hickson et al., 1992) to .
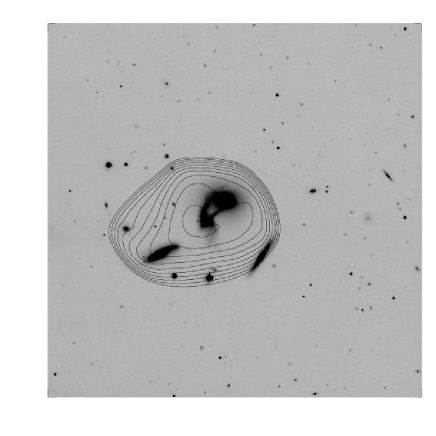
4.3 HCG 88
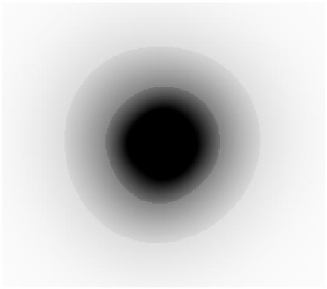
The same procedure above was also applied to this group, but in this case, no IGL component was detected up to a surface brightness detection limit of and . This is not unexpected, given that the group is composed by four late-type galaxies which contain 90% of their Hi component still attached to the galaxies disks (Verdes–Montenegro et al., 2001). Figure 8 shows the group and the detected sky level, showing that no IGL is present in this group.
Table 4 summarizes the properties of the detected IGL components in our sample.
| Group | % ( and ) | ( and ) | Mag. ( and ) | ||||
|---|---|---|---|---|---|---|---|
| HCG 79 | % | % | |||||
| HCG 88 | ND | ND | ND | ND | ND | ND | ND |
| HCG 95 | % | % | |||||
Column (1) Group studied.
Columns (2-3) Fraction of the group’s total light in the IGL component, bands
and , respectively.
Columns (4-5) Mean surface brightness of the IGL component, bands and ,
respectively.
Columns (6-7) Integrated magnitude of the IGL component, bands and ,
respectively.
Column (8) Extinction corrected color of the IGL component.
5 Discussion and Conclusions
We present here a short summary of the results we have obtained, before we proceed with the discussion:
(1) A new approach was presented for the detection of extended low surface-brightness structures, such as the IGL component in compact groups of galaxies, through wavelet analysis, using the OV_WAV package.
(2) We have detected a prominent irregular IGL component around HCG 79, which represents % and % of the total light of the group in the B and R bands, respectively. The mean color of the IGL in this group is , significantly bluer than the color of the galaxies in the group.
(3) HCG 95 presents a fainter IGL component, representing % and % of the group’s total light in the and bands, respectively, with a mean color .
(4) The filamentary group HCG 88 presented no IGL component, down to the surface brightness detection limit, as expected for a group composed by late-type galaxies with most of its Hi still in the galaxies disks.
Using the OV_WAV package we were able to detect the IGL component of compact groups of galaxies, a very difficult task to be performed with the usual algorithms, for which it is necessary to specify the sky brightness levels and the stars/galaxies models. The usual way to determine the IGL component, performed by Nishiura et al. (2000) for HCG 79, for an example, is to model the galaxies with STSDAS.ELLIPSE and subtract them from the image (with STSDAS.BMODEL). Then one just measures the remaining light above a chosen sky level, and assign it to the IGL component. Another method used, in this case for HCG 90, was that by White et al. (2003), of isophotal analysis: after sky subtraction, all the light below a certain surface brightness level was considered as IGL. Those technics are highly undesirable specially in cases such as those of HCG 79 or HCG 95, where elliptical models (fit by STSDAS.ELLIPSE) are a very bad representation for the morphology of the galaxies, and the presence of bright interacting features may increase the isophotal analysis ambiguity. With the OV_WAV, the IGL detection could be performed without any “a priori” information about the shapes of the galaxies or the sky level.
An evolutionary sequence can be envisioned, for our small sub-sample of compact groups, where HCG 79 is the more evolved group, HCG 95 is in an intermediate stage of evolution and HCG 88 is a group that has just started its evolution as a group. We give details of each group below.
5.1 HCG 79
The IGL component detected in HCG 79, a group which show several indications of been “about to collapse” in a single structure, or at an advanced evolutionary stage, has a light envelope with irregular form which takes up about one third to half the total group light. Such a high contribution from the IGL component is in contrast with the value of 13% found by Nishiura et al. (2000), for the same group, from independent and -band data, although the morphology of the IGL was found to be very similar. The disagreement probably comes from the technic differences described above.
We can notice in figure 6 a strong light concentration to the northwest, opposite to the tidal debris located to the northeast, which could have being generated in the same interaction process, like symmetrical tidal tails, but with a smaller amount of mass.
The irregular shape of the IGL may be an indication that the group potential is not relaxed in an spherical shape. On the other hand, the amount of light in the IGL component of HCG 79 suggests that the group has probably already been in a compact configuration for some time.
The X-rays halo observed with ROSAT by Pildis et al. (1995b) (in a 3 level), is spatially coincident with the IGL component, indicating that this is following the gravitational potential and it is tracing the dark matter halo of the group. The Hi of the group is concentrated in two clouds, one in the southern part, below the only late-type galaxy (HCG 79D), and one in the region of the northeastern tidal debris. These were probably a result of an interaction of this late-type galaxy with the group halo (Williams et al., 1991; Verdes–Montenegro et al., 2001).
According to Palma et al. (2002) this group presents on one hand signs of high dynamical evolution, specially in the optical, since tidal structures in broad band optical images are clearly seen, and signs of almost no evolution, on the Hi content, which is basically associated to the disk of the only late-type galaxy (HCG 79D), which leads to the absence of interaction triggered star formation. The star clusters found in Palma et al. (2002) are red and even though they may have been formed during interaction processes, they are old clusters ( to yr). No tidal dwarf galaxies and just a few dwarfs were detected. Palma et al. (2002) classified this group as being at an intermediate stage of evolution (they used the expression “beginning of the end” to describe the evolutionary stage of this group). This classification also agrees with the findings of Coziol, Brinks & Bravo–Alfaro (2004), who used a relation between group velocity dispersion and galaxy activity. An IGL component of this group is mentioned as an optical evidence of dynamical evolution, and our high fraction of IGL indicates that this group is really half way to collapse or a step further.
The mean color of the galaxies in HCG 79 is consistent with the expected old stellar population of a group dominated by early-type galaxies, while the IGL component is significantly bluer. The blue color of the IGL in HCG 79 is inconsistent with the observations and simulations for galaxy clusters (Trentham & Mobasher, 1998; Sommer–Larsen et al., 2005) and even for higher redshifts studies as Zibetti et al. (2005) at in the SDSS clusters. The stellar populations which constitute the diffuse light could have been partially stripped from the outer parts of the group galaxies, during interaction processes, as the bright tidal debris described before and partially due to the destruction of dwarf galaxies with bluer colors than the giant group members. The destruction of dwarf galaxies by the group tidal field is one of the possible mechanisms of formation of the bimodal globular cluster population usually found in early-type galaxies and may contribute to the IGL component as well (Hilker, Infante & Richtler, 1999). No blue dwarf galaxy was detected in this group by Palma et al. (2002). Blue diffuse regions were detected by Adami et al. (2005) in the Coma cluster, where spiral galaxies were disrupted or harassed, leading to infall of star-forming material to the cluster potential.
The fraction of light in the IGL component of HCG 79 is , at the groups distance, which corresponds to a galaxy twice as large as HCG 79A, the brightest group galaxy. Tidal stripping of the galaxies’ outer parts is the most probable explanation for the small size of those galaxies, about a third of the size of a normal disk galaxy (Williams et al., 1991).
5.2 HCG 95
HCG 95 presents a nearly spherical IGL component centered on HCG 95A. This group shows several tidal features indicating clear interaction and has an IGL component which corresponds to about 10% of the total light of the group. This is most probably formed by the stripping of material from the interacting galaxies.
This group was detected in X-rays by ROSAT (Ponman et al., 1996) with a flux upper limit of , indicating a shallow potential well, typical of spiral-dominated groups and was also detected in infrared by IRAS, with emission centered on HCG 95C and enclosing the whole group (Allam et al., 1996). HCG 95C1 and C2, HCG 95D and two previously unknown dwarf galaxies were detected in Hi. In addition, radio continuum emission was searched for within a field of 9 arcminutes around the group and HCG 95C (centered on C1) was detected as a continuum source (Huchtmeier et al., 2000; Verdes–Montenegro et al., 2001).
HCG 95 presents clear signs of interactions as tidal tails and bridges, emission and TDG candidates on the main tidal tail (Iglesias–Páramo & Vílchez, 2001). The interaction system (HCG 95A/C), which is indeed formed by three galaxies (an elliptical, HCG 95A, and two disk galaxies, HCG 95C1 and C2) giving rise to the complex arrangement of tidal tails observed in this group, was studied by Iglesias–Páramo & Vílchez (1997, 1998) and two models were proposed. The first one suggests that the two disk galaxies (C1 and C2) are in on-going interaction and this pair interacts with the elliptical galaxy. The second scenario puts forward that the two disk galaxies interact independently with the elliptical galaxy in different times, generating a pair of tails each and are projected over each other (see Iglesias–Páramo & Vílchez, 1997, 1998, for a more complete description of the models).
The on-going interactions suggest that this group is young, or entering an intermediate stage of dynamical evolution. Iglesias–Páramo & Vílchez (1997), found unusual color and patches of dust in the elliptical galaxy, which together with the emission would be a sign of mass transfer among the galaxies through the tidal tails. The authors argue that those effects where indicating that this interacting system would probably merge in a few orbital periods.
The detected IGL component has a magnitude of , which is about one third of the total luminosity of HCG 95A. This result gives support to the scenario that puts forward that this group is in an intermediate evolutionary stage, since the IGL component has most probably been created by the interaction of HCG 95A/C. No extension of the IGL was detected towards the discordant galaxy HCG 95B, an additional indication that this galaxy does not belong to the group.
5.3 HCG 88
No IGL component was detected for HCG 88 down to the surface brightness detection limit of and . This result supports the scenario of HCG 88 being a filamentary system which has just initiated its evolution. Further support to this scenario comes from the Hi observations for the group galaxies: all four late-type galaxies of the group still contain 90% of the Hi attached to their disks (Verdes–Montenegro et al., 2001) suggesting this is a group that has been together for a short time.
The very low velocity dispersion of this group, , lower than the expected for a virialized structure with the group characteristics, was used by Mamon (2000) to argue that this group would be a chance alignment of galaxies in a turnaround point. This group was also pointed out as a good candidate for Hernquist, Katz & Weinberg (1995) projected filamentary groups.
On the other hand, according to Verdes–Montenegro et al. (2001), a group with a filamentary structure such as HCG 88, with very low velocity dispersion and short crossing time (very different from the predicted from Hernquist et al., 1995, simulations), with a high fraction of Hi associated to the galaxy disks and very isolated (there are only two galaxies, about 3 magnitudes fainter than the faintest giant member galaxy, HCG 88D, in a 700 kpc-side square centered on the group, de Carvalho et al., 1997) is very improbable to be a chance alignment. Our conclusion that the group is in an initial evolutionary stage agrees with the results from Plana et al. (2003) and Coziol et al. (2004). Dynamical friction could also be responsible for low observed group velocity dispersion, but it would only be expected in a group in advanced stage of collapse, which does not seem to be the case here.
5.4 Final Remarks
No significant relations between the structure size and the intra-group or intracluster light fraction were found. The literature points to values ranging from 16 to 28% for clusters with richness 2 (Feldmeier et al., 2004), 13% for a cluster with richness 3 (Feldmeier et al., 2002), an average of 11% for clusters at (Zibetti et al., 2005), 17 to 43% in Virgo, depending on the studied region (Arnaboldi et al., 2002) and 50% in Coma (Bernstein et al., 1995). The fraction of IGL found for HCG 79 is a high value. It is interesting to note that the values for clusters may include the light of several galaxies which are not in reality involved in the interaction processes that generate the intracluster component, but in compact groups, in particular for HCG 79, all the member galaxies seem to be somehow involved in the interactions.
We could recalculate the for HCG 79 and HCG 95, estimated by Hickson et al. (1992), correcting the luminous component by the IGL detected in this work. However, these measurements are very uncertain given that the only mass determinations available for these groups are from the spectroscopy of a few member galaxies (Hickson et al., 1992). Therefore, any attempt to find correlations between mass, or , and the IGL fraction would be speculative at this point.
Hickson et al. (1992) point out a possible relation where shorter group crossing times would indicate a more evolved stage, estimated by the spiral fraction and the magnitude difference between the first and the second ranked galaxies (). Taking the IGL fraction as a dynamical evolution indicator, the groups studied here do follow the same trend, however without any statistical significance given the size of our sample (three groups). HCG 79 has a crossing time of and an IGL fraction of %, HCG 95 has a crossing time of and an IGL fraction of % and HCG 88 has a crossing time of and no IGL detection.
The study of the relations between the IGL characteristics and the group environment will be addressed in a forthcoming paper when a statistically significant sample can be studied.
In conclusion, with the presently studied sample we could define an evolutionary sequence, in which HCG 79 is the more evolved, in an about-to-collapse stage; HCG 95 is an intermediate to young group in this sequence; and finally HCG 88 is the least evolved of the groups, which has just started its dynamical evolution.
6 Acknowledgments
We would like to thank Mike Bolte for obtaining the images, doing the pre-reduction and the photometric calibration, Hugo Capelato and Bodo Ziegler for the long science discussions and support to this project, Carlos Rabaça and Daniel Epitácio Pereira for the software development and support and Francisca Brasileiro for taking the spectrum of HCG 95B. We also would like to thank the referee of this paper, Dr. Christophe Adami, for useful comments which improved this manuscript considerably. CDR is supported by FAPESP (Fundação de Amparo a Pesquisa do Estado de São Paulo) grants No. 96/08986–5 and 02/06881–4 and CAPES/DAAD (Coordenação de Aperfeiçoamento de Pessoal de Nível Superior/Deutscher Akademischer Austausch Dienst) grant No. BEX: 1380/04–4. CMdO would like to acknowledge support from the Brazilian agencies FAPESP (projeto temático 01/07342-7), CNPq and CAPES.
References
- Adami et al. (2005) Adami, C., Slezak, E., Durret, F., Conselice, C. J., Cuillandre, J. C., Gallagher, J. S., Mazure, A., Pelló, R., Picat, J. P. & Ulmer, M. P. 2005, A&A, 429, 39
- Allam et al. (1996) Allam, S., Assendorp, R, Longo, G., Braun, M. & Richter, G. 1996, A&AS, 117, 39
- Arnaboldi et al. (2002) Arnaboldi, M., Aguerri, J. A. L., Napolitano, N. R., Gerhard, O., Freeman, K. C., Feldmeier, J., Capaccioli, M., Kudritzki, R. P. & Méndez, R. H. 2002, AJ, 123, 760
- Barnes (2002) Barnes, J. E. 2002, MNRAS, 333, 481
- Bernstein et al. (1995) Bernstein, G. M., Nichol, R. C., Tyson, J. A., Ulmer, M. P. & Wittman, D. 1995, AJ, 110, 1507
- Bijaoui & Rué (1995) Bijaoui, A. & Rué, F. 1995, Signal Processing, 46, 345
- Bonfanti et al. (1999) Bonfanti, P., Simien, F., Rampazzo, R. & Prugniel, Ph. 1999, A&AS, 139, 483
- Braine et al. (2000) Braine, J., Lisenfeld, U., Duc, P.-A & Leon, S. 2000, Nature, 403, 867
- Calcáneo–Roldán (2000) Calcáneo–Roldán, C., Moore, B., Bland–Hawthorn, J., Malin, D. & Sadler, E. M. 2000, MNRAS, 314, 324
- Christian et al. (1985) Christian, C. A., Adams, M., Barnes, J. V., Butcher, H., Hayes, D. S., Mould, J. R. & Siegel, M. 1985, PASP, 97, 363
- Coziol et al. (2004) Coziol, R., Brinks, E. & Bravo–Alfaro, H. 2004, AJ, 128, 68
- de Carvalho et al. (1997) de Carvalho, R. R., Ribeiro, A. L. B., Capelato, H. V. & Zepf, S. E. 1997 ApJS, 110, 1
- de Vaucouleurs (1960) de Vaucouleurs, G. 1960, ApJ, 131, 585
- de Vaucouleurs et al. (1991) de Vaucouleurs, G., de Vaucouleurs, A., Corwin, H. G., Jr., Buta, R. J., Paturel, G. & Fouqué, P. 1991, Third Reference Catalogue of Bright Galaxies, Springer Verlag, New York (RC3)
- Dressler (1984) Dressler, A. 1984, ARA&A, 22, 185
- Drinkwater et al. (2003) Drinkwater, M. J., Gregg, M. D., Hilker, M., Bekki, K., Couch, W. J., Ferguson, H. C., Jones, J. B. & Phillipps, S. 2003, Nature, 423, 519
- Dubinski et al. (2003) Dubinski, J., Koranyi, D. & Geller, M. 2003, in IAU Symp. 208, Astrophysical Supercomputing Using Particle Simulations, Eds. J. Makino & P. Hut (San Francisco: ASP), 237
- Epitácio Pereira et al. (2005) Epitácio Pereira, D. N. E., Rabaça, C. R. & Da Rocha, C. 2005, In Preparation
- Feldmeier et al. (1998) Feldmeier, J. J., Ciardullo, R. & Jacoby, G. H. 1998, ApJ, 503, 109
- Feldmeier et al. (2002) Feldmeier, J. J., Mihos, J. C., Morrison, H. L., Rodney, S. A. & Harding, P. 2002, ApJ, 575, 779
- Feldmeier et al. (2004) Feldmeier, J. J., Mihos, J. C., Morrison, H. L., Harding, P., Kaib, N. & Dubinski, J. 2004, ApJ, 609, 617
- Ferguson et al. (1998) Ferguson, H. C., Tanvir, N. R. & von Hippel, T. 1998, Nature, 391, 461
- Fouqué et al. (1992) Fouqué, P., Durand, N., Bottinelli, L., Gouguenheim, L. & Paturel, G. 1992, “Catalogue of Optical Radial Velocities”, “Observatoires de Lyon et Paris–Meudon”, vol. 1, p. 1
- Gallagher & Ostriker (1972) Gallagher, J. S. & Ostriker, J. P. 1972, AJ, 77, 288
- Gnedin (2003) Gnedin, O. Y. 2003, ApJ, 589, 752
- Gonzalez et al. (2000) Gonzalez, A. H., Zabludoff, A. I., Zaritsky, D. & Dalcanton, J. J. 2000, ApJ, 536, 561
- Gregg & West (1998) Gregg, M. D. & West, M. J. 1998, Nature, 396, 549
- Hernquist et al. (1995) Hernquist, L., Katz, N. & Weinberg, D. H. 1995, ApJ, 442, 57
- Hibbard & Mihos (1995) Hibbard, J. E. & Mihos, J. C. 1995, AJ, 110, 140
- Hickson (1982) Hickson, P. 1982, ApJ, 255, 382
- Hickson et al. (1992) Hickson, P., Mendes de Oliveira, C., Huchra, J. P. & Palumbo, G. G. 1992, ApJ, 399, 353
- Hilker et al. (1999) Hilker, M., Infante, L. & Richtler, T. 1999, A&AS, 138, 55
- Huchtmeier et al. (2000) Huchtmeier, W. K., Verdes–Montenegro, L., Yun, M., del Olmo, A. & Perea, J. 2000, “Small Galaxy Groups”, Eds. M. Valtonen & C. Flynn, IAU Coll. 174, ASP Conf. Ser., 209, 154
- Iglesias–Páramo & Vílchez (1997) Iglesias–Páramo, J. & Vílchez, J. M. 1997, ApJ, 489, L13
- Iglesias–Páramo & Vílchez (1998) Iglesias–Páramo, J. & Vílchez, J. M. 1998, AJ, 115, 1791
- Iglesias–Páramo & Vílchez (2001) Iglesias–Páramo, J. & Vílchez, J. M. 2001, ApJ, 550, 204
- Korchagin et al. (2001) Korchagin, V., Tsuchiya, T. & Miyama, S. M. 2001, ApJ, 549, 244
- Landolt (1992) Landolt, A. U. 1992, AJ, 104, 340
- Mamon (2000) Mamon, G. A. 2000, “Small Galaxy Groups”, Eds. M. Valtonen & C. Flynn, IAU Coll. 174, ASP Conf. Ser., 209, 217
- Mendes de Oliveira & Hickson (1994) Mendes de Oliveira, C. & Hickson, P. 1994, ApJ, 427, 684
- Merritt (1983) Merritt, D. 1983, ApJ, 264, 24
-
Mihos (2003)
Mihos, J. C. 2003, in
Carnegie Obs. Astrophys. Ser. 3, Cluster of Galaxies: Probes of
Cosmological Structure and Galaxy Evolution, Eds. J. S. Mulchaey, A.
Dressler, & A. Oemler (Pasadena: Carnegie Observatories),
http://www.ociw.edu/ociw/symposia/series/
symposium3/proceedings.html - Mihos & Hernquist (1996) Mihos, J. C. & Hernquist, L. 1996, ApJ, 464, 641
- Mirabel et al. (1991) Mirabel, I. F., Lutz, D. & Maza, J. 1991, A&A, 243, 367
- Moles et al. (1998) Moles, M., Márquez, I. & Sulentic, J. W. 1998, A&A, 334, 473
- Moore et al. (1998) Moore, B., Lake, G. & Katz, N. 1998, ApJ, 495, 139
- Murante et al. (2004) Murante, G., Arnaboldi, M., Gerhard, O., Borgani, S., Cheng, L. M., Diaferio, A., Dolag, K., Moscardini, L., Tormen, G., Tornatore, L. & Tozzi, P. 2004, ApJ, 607, L83
- Naab & Burkert (2001) Naab, T. & Burkert, A. 2001, in The Central Kpc of Starbursts and AGN: The La Palma Connection, Ed. J. H. Knapen et al.(San Francisco: ASP), 735
- Napolitano et al. (2003) Napolitano, N. R., Pannella, M., Arnaboldi, M., Gerhard, O., Aguerri, J. A. L., Freeman, K. C., Capaccioli, M., Ghigna, S., Governato, F., Quinn, T. & Stadel, J. 2003, ApJ, 594, 172
- Neill et al. (2005) Neill, J. D., Shara, M. M. & Oegerle, W. R. 2005, ApJ, 618, 692
- Nishiura et al. (2000) Nishiura, S., Murayama, T., Shimada, M., Sato, Y., Nagao, T., Molikawa, K., Taniguchi, Y. & Sanders, D. B. 2000, AJ, 120, 2355
- Palma et al. (2002) Palma, C., Zonak, S. G., Hunsberger, S. D., Charlton, J. C., Gallagher, S. C., Durrell, P. R. & English, J. 2002, AJ, 124, 2425
- Plana et al. (2003) Plana, H., Amram, P., Mendes de Oliveira, C., Balkowski, C. & Boulesteix, J. 2003, AJ, 125, 1736
- Pildis et al. (1995b) Pildis, R. A., Bregman, J. N. & Evrard, A. E. 1995b, ApJ, 443, 514
- Pildis et al. (1995a) Pildis, R. A., Bregman, J. N. & Schombert, J. M. 1995a, AJ, 110, 1498
- Ponman et al. (1996) Ponman, T. J., Bourner, P. D. J., Ebeling, H. & Böhriger H. 1996, MNRAS, 283, 690
- Quilis et al. (2000) Quilis, V., Moore, B. & Bower, R. 2000, Science, 288, 1617
- Richstone & Malumuth (1983) Richstone, D. O. & Malumuth, E. M. 1983, ApJ, 268, 30
- Rieke & Lebofsky (1985) Rieke, G. H. & Lebofsky, M. J. 1985, ApJ, 288, 618
- Rose (1979) Rose, J. A. 1979, ApJ, 231, 10
- Scheick & Kuhn (1994) Scheick, X. & Kuhn, J. R. 1994, ApJ, 423, 566
- Schlegel et al. (1998) Schlegel, D. J., Finkbeiner, D. P. & Davis, M. 1998, ApJ, 500, 525
- Schweizer (1987) Schweizer, F. 1987, “Nearly Normal Galaxies”, Ed. S. M. Faber (Springer–Verlag, New York), p. 18
- Seyfert (1948) Seyfert, C. K. 1948, AJ, 53, 203
- Shimada et al. (2000) Shimada, M., Ohyama, Y., Nishiura, S., Murayama, T. & Taniguchi, Y. 2000, AJ, 119, 2664
- Sommer–Larsen et al. (2005) Sommer–Larsen, J., Romeo, A. D. & Portinari, L. 2005, MNRAS, 357, 478
- Starck et al. (1998) Starck, J.-L., Murtagh, F. & Bijaoui, A. 1998, “Image Processing and Data Analysis. The Multiscale Approach.”, Cambridge University Press
- Sulentic & Lorre (1983) Sulentic, J. W. & Lorre, J. J. 1983, A&A, 120, 36
- Trentham & Mobasher (1998) Trentham, N. & Mobasher, B. 1998, MNRAS, 293, 53
- Uson et al. (1991) Uson, J. M., Boughn, S. P. & Kuhn, J. R. 1991, ApJ, 369, 46
- Verdes–Montenegro et al. (2001) Verdes–Montenegro, L., Yun, M. S., Williams, B. A., Huchtmeier, W. K., Del Olmo, A. & Perea, J. 2001, A&A, 377, 812
- Vílchez & Iglesias–Páramo (1998) Vílchez, J. M. & Iglesias–Páramo, J. 1998, ApJS, 117, 1
- Vílchez–Gómez (1999) Vílchez–Gómez, R. 1999, “The Low Surface Brightness Universe”, Eds. Davies, J., Impey, C. & Phillips, S., IAU Coll. 171, ASP Conf. Proc. Series 170, p. 349.
- White et al. (2003) White, P. M., Bothun, G., Guerrero, M. A., West, M. J. & Barkhouse, W. A. 2003, ApJ, 585, 739
- Williams et al. (1991) Williams, B. A., McMahon, P. M. & van Gorkom, J. H. 1991, AJ, 101, 1957
- Willman et al. (2004) Willman, B., Governato, F., Wadsley, J. & Quinn, T. 2004, MNRAS, 355, 159
- Zibetti et al. (2005) Zibetti, S., White, S. D. M., Schneider, D. P. & Brinkmann, J. 2005, MNRAS, 358, 949
- Zwicky (1951) Zwicky, F. 1951, PASP, 63, 61
- Zwicky (1956) Zwicky, F. 1956, Ergeb. Exakten Naturwiss, 29, 344