11email: linda@physto.se 22institutetext: Department of Physics, Stockholm University, SE 106 91 Stockholm, Sweden
22email: ariel@physto.se 33institutetext: Department of Astronomy, Stockholm University, SE 106 91 Stockholm, Sweden
33email: edvard@astro.su.se
Looking at quasars through galaxies
Observations of quasars (QSOs) shining through or close to galaxies offer a way to probe the properties of the foreground matter through dust extinction and gravitational lensing. In this paper the feasibility of measuring the dust extinction properties is investigated using the backlitting of QSOs. We test our method to search for QSOs affected by intervening extinction, by matching the coordinates in the SDSS QSO DR3 catalogue with the New York University Value-Added Galaxy Catalog. In total, 164 QSO-galaxy pairs were found with a distance of less than 30 kpc between the galaxy centre and the QSO line-of-sight at the galaxy redshift. Investigating the QSO colours with multiband SDSS photometry, two pairs with galaxy redshifts were found to be particularly interesting in that the QSOs show evidence of heavy Galactic type extinction with at very large optical radii in the foreground spiral galaxies. With the available data, it remains inconclusive whether the two pairs can be explained as statistical colour outliers, by host extinction or if they provide evidence of dust in the outskirts of spiral galaxies. Deeper galaxy catalogues and/or higher resolution follow-up QSO spectra would help in resolving this problem. We also analyse five QSOs reported in the literature with spectroscopic absorption features originating from an intervening system. These systems are at higher redshifts than the other two and we find in most cases significantly lower best fit values of . The wide range of preferred values of found, although affected by substantial uncertainties, already indicates that the dust properties in other galaxies may be different from the Milky Way. Furthermore, the available data suggests a possible evolution in the dust properties with redshift, with lower at high .
Key Words.:
dust,extinction – galaxies: ISM – galaxies: evolution – quasars: general – techniques: photometric1 Introduction
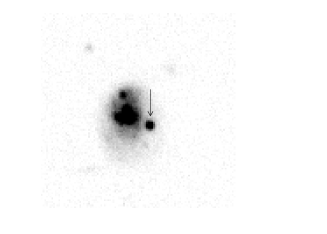
Understanding the size and composition of the dust grains in galaxies provides important astrophysical information. Moreover, it is of critical importance to correct observations for extinction losses due to dust, e.g. when measuring cosmological distances with supernovae. It is often assumed that the reddening properties by dust in all galaxies follow the average properties of the Milky Way. The purpose of this work is to examine ways of improving our understanding of the range of extinction properties. Earlier analyses of dust in distant galaxies have made use of e.g. multiply imaged QSOs (e.g. Nadeau et al. Nadeau (1991); Falco et al. Falco:1999jc (1999)) or galaxy backlitting (e.g. Keel & White Keel2001B (2001)). The method of using multiply imaged QSOs has been criticised by McGough et al. (McGough (2005)) since it is implicitly assumed that one of the images is barely affected by the dust or that the reddening laws along the two lines-of-sight are very similar. In addition, a method based on sources found through strong lensing is only efficient for very massive galaxies, i.e. less suitable for normal spiral galaxies, especially at low redshifts where the probability for strong lensing is low. Furthermore, the time variability of QSOs complicates the interpretation of colours from different lensed images, as these correspond to different emission times at the source. In this paper, a method is proposed where the extinction in galaxies is investigated using observed colours of single background QSO images shining through or close to foreground galaxies (as shown in Fig. 1), taking advantage of the homogeneous spectral properties of QSOs. With the current limited data we cannot distinguish between host extinction and intervening extinction. However, the method will be useful with future larger samples of QSO-galaxy pairs.
Even though QSOs show small dispersion in their spectral properties, a population of redder QSOs have been found in studies of QSO colours (see e.g. Richards et al. Richards (2001)). These could be explained invoking extinction by dust, either at the central engine, in the host galaxy or in a foreground galaxy. There are some indications that the reddening is dominated by extinction from the host galaxy and only rarely from an intervening galaxy. Hopkins et al. (Hopkins (2004)) found that reddened QSOs more often have narrow absorption lines originating from the QSO redshift than QSOs unaffected by reddening. No correlation was found between the reddening of QSOs and the presence of narrow absorption lines originating from smaller redshifts. In this work, the presence of QSOs affected by intervening extinction is investigated further by studying pairs of QSOs and foreground galaxies at small projected distances, comparable to galaxy sizes. As such systems would also fall into the category of potential gravitational lensing candidates, we also examine their expected (achromatic) magnification.
In Sec. 2, different parametrisations of dust attenuation are discussed. In Sec. 3, our method for finding QSOs affected by dust extinction is presented and in Sec. 4, the reddening of a sample of QSOs with foreground extinction features are investigated. A discussion follows in Sec. 5 and a summary of the results in Sec. 6.
Throughout the paper, the cosmological parameters have been assumed to be , , and .
2 Reddening by dust
Within the commonly used extinction laws, the specific dust properties can be quantified by the dimensionless reddening parameter, the total-to-selective extinction ratio , defined by
| (1) |
where is the V-band extinction and is the colour excess,
| (2) |
The observed colour is denoted by and the intrinsic colour by . Large grains of dust would produce (nearly) grey extinction with . Rayleigh scattering () would lead to a very steep reddening, .
The typical value found for the reddening parameter in the Milky Way is , but it has been suggested that it varies between sight-lines in the interval (see e.g. Draine draine03 (2003) and references therein). In other distant galaxies, values of have been derived in the interval (Falco et al. Falco:1999jc (1999)), where the lower values occur in spiral galaxies and the higher values in ellipticals.
Observations of colours of low-redshift Type Ia supernovae have also been used to constrain the dust properties of their host galaxies (e.g. Jöeveer joeveer (1983); Branch & Tammann branch&tammann (1992); Riess, Press & Kirshner Riess (1996); Reindl et al. Reindl (2005); Guy et al. guy (2005)). Intriguingly, the average reddening parameter has been found to be significantly smaller than in the Milky Way. However, the effect is hard to disentangle from a possible colour-brightness correlation in supernovae or reddening by circumstellar dust, possibly significantly different from dust in the interstellar medium. Thus, an independent investigation using QSO colours could help to break this degeneracy.
Two parametrisations are often used to describe the extinction law in our galaxy: Cardelli, Clayton and Mathis (Cardelli:1989fp (1989), CCM) and by Fitzpatrick (Fitzpatrick:1999 (1999), FTZ). The difference between these parametrisations are most important for large values of .
For other galaxies, the extinction curves have only been thoroughly investigated for the Magellanic Clouds, where individual stars can be resolved. The Magellanic extinction curves are very similar to the Galactic in the visible and the near-infrared. In the UV, however, the extinction curve for the Small Magellanic Cloud (SMC) differs significantly: the curve is almost linear in , i.e. the Galactic type dust bump at 2175 Å is not present. The SMC have lower dust and metal abundances than the Milky Way and may be more representative of high redshift galaxies. There is also evidence that the 2175 Å bump is not present in damped Ly systems (Pei et al. Pei:1999 (1999)). Yet, it is often assumed that the Galactic laws can be applied to dust in other galaxies.
3 Looking for QSOs affected by intervening extinction
In order to test the feasibility of finding and using QSOs affected by dust absorption in a foreground galaxy, the coordinates of the 50 748 QSOs in the third data release of the Sloan Digital Sky Survey (Schneider et al. Schneider:2005 (2005)) were cross-correlated with the positions of the galaxies in the New York University Value-Added Galaxy Catalog (Blanton et al. Blanton:2004aa (2005); Abazajian et al. Abazajian:2004aj (2004)). All objects in the galaxy catalogue where the classification has been disputable have been removed. Among these were objects within 0.5 arcseconds from a QSO, which often seemed to be multiple detections of the same source. We also require that the redshift of the galaxy is determined spectroscopically. Only QSOs in the redshift range were considered, as many of the QSOs outside this range were found to be less accurately described by the QSO spectral template made of the HST radio-quiet composite spectrum (Telfer et al. Telfer (2002)) combined with the SDSS median composite spectrum (Vanden Berk et al. VandenBerk:2001hc (2001)). At higher redshifts, the flux decrement due to the Ly- break makes the bluer bands inefficient.
In the following, a galaxy will be considered as a foreground galaxy if the distance from the centre of the galaxy to a QSO line-of-sight (the impact parameter) is less than 30 kpc at the galaxy redshift. The sample then contains 164 pairs of QSOs and galaxies. The smallest impact parameter found with respect to the foreground galaxy was 2 kpc. Note that all distances are in units of . Note also that the New York University Value-Added Galaxy Catalog is very incomplete at .
For the 164 selected QSOs, the rest-frame colour was estimated by K-correcting from the observed bands (corrected for Galactic absorption using the values from SDSS given by the maps of Schlegel et al. (schlegel (1998))) using the template QSO spectrum. The QSOs with foreground galaxies are only slightly redder than the QSOs not associated with a foreground galaxy (the mean value of differs by mag). The two distributions of rest-frame colours were compared using the Kolmogorov-Smirnov test, yielding a 78 % probability that the difference is only due to statistical fluctuations. Thus, we conclude that most of the QSOs of the selected sample have colours that are indistinguishable from the QSOs without associated foreground galaxies. Note, however, that this does not exclude the possibility that both samples contain QSOs reddened by dust in the host galaxy or in intervening galaxies that may or may not be resolved. Next, we looked for a possible subset of QSOs in the selected sample whose colours were best matched with dust extinction at the redshift of the foreground galaxy. For that purpose we compared the observed QSO colours with synthetic colours derived from the QSO spectral template. The template spectrum was redshifted and reddened as if attenuated by dust at the redshift of the intervening galaxy. A grid with a wide range of values of and was investigated using the parametrisation by Fitzpatrick. The expected colours at the QSO redshift were used to compute the , , , and magnitudes from the measured -band magnitude. To find the values of and that give the best fit for a certain QSO-galaxy pair, we minimise
| (3) |
where and are the simulated and the observed magnitudes, respectively. is the covariance matrix calculated from a set of QSOs with similar redshifts () without any visible foreground galaxies. To avoid a too large impact from colour outliers, QSOs with colours differing by more than two standard deviations from the mean were removed in the calculation of the covariance matrix.
In the process of selecting which of the 164 QSOs that are most likely to be affected by intervening absorption, the following cuts were made in order to minimise the number of “fake” detections while still retaining “good” candidates with foreground absorption:
-
1.
The fit of the QSO spectrum with the template without dust extinction had to be worse (higher ) than the fit for at least 90 % of 10 000 randomly chosen QSOs without visible foreground galaxies.
-
2.
The best fit for dust extinction must be better than the fit for at least 90 % of the randomly chosen QSOs affected by a mock foreground galaxy.
Two QSO-galaxy pairs survived both cuts. The foreground object was a spiral galaxy in both of these systems. For the randomly chosen QSOs without visible intervening galaxies, only 0.2 % survived both cuts. Thus, for the QSO-galaxy sample 0.3 “fake” detections are expected. Using Poisson statistics we thus conclude that the likelihood for both events to be false is less than 4 % (, for respectively). However, we cannot exclude the possibility that the two selected quasars are colour outliers in the poorly understood tail of the colour distribution.
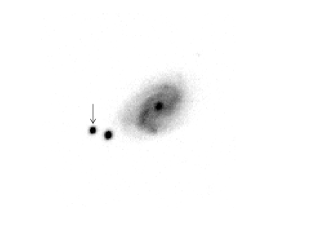
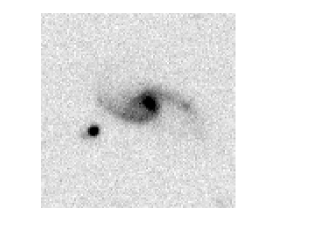
The low number of pairs surviving both cuts consolidates our earlier conclusion that the bulk of the sample with 164 QSOs with foreground galaxies are not significantly different from the whole sample. This is also confirmed by a visual inspection of all QSO-galaxy pairs showing that, due to the relatively large impact parameters, only two of the QSOs are clearly behind any visible part of the foreground galaxy. These two, however, did not make it through the cuts. Both of the QSOs that survived the cuts have an impact parameter close to, but clearly outside the visible parts of the foreground galaxy see Fig. 2. In both pairs, the surface brightness of the galaxy at the position of the QSO is of the order 0.1 % of the central galaxy surface brightness. This fact puts limitations to the possible intervening extinction, unless there are significant amounts of dust outside the optical disc of spiral galaxies. In the following, these two pairs will be used to demonstrate our method, even though it is possible that the derived extinction is not only due to foreground extinction, but could also be due to host extinction.
Information about the two remaining QSO-galaxy pairs, as well as the fitted dust parameters are listed in Table 1.
| DR3 Object Designation | Impact (”) | Impact (kpc) | |||||||
|---|---|---|---|---|---|---|---|---|---|
| J131058.13+010822.2 | 1.389 | 197.744 | 1.145 | 0.0357 | 12” | 22” | 15 | ||
| J084957.97+510829.0 | 0.584 | 132.490 | 51.145 | 0.0734 | 10” | 14” | 20 |
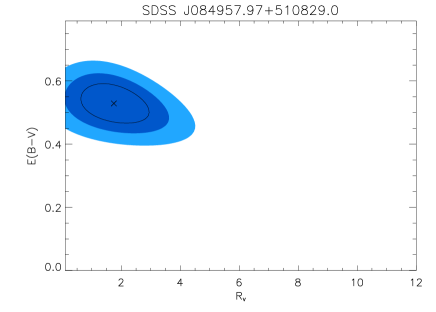
The best fit values of are listed both for the parametrisation by Fitzpatrick and the CCM parametrisation together with the error interval under the assumption that the extinction law is valid for all positive values. The is generally somewhat better for the Fitzpatrick parametrisation. In both cases the allowed values for are consistent with the Galactic average (), as shown in Fig.3 for the CCM parametrisation. The parametrisation by Fitzpatrick gives smaller contours (not shown).
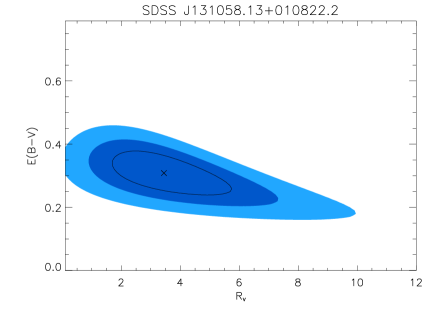
We have also modeled the quasar colours with extinction by SMC type dust but the fit is worse than for the CCM and FTZ parametrisations.
As noted in Hopkins et al. (Hopkins (2004)), the reddening in the selected systems could originate in the host galaxy, but such configurations yield worse fits in both cases. Of course, the reddening could also be a combination of both foreground and host extinction.
4 Reddening in QSOs shining through galaxies
Since the New York University Value-Added Galaxy Catalog is very incomplete at , we have searched the literature for QSO-galaxy pairs with higher galaxy redshifts. Wang et al. (wang (2004)) have found by a visual inspection three QSO spectra in the Sloan Digital Sky Survey (Schneider et al. Schneider:2005 (2005)) with a 2175 Å absorption feature at a lower redshift than for the QSO. These QSOs are therefore most likely affected by dust in an intervening galaxy. The redshift of the intervening system was determined using multiple narrow absorption lines. In addition, Pindor et al. (pindor (2003)) and Johnston et al. (johnston (2003)) have found doubly imaged QSOs where the redshift of the lensing galaxy has been determined from absorption features.
To explore the possibility of dust absorption in these individual QSO images, the observed QSO colours were compared with the simulated colours for different values of and , in the same way as described in Sec. 3. Note that we have not used the differential method that is traditionally used for determining dust extinction using multiply images mentioned in Sec. 1. The best fit values for allowing only positive are given in Table 2 for the two different parametrisations. The two last entries in the table correspond to fits using two different images of the same QSO. In the following, we will use the mean of these two values of . None of the pairs in the table would have survived the cuts in Sec. 3. It is intriguing that the best-fit values of appear to be significantly lower than for Galactic dust.
| Object Designation | Source | ||||||
|---|---|---|---|---|---|---|---|
| J144612.98+035154.4 | 1.945 | 1.512 | Wang et al. (wang (2004)) | ||||
| J145907.19+002401.2 | 3.011 | 1.395 | Wang et al. (wang (2004)) | ||||
| J012147.73+002718.7 | 2.225 | 1.388 | Wang et al. (wang (2004)) | ||||
| J090335.15+502820.2 | 3.584 | 0.388 | Johnston et al. (johnston (2003)) | ||||
| J115517.34+634622.0 | 2.888 | 0.176 | Pindor et al. (pindor (2003)) | ||||
| J115517.08+634621.5 | 2.888 | 0.176 | Pindor et al. (pindor (2003)) |
5 Discussion
Our QSO colour analysis makes only use of the SDSS QSO photometry. However, a visual comparison was also made between the candidate spectra and the redshifted template spectrum with and without reddening following the best fit values of and . We find that the two candidate spectra are consistent with the fit based on the photometric data. These comparisons are shown in Fig. 4. However, the spectroscopic comparison could not rule out host extinction as opposed to extinction in a foreground galaxy.


We have also looked for narrow absorption lines in the QSO spectra. The redshift of the line would tell whether the absorption occurs in the host galaxy or in an intervening galaxy. Munari and Zwitter (Munari (1997)) have found a relation between the equivalent width of Na I (5890.0 Å) and K I (7699.0 Å) and . This could provide a second test for if the lines are detected. Unfortunately, the signal-to-noise of the SDSS spectra is not good enough to put limits on , as shown in Fig. 5. Thus, this is not testable with the public SDSS spectroscopic data, but would require follow-up observations with higher spectral resolution and better S/N-ratio.

The detection of such absorption lines in QSO-galaxy pairs would provide evidence for the existence of dust outside the optical disc of spiral galaxies, indicative of strong expulsion from dust producing regions (Ferrara et al. Ferrara1990 (1990); Aguirre Aguirre1999 (1999)). Without such confirmation, the fact that we only have two candidates for foreground galaxy extinction that both correspond to positions at large optical radii implies that we need to be careful when interpreting the data. Since the galaxy catalogue is not as deep as the QSO catalogue (see Fig. 6), we expect to suffer from both incompleteness in our sample of QSO-galaxy pairs and contamination in our reference sample.

With a deeper galaxy survey more QSO-galaxy pairs would be found, also with smaller impact parameters. Also, a deeper survey would reduce the uncertainty in the calculation of the covariance matrix due unresolved foreground objects in the reference QSO sample. Forthcoming wide field surveys, e.g. the Large Synoptic Survey Telescope (LSST)111http://www.lsst.org, could potentially provide over a thousand QSO-galaxy pairs where the dust properties in the foreground galaxy could be successfully measured as described in Sec. 4.
Systems consisting of a high redshift QSO with a foreground galaxy close to the line-of-sight are not only interesting from a dust absorption point of view; it is also a classical set up for a gravitational lens system. The light from the background QSO will become deflected when passing through the gravitational field of the foreground galaxy causing images to be magnified, distorted and - in rare cases - multiply imaged. In order to constrain the magnitude of the lensing effect, we model the mass distribution of the foreground galaxies as singular isothermal spheres (SIS) with density profiles
| (4) |
The model is characterised by the line-of-sight velocity dispersion , which can be estimated from the galaxy luminosity via the Faber–Jackson relation (elliptical and lenticular galaxies) or the Tully–Fisher relation (spiral galaxies), see e.g. Gunnarsson et al. (gunnar05 (2005)) and references therein.
For each foreground galaxy, the absolute B-band magnitude, , is estimated using the publicly available code kcorrect v3_2 (Blanton et al. Blanton:2003 (2003)). The galaxy type is determined from the observed galaxy colours and spectra in combination with visual inspections of the morphologies.
For the sample of 164 QSO-galaxy pairs with impact parameter less than 30 kpc at the galaxy redshift, magnifications are generally small (). The only case where our calculations gives a magnification larger than 1.1 is the pair shown in Fig. 1 which has one of the smallest impact parameter of our pairs. Provided the lensing galaxy is an elliptical, the magnification factor for this QSO is . The system has an unusual morphology and we cannot exclude the possibility that a more careful lensing analysis might give more interesting results. However, such detailed investigations are outside the scope of this paper.
6 Summary and conclusions
We have investigated the possibility to detect the reddening of QSOs by foreground galaxies and to measure the dust extinction properties. Cross-correlating coordinates of the SDSS quasar catalogue with the New York University Value-Added Galaxy Catalog we find 164 QSO-galaxy pairs with impact parameters within 30 kpc at the redshift of the foreground galaxy. With additional colour cuts we identified two low- systems () involving spiral galaxies where the QSO colours are particularly indicative of reddening in the intervening galaxy. Both QSOs have very large impact parameters in terms of the the optical radii of the foreground galaxies and are thus indicative of large dust column densities outside the optical disc of spiral galaxies. With this assumption, and using redshifted reddened QSO templates we fit for and using the measured colours and redshifts of the quasar and galaxy and find that Galactic type dust provides a good fit to the data. Such an interpretation needs to be confirmed by e.g. spectroscopic means. We emphasize that we cannot rule out other explanations for the red colour of these two quasars, e.g. intrinsic redder colour, extinction in the host galaxy or in an unresolved foreground galaxy.
We also explored the extinction properties in five QSOs in the literature, where the foreground galaxies have redshifts in the range . A wide range of preferred values of was found. This is an indication that the dust properties in other galaxies may be different from the Milky Way.
We note with interest that the dust in galaxies with high redshifts in our study were better fitted by lower values of than the average Milky Way value (See Fig. 7).

If this effect is confirmed with a larger sample, and selection effects can be ruled out, it would be indicative of an evolution of the dust properties with redshift, which would have an impact on e.g. the use of extinction corrected supernovae as distance indicators. It would not be too surprising if such an evolution in the reddening law exists since e.g. metallicity and elemental abundance ratios are known to change with redshift and these are expected to affect the dust properties. However, it is possible that the differences between our two sets are mainly due to selection effects since the few systems studied have been chosen with different methods: at high- through detection of absorption features and at low- by selecting reddened QSOs at small impact parameters with respect to resolved foreground galaxies.
Acknowledgements.
The authors would like to thank Vallery Stanishev and the anonymous referee for many useful comments. We would also like to thank the Göran Gustafsson Foundation for financial support. EM would like to thank the Royal Swedish Academy of Sciences for financial support. AG is a Royal Swedish Academy Research Fellow supported by grants from the Swedish Research Council, the Knut and Alice Wallenberg Foundation. Funding for the Sloan Digital Sky Survey (SDSS) has been provided by the Alfred P. Sloan Foundation, the Participating Institutions, the National Aeronautics and Space Administration, the National Science Foundation, the U.S. Department of Energy, the Japanese Monbukagakusho, and the Max Planck Society. The SDSS Web site is http://www.sdss.org/. The SDSS is managed by the Astrophysical Research Consortium (ARC) for the Participating Institutions. The Participating Institutions are The University of Chicago, Fermilab, the Institute for Advanced Study, the Japan Participation Group, The Johns Hopkins University, Los Alamos National Laboratory, the Max-Planck-Institute for Astronomy (MPIA), the Max-Planck-Institute for Astrophysics (MPA), New Mexico State University, University of Pittsburgh, Princeton University, the United States Naval Observatory, and the University of Washington.References
- (1) Abazajian, K., Adelman-McCarthy, J. K., Agüeros, M. A., et al. 2004, AJ, 128, 502
- (2) Aguirre, A. N. 1999, ApJ, 512, L19
- (3) Blanton, M. R., Brinkmann, J., Csabai, I., et al. 2003, AJ, 125, 2348
- (4) Blanton, M. R., Eisenstein, D., Hogg, D. W., Schlegel, D. J., & Brinkmann, J. 2005, ApJ, 629, 143
- (5) Branch, D., & Tammann, G.A. 1992, ARA&A, 30, 359
- (6) Cardelli, J. A., Clayton, G. C., & Mathis, J. S. 1989, ApJ, 345, 245-256
- (7) Draine, B. T. 2003, ARA&A, 41, 241
- (8) Falco, E. E., Impey, C. D., Kochanek, C. S., et al. 1999, ApJ, 523, 617
- (9) Ferrara, A., Aiello, S., Ferrini, F., & Barsella, B. 1990, A&A, 240, 259
- (10) Fitzpatrick, E. L. 1999, PASP, 111, 63-75
- (11) Gunnarsson, C., Dahlén, T., Goobar, A., Jönsson, J., & Mörtsell, E. 2005, ApJ in press, astro-ph/0506764
- (12) Guy, J., Astier, P., Nobili, S., Regnault, N., & Pain, R. 2005, A&A, 443, 781
- (13) Hopkins, P. F., Strauss, M. A.,Hall, P. B., et al. 2004, AJ, 128, 1112
- (14) Johnston, D. E., Richards, G. T., Frieman, J. A., et al. 2003, AJ, 126, 2281
- (15) Jöeveer, M. 1983, Afz, 18, 328
- (16) Keel, W. C., & White, R. E. III 2001, AJ, 122, 1396
- (17) McGough, C., Clayton, G. C., Gordon, K. D., & Wolff, M. J. 2005, ApJ, 624, 118-123
- (18) Munari, U., & Zwitter, T. 1997, A&A, 318, 269-274
- (19) Nadeau, D., Yee, H. K. C., Forrest, W. J., et al. 1991, ApJ, 376, 430
- (20) Pei, Y. C., Fall, S. M., & Hauser, M. G. 1999, ApJ, 522, 604
- (21) Pindor, B., Eisenstein, D. J., Inada, N., et al. 2004, AJ, 127, 1318
- (22) Reindl, B., Tammann, G. A., Sandage, A., & Saha, A. 2005, ApJ, 624, 532
- (23) Richards, G. T., Fan, X., Schneider, D. P., et al. 2001, AJ, 121, 2308
- (24) Riess, A. G., Press, W., & Kirshner, R. P. 1996, ApJ, 473,588
- (25) Schlegel, D. J., Finkbeiner, D. P., & Davis, M. 1998, ApJ, 500, 525
- (26) Schneider, D. P., Hall, P. B., Richards, G. T., et al. 2005, AJ, 130, 367
- (27) Telfer, R. C., Zheng, W., Kriss, G. A., & Davidsen, A. F. 2002, ApJ, 565, 773
- (28) Vanden Berk, D. E., Richards, G. T., Bauer, A., et al. 2001, AJ, 122, 549-564
- (29) Wang, J., Hall, P. B., Ge, J., Li, A., & Schneider, D. P. 2004, ApJ, 609, 589