A robust sample of submillimetre galaxies: constraints on the prevalence of dusty, high-redshift starbursts
Abstract
The modest significance of most sources detected in current (sub)millimetre surveys can potentially compromise some analyses due to the inclusion of spurious sources in catalogues typically selected at 3.0–3.5. Here, we develop and apply a dual-survey extraction technique to SCUBA and MAMBO images of the Lockman Hole. Cut above 5, our catalogue of submillimetre galaxies (SMGs) is more robust than previous samples, with a reduced likelihood of real, but faint SMGs (beneath and around the confusion limit) entering via superposition with noise. Our selection technique yields 19 SMGs in an effective area of 165 arcmin2, of which we expect at most two to be due to chance superposition of SCUBA and MAMBO noise peaks. The effective flux limit of the survey (4 mJy at 1 mm) is well matched to our deep 1.4-GHz image (Jy beam-1). The former is sensitive to luminous, dusty galaxies at extreme redshifts whilst the latter probes the regime. A high fraction of our robust SMGs (80 per cent) have radio counterparts which, given the 10-per-cent contamination by spurious sources, suggests that very distant SMGs () are unlikely to make up more than 10 per cent of the bright SMG population. This implies that almost all of the mJy SMG population is amenable to study via the deepest current radio imaging. We use these radio counterparts to provide an empirical calibration of the positional uncertainty in SMG catalogues. We then go on to outline the acquisition of redshifts for radio-identified SMGs, from sample selection in the submillimetre, to counterpart selection in the radio and optical/infrared, to slit placement on spectrograph masks. We determine a median of from a sample of six secure redshifts for unambigious radio-identified submillimetre sources and when we include submillimetre sources with multiple radio counterparts and/or less reliable redshifts. These figures are consistent with previous estimates, suggesting that our knowledge of the median redshift of bright SMGs population has not been biased by the low significance of the source catalogues employed.
keywords:
galaxies: starburst – galaxies: formation – cosmology: observations – cosmology: early Universe1 Introduction


Surveys with bolometer arrays at millimetre (mm) and submillimetre (submm) wavelengths are potentially sensitive to dusty objects at extreme redshifts, galaxies that drop out of surveys at shorter and longer wavelengths due to obscuration and unfavourable corrections. The first cosmological surveys using SCUBA (Holland et al. 1999) and MAMBO (Kreysa et al. 1998) quickly and radically changed the accepted picture of galaxy formation and evolution, moving away from the optocentric view of the last century. The discovery of so-called ‘SCUBA galaxies’ (Smail, Ivison & Blain 1997) was greeted with surprise due to the remarkable evolution in the dusty, starburst galaxy population implied by such a large source density at the flux levels accessible to the first generation of bolometer arrays (Blain et al. 1999). Excitement was replaced by pessimism with the first efforts to study SMGs at optical and infrared (IR) wavelengths: early reports, backed up with a study in the Hubble Deep Field North by Hughes et al. (1998), suggested that the majority of the submm population had no plausible optical counterparts. Attention was diverted to various redshift engines and broadband photometric techniques (e.g. Townsend et al. 2001; Aretxaga et al. 2003; Wiklind 2003). As a result, only a handful of detailed studies were attempted, often for extreme and possibly unrepresentative galaxies (e.g. Knudsen et al. 2004).
Recent progress has largely been the result of radio imaging of submm survey fields. Early radio follow-up detected roughly half of the submm sources observed (Smail et al. 2000; Ivison et al. 2002 — hereafter I02), with an astrometric precision of 0.3′′ and, combined with the submm flux density, provide a rough estimate of redshift (Carilli & Yun 1999). Radio data also enabled some refinement of submm samples (I02), increasing the detection fraction to two thirds of SMGs at 0.85-mm flux density levels in excess of 5 mJy. With positions in hand, these bright SMGs were found to be a diverse population — some quasar-like, with broad lines and X-ray detections (e.g. Ivison et al. 1998), some morphologically complex (e.g. Ivison et al. 2000; cf. Downes & Solomon 2003; Smail, Smith & Ivison 2005), some extremely red (e.g. Smail et al. 1999; Gear et al. 2000; I02; Webb et al. 2003b; Dunlop et al. 2004), some with the unmistakable signatures of obscured active nuclei and/or superwinds (e.g. Smail et al. 2003).
Spectroscopic redshifts have been difficult to determine. The first survey based on a submm/radio sample was undertaken by Chapman et al. (2003, 2005 — hereafter C03, C05): the median redshift was found to be 2.2 for -mJy galaxies selected using SCUBA and pinpointed at 1.4 GHz. The accurate redshifts reported by C03 and C05 facilitated the first systematic measurements of molecular gas mass for SMGs (1011 M⊙) via observations of CO (Neri et al. 2003; Greve et al. 2005), as well as constraints on gas reservoir size and dynamical mass (Tacconi et al. 2005). The data suggest SMGs are massive systems and provide some of the strongest tests of galaxy-formation models to date (Greve et al. 2005).
In spite of this progress, a detailed understanding of SMGs remains a distant goal. Confusion currently limits our investigations to the brightest SMGs (although surveys through lensing clusters have provided a handful of sources more typical of the faint population that dominates the cosmic background — Smail et al. 2002; Kneib et al. 2004; Borys et al. 2004). We must also recall that selection biases have potentially skewed our understanding: around half of all known SMGs remain undetected in the radio (due simply to the lack of sufficiently deep radio data, which do not benefit from the same correction as submm data) and the radio-undetected fraction remains largely untargeted by existing spectroscopic campaigns. These is also only limited coverage of red and IR wavelengths in spectroscopic surveys.
Here, we present a robust sample of bright SMGs selected using SCUBA and MAMBO in one of the ‘8-mJy Survey’ regions: the Lockman Hole (see Scott et al. 2002; Fox et al. 2002; I02; Greve et al. 2004; Mortier et al. 2005). Our goal is to provide a bright sample which we would expect to detect in well-matched radio imaging () whilst minimising, so far as is practicable, the possibility that sources are spurious or anamalously bright. We may thus determine the true fraction of radio drop-outs amongst SMGs (potentially lying at very high redshift, ), as well as practical information such as the intrinsic positional uncertainty for SMGs in the absence of radio/IR counterparts.
Throughout we adopt a cosmology, with , and km Mpc-1.
2 Sample selection
2.1 Strategy
Existing surveys have typically employed a SNR threshold of 3.0–3.5. At these SNRs, false detections are dominated by ‘flux boosting’ (§2.2), possibly at the 10–40 per cent level (Scott et al. 2002; Laurent et al. 2005). Our goal is to provide a highly reliable submm source catalogue, free from concerns about contamination by spurious or artificially bright sources. This issue has limited our ability to address the true recovery fraction in the radio, and hence the corrections that must be made to the redshift distributions that are used to determine star-formation histories and galaxy-formation models.

To achieve this we have combined independent submm and mm maps of the Lockman Hole, constructing a single, reliable catalogue that is several times larger than would have been realised by simply adopting a high SNR threshold in the individual submm and mm maps. Greve et al. (2004) argued that several maps with low signal-to-noise ratio (SNR) of the same region, with only marginal differences in frequency, produce several visualisations of essentially the same sky, tracing the same population of luminous, dust-enshrouded galaxies and we have adopted the same philosophy in the present work.
2.2 Practicalities
Our maps came from the survey of Greve et al. (2004) who presented a 1.2-mm map of the Lockman Hole region (as well as data on the ELAIS N2 region), centred on the coordinates mapped at 0.85 mm by SCUBA in the ‘8-mJy Survey’ (Scott et al. 2002, 2004). Mortier et al. (2005) have recently present a refined analysis of SCUBA data which lies within the Lockman Hole MAMBO map; we began with a 2- MAMBO catalogue, extracted as described by Greve et al. (2004), and looked for 0.85-mm sources within 14 arcsec (roughly the area of five beams) in the Mortier et al. (2005) sample, applying a correction for separation and checking for a combined significance above our initial threshold, 4.5. We included sources that exceed 4.5 in either dataset, as long as there is a valid reason why the source is not seen in the other image. SMGs from Scott et al. (2002) were substituted where blends were evident in the Mortier et al. catalogue.
| Namea | Position at 1.2mm | S/N | Position at 0.85mm | S/N | Sep | Final | ||||
|---|---|---|---|---|---|---|---|---|---|---|
| /mJy | /mJy | S/N | ||||||||
| h m s | h m s | ′′ | ||||||||
| LH 1200.001 = LE850.02 = Lock850.03 | 10:52:38.3 | +57:24:37 | 4.8 0.6 | 8.0 | 10:52:38.6 | +57:24:38 | 10.9 2.1 | 5.1 | 2.1 | 8 |
| LH 1200.002 = Lock850.32b | 10:52:38.8 | +57:23:21 | 4.1 0.6 | 6.8 | 10:52:38.6 | +57:23:19 | 5.2 2.0 | 2.6 | 3.6 | 7.6 |
| LH 1200.003 = LE850.14 = Lock850.04c | 10:52:04.1 | +57:26:57 | 3.6 0.6 | 6.0 | 10:52:04.2 | +57:27:01 | 10.5 2.0 | 5.2 | 3.4 | 8 |
| 10:52:03.9 | +57:27:10 | 1.3 0.6 | 2.2 | |||||||
| LH 1200.004 = Lock850.02d | 10:52:57.0 | +57:21:07 | 5.7 1.0 | 5.7 | 5.7 | |||||
| LH 1200.005 = LE850.01 = Lock850.01 | 10:52:01.3 | +57:24:48 | 3.4 0.6 | 5.7 | 10:52:01.5 | +57:24:43 | 8.6 1.1 | 8.0 | 5.1 | 8 |
| LH 1200.006 = LE850.16 = Lock850.12 | 10:52:27.4 | +57:25:15 | 2.8 0.5 | 5.6 | 10:52:27.6 | +57:25:17 | 7.0 1.6 | 4.3 | 2.6 | 7.4 |
| LH 1200.007 = Lock850.27 | 10:52:04.7 | +57:18:12 | 3.2 0.7 | 4.6 | 10:52:03.4 | +57:18:12 | 5.8 1.3 | 4.3 | 10.4 | 6.4 |
| LH 1200.008 | 10:51:41.9 | +57:19:51 | 4.1 0.9 | 4.6 | 10:51:40.7 | +57:19:53 | 4.6 1.6 | 2.8 | 9.8 | 5.5 |
| LH 1200.009 = Lock850.18 | 10:52:27.5 | +57:22:20 | 3.1 0.7 | 4.4 | 10:52:28.2 | +57:22:17 | 6.3 1.8 | 3.5 | 6.3 | 6.0 |
| LH 1200.010 = LE850.06 = Lock850.14 | 10:52:29.9 | +57:22:05 | 2.9 0.7 | 4.1 | 10:52:30.4 | +57:22:13 | 10.8 2.4 | 4.6 | 9.5 | 6.4 |
| LH 1200.011 = LE850.03 = Lock850.17e | 10:51:58.2 | +57:17:53 | 2.9 0.7 | 4.1 | 10:51:58.3 | +57:18:00 | 5.0 1.3 | 3.9 | 7.6 | 6.0 |
| 10:51:57.6 | +57:18:05 | 1.6 0.7 | 2.3 | |||||||
| LH 1200.012 = LE850.18 = Lock850.33 | 10:51:55.4 | +57:23:10 | 3.3 0.8 | 4.1 | 10:51:55.9 | +57:23:13 | 4.3 1.0 | 4.2 | 5.2 | 6.2 |
| LH 1200.014 = LE850.08 = Lock850.41 | 10:52:00.0 | +57:24:24 | 2.4 0.6 | 4.0 | 10:51:59.6 | +57:24:21 | 4.8 1.1 | 4.3 | 4.9 | 6.2 |
| LH 1200.017 = Lock850.61 | 10:51:21.4 | +57:18:40 | 4.8 1.3 | 3.7 | 10:51:22.5 | +57:18:42 | 14.6 4.1 | 3.5 | 8.8 | 5.3 |
| LH 1200.019 | 10:51:28.3 | +57:19:46 | 4.0 1.1 | 3.6 | 10:51:27.8 | +57:19:47 | 6.7 2.3 | 2.9 | 4.5 | 5.0 |
| LH 1200.022 | 10:52:03.0 | +57:15:46 | 2.8 0.8 | 3.5 | 10:52:03.3 | +57:15:37 | 7.3 2.2 | 3.3 | 9.1 | 5.0 |
| LH 1200.042 = LE850.29 = Lock850.09 | 10:52:16.0 | +57:25:06 | 1.6 0.5 | 3.2 | 10:52:16.2 | +57:25:05 | 7.2 1.5 | 4.7 | 1.9 | 6.0 |
| LH 1200.096 = LE850.07 = Lock850.16 | 10:51:51.4 | +57:26:40 | 1.6 0.6 | 2.7 | 10:51:51.4 | +57:26:38 | 6.7 1.7 | 4.0 | 4.8 | 5.1 |
| LH 1200.104 = LE850.27 = Lock850.08 | 10:51:53.7 | +57:18:39 | 2.1 0.8 | 2.6 | 10:51:53.9 | +57:18:38 | 6.3 1.2 | 5.2 | 2.1 | 6.2 |
Notes: Sources names: LH 1200. from Greve et al. (2004), LE850. from Scott et al. (2002) and Lock850. from Coppin et al. (in preparation); Noisy region of 0.85-mm 8-mJy Survey map; LH 1200.213 lies nearby, with coordinates and flux density as shown; 1.2-mm source lies off the 0.85-mm map; LH 1200.182 lies nearby, with coordinates and flux density as shown; also a possible blend at 0.85 mm.
The noise properties of submm images are not Gaussian due to the miriad of real, faint sources near the confusion limit. The most important effect of increasing the SNR threshold should be to drastically reduce the false detections due to faint SMGs that have been boosted above the detection threshold by noise — flux boosting, see Scott et al. (2002) and Greve et al. (2004). However, with so many 2- sources in our catalogues, it was important to investigate how many SMGs may have contaminated our combined sample due to random coincidence of faint MAMBO and SCUBA peaks. To this end, we performed simulations, offsetting the MAMBO sample by 30 and 45 arcsec (in R.A. and Dec.). Each simulation typically yielded ten SMGs — far too many to hope that a statistically robust catalogue would emerge from the process. The results of these simulations are illustrated in Fig. 1. The simulated catalogues clearly yield a very different distribution of offsets from the position-matched data, closer to the form expected for randomly scattered peaks (), and without the expected concentration of high-SNR pairs at low .
Using the information in these plots we took a number of approaches to minimise the number of spurious SMGs in our sample. We found that raising the minimum catalogue threshold to 2.5 reduced the number of false detections whilst having no effect on the real catalogue. Lowering the search radius to 11 arcsec reduced the number of false positives in line with the ratio of the respective search areas, removing only one source from the real catalogue. Insisting that the higher of the two peaks was 3.5 removed a further quarter of the simulated SMGs, whilst reducing the real catalogue by half that amount. Finally, we increased the combined theshold to 5. The effects of this approach on the SCUBA–MAMBO positional offsets are shown in the right-hand set of panels of Fig. 1. We were left with a catalogue of 19 SMGs, of which we expect at most two to be the result of chance superposition of SCUBA and MAMBO noise peaks. This compares well with the sample of seven that would have resulted from adopting a 5 threshold in any one image. We list the resulting 19 sources in Table 1.
We note that all four of the SCUBA sources detected individually above 5 are also found in the MAMBO image with a SNR of at least 2.0, although one is below 2.5 and has thus been excised from our final sample. Of the six 5- MAMBO sources, all those that fall within the original 8-mJy Survey region were detected by SCUBA at 2.5. LH 1200.004, which lies off the 8-mJy Survey SCUBA map, to the East, was subsequently detected by the SHADES survey (Dunlop 2005; http://www.roe.ac.uk/ifa/shades).
| Name | Average (sub)mm position | Radio position | Radio- | Notes | ||||
|---|---|---|---|---|---|---|---|---|
| submm | ||||||||
| h m s | h m s | /Jy | offset ′′ | |||||
| LH 1200.001 | 10:52:38.46 | +57:24:37.4 | 10:52:38.30 | +57:24:35.8 | 29 11 | 2.1 | 0.0237 | to SSW |
| 10:52:38.39 | +57:24:39.5 | 24 9 | 2.2 | 0.0309 | to NNW | |||
| LH 1200.002 | 10:52:38.69 | +57:23:19.9 | 10:52:38.46 | +57:23:19.6 | 45 20 | 1.9 | 0.0126 | central |
| LH 1200.003 | 10:52:04.15 | +57:26:59.1 | 10:52:04.22 | +57:26:55.4 | 72 12 | 3.7 | 0.0213 | to S |
| 10:52:04.06 | +57:26:58.5 | 36 12 | 1.9 | 0.0161 | central | |||
| LH 1200.004 | 10:52:57.00 | +57:21:07.0 | 10:52:57.09 | +57:21:02.8 | 44 11 | 4.3 | 0.0437 | to S |
| 10:52:57.01 | +57:21:08.3 | 48 12 | 3.7 | 0.0325 | central; extended PA 104∘ | |||
| LH 1200.005 | 10:52:01.37 | +57:24:45.6 | 10:52:01.25 | +57:24:45.7 | 73 10 | 1.0 | 0.0025 | central |
| LH 1200.006 | 10:52:27.50 | +57:25:16.0 | 10:52:27.58 | +57:25:12.4 | 47 10 | 3.7 | 0.0332 | to SSE |
| LH 1200.007 | 10:52:04.08 | +57:18:12.1 | 10:52:04.58 | +57:18:05.9 | 18 8 | 7.4 | 0.1303 | to SE |
| LH 1200.008 | 10:51:41.31 | +57:19:52.0 | 10:51:41.43 | +57:19:51.9 | 315 12 | 1.0 | 0.0004 | central; just resolved |
| LH 1200.009 | 10:52:27.84 | +57:22:18.5 | 10:52:27.77 | +57:22:18.2 | 29 9 | 0.6 | 0.0031 | central |
| LH 1200.010 | 10:52:30.15 | +57:22:09.1 | 10:52:30.73 | +57:22:09.5 | 54 14 | 4.7 | 0.0406 | to E, resolved |
| LH 1200.011 | 10:51:58.23 | +57:17:56.6 | 10:51:58.02 | +57:18:00.2 | 98 12 | 4.0 | 0.0172 | to NNW |
| LH 1200.012 | 10:51:55.66 | +57:23:11.6 | 10:51:55.47 | +57:23:12.7 | 47 10 | 1.9 | 0.0120 | 38 19Jy at 4.9 GHz |
| LH 1200.014 | 10:51:59.80 | +57:24:23.1 | 10:52:00.26 | +57:24:21.7 | 58 12 | 4.0 | 0.0300 | to ESE |
| 10:51:59.76 | +57:24:24.8 | 23 10 | 1.7 | 0.0220 | to N | |||
| LH 1200.017 | 10:51:21.93 | +57:18:41.0 | 10:51:22.20 | +57:18:39.9 | 92 12 | 2.4 | 0.0082 | to ESE |
| LH 1200.019 | 10:51:28.03 | +57:19:47.0 | 10:51:28.03 | +57:19:57.7 | 58 12 | 10.7 | 0.1020 | to N, outside search area |
| LH 1200.022 | 10:52:03.15 | +57:15:41.6 | 5 25 | N/A | ||||
| LH 1200.042 | 10:52:16.11 | +57:25:05.6 | 10:52:15.63 | +57:25:04.2 | 53 12 | 4.1 | 0.0341 | to WSW |
| LH 1200.096 | 10:51:51.42 | +57:26:39.1 | 10:51:51.69 | +57:26:36.0 | 135 13 | 3.8 | 0.0112 | to SE, just resolved |
| LH 1200.104 | 10:51:53.82 | +57:18:38.6 | 5 25 | N/A | ||||
Notes: The noise level is around 4.6 Jy beam-1; however, flux density uncertainties are larger unless one assumes the source to be unresolved.
3 Identification of the SMGs in the radio
The process of identifying counterparts to SMGs has been refined in a series of studies (Ivison et al. 1998, 2000, 2002, 2004; Smail et al. 1999, 2000; Webb et al. 2003a, 2003b; Clements et al. 2004; Borys et al. 2004; Pope et al. 2005). The most effective methods employ radio, optical, near-IR and mid-IR imaging, either individually or in combination. These techniques rely upon identifying the red rest-frame optical light expected of a dust-enshrouded galaxy and the synchrotron emission expected of a starburst or radio-loud active galaxy. Radio sources, EROs and 24-m sources are sufficiently rare that finding either within an SMG error circle can be viewed as a robust identification in most cases. However, finding an ERO or mid-IR counterpart does not imply that it is responsible for the submm emission, merely that it is likely to be associated with the SMG in some way; for radio counterparts, a more physical link between the radio and submm emission exists.
Fig. 2 shows how the flux density of a luminous, dusty starburst varies with redshift at both 1 mm and 1.4 GHz, adopting the starburst spectral energy distribution of Carilli & Yun (1999). To identify a 5-mJy SMG (the average of the 0.85- and 1.2-mm flux densities) in a 1.4-GHz image, it is clear that the radio data must achieve a sensitivity of at least 5 Jy beam-1.
Even at this radio sensitivity, the lack of a robust radio identification could have at least five origins:
-
1.
the SMG could be entirely spurious;
-
2.
the SMG could be real, but flux boosted significantly;
-
3.
the radio/far-IR emission could be significantly larger than the 1.4-GHz synthesised beam (I02; Chapman et al. 2004a);
-
4.
the characteristic dust temperature could be low (Chapman et al. 2004b); or
-
5.
the SMG could lie at (Eales et al. 2003).
It is difficult, given the quality of existing samples, and the mis-matched radio/submm datasets, to determine which of these are important, although I02 showed that (i) probably affects at least 15 per cent of a sample selected above 3.5 (cf. Pope et al. 2005).
3.1 Radio data
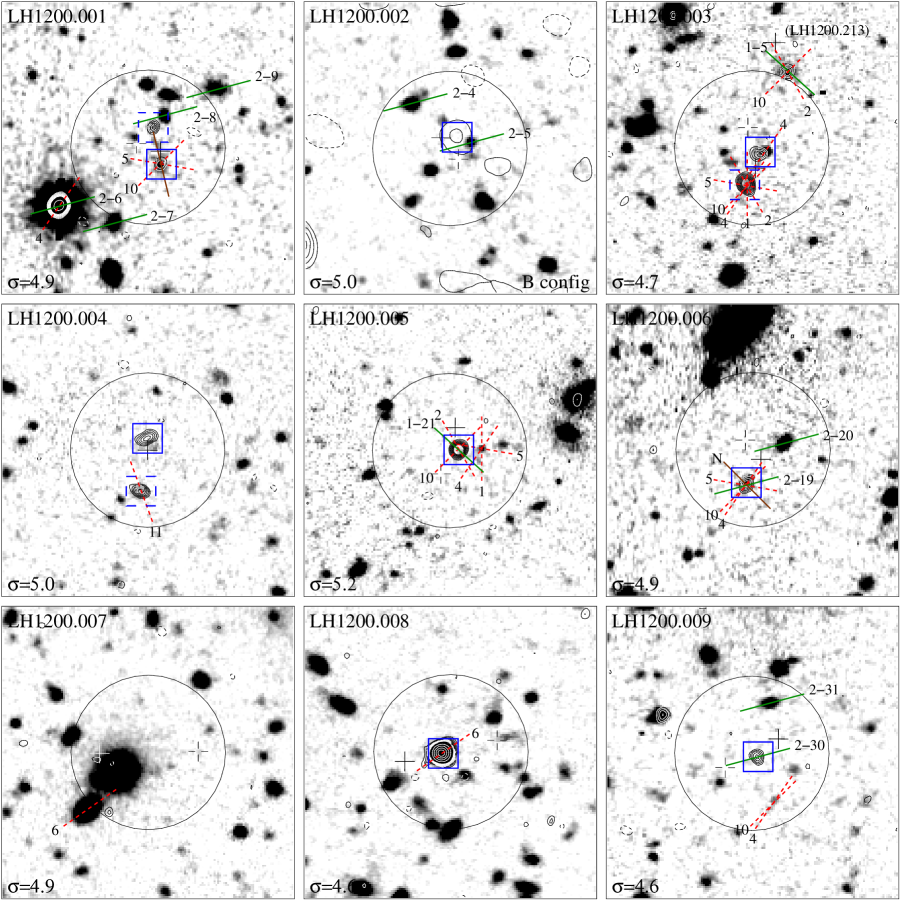
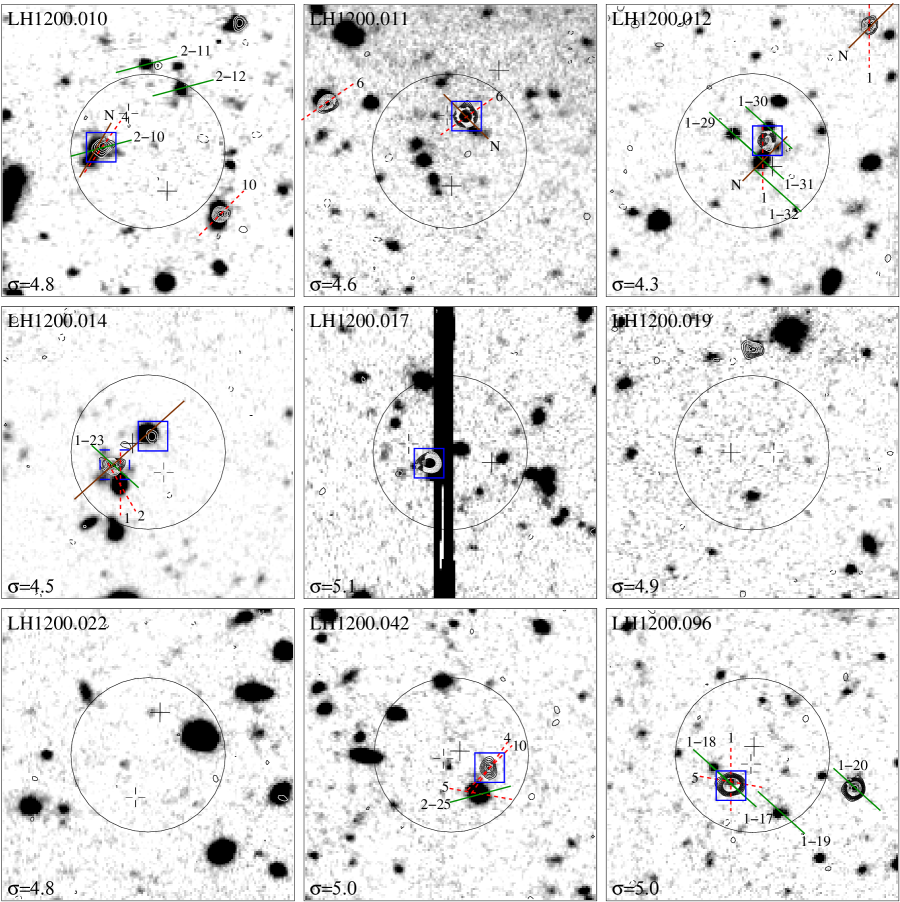
Deep, high-resolution, wide-field radio images were obtained at the National Radio Astronomy Observatory’s111NRAO is operated by Associated Universities Inc., under a cooperative agreement with the National Science Foundation. (NRAO) VLA and employed to pinpoint the SMGs. The data used here are described in detail by I02. Briefly, the 1.4-GHz image of the Lockman Hole comprises 75 hr of integration and reaches a noise level of 4.6 Jy beam-1, with a near-circular 1.4-arcsec beam (fwhm). We also use an image with a 4.5-arcsec beam, which incorporates a further 24-hr of B-configuration data taken for a field 10′ to the NE. Figs 3 and 4 show postage stamps around the positions given in Table 2 for the SMGs in our sample.
3.2 Mm–radio associations
A radio source peaking at 4 in the 1.4- or 4.5-arcsec images, with an integrated flux density in excess of 3 , is considered a robust detection. Fainter sources, where the definition is relaxed to only the integrated flux, were also catalogued. In the Lockman Hole, the surface density of all radio sources above this threshold is arcmin-2.
For each SMG we have searched for a potential radio (1.4-GHz) counterpart out to a radius of 8 arcsec from the mid-point of the 0.85- and 1.2-mm emission. This relatively large search area (201 arcsec2 around each source) represents a 2.6- positional confidence region (see later) and should ensure that few ( per cent) real associations are missed. As demonstrated by I02, this search radius can be tolerated without compromising the statistical significance of genuine associations. Even at the extreme depths reached by the radio imaging reported here, the cumulative surface density of radio sources yields only 0.1 source per search area.
The flux densities and positions of all candidate radio counterparts are listed in Table 2, along with the search positions. To quantify the formal significance of each of the potential (sub)mm/radio associations we have used the method of Downes et al. (1986) to correct the raw Poisson probability, , that a radio source of the observed flux density could lie at the observed distance from the SMG for the number of ways that such an apparently significant association could have been uncovered by chance.
Of the four sources which have more than one potential radio counterpart, we find that the correct identification is never statistically obvious. The formal probability of the second candidate association occurring by chance is low, . The obvious interpretations of such multiple statistical associations are either gravitational lensing (implausible in most of the cases here, unless the lenses are as obscured as the lensed galaxies) or arise from true physical associations due to clustering of star-forming objects/AGN at the source redshift (likely, and already proven in several cases — e.g. Ledlow et al. 2002). Another possibility is that sources with multiple radio counterparts are boosted into bright submm catalogues by virtue of comprising multiple, faint, physically unrelated SMGs, i.e. by confusion.
In total, this calculation has yielded statistically robust radio counterparts for 15 of the 19 SMGs. The plausibility of this figure can be checked by noting that the ratio of areas inside and outside the circles in Fig. 3 is 4.5:1. In total, ten random ‘field’ radio sources are detected robustly in the outer areas. We thus expect only a handful (at most 2–3) of the counterparts to be spurious, particularly given that Jy radio sources are expected to be over-dense around SMGs as a result of mergers and/or clustering (Blain et al. 2004).
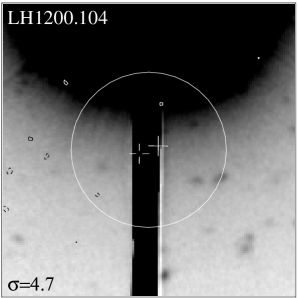
We find that two SMGs are completely blank in the radio, while a further two lack robust radio counterparts. Based on the values given in Table 2, the most likely candidates for spurious associations are LH 1200.007 and .019. LH 1200.019 and .022 also lack robust Spitzer identifications (E. Egami, private communication), although the radio source () N of LH 1200.019 is well detected at 24 m; LH 1200.007 has no clear-cut Spitzer identification, but two faint 24-m sources are detected to the NW and SE. Finally, LH 1200.104 has a clear identification in the Spitzer imaging described by Ivison et al. (in preparation). LH 1200.022 is thus the least secure SMG in the sample.
We show in Fig. 5 the distribution of flux ratios for the SMGs in our robust sample. These demonstrate a real dispersion in 0.85-/1.2-mm and 1.2-mm/1.4-GHz flux ratios, indicative of a broad underlying distribution of observed spectral energy distributions (SEDs). We can identify regions of the plot where high- and low-redshift sources would reside. However, the degeneracy between characteristic dust temperature and redshift means that variations in dust temperature within the population may mask any redshift variations. On this basis, it appears that LH 1200.042 and .096 may be either particularly hot or particularly low-redshift SMGs, while LH1200.007 has either unusually cold dust or lies at a high redshift.
The mean radio flux density observed for our sample is Jy, taking only the detections and summing flux densities for those with multiple counterparts. The trend in the most common spectral index, , determined by C05, 11.1 + 35.2, suggests that the mean redshift of our radio-detected SMG sample, with mJy, is . The high dispersion in Fig. 5 echoes the findings of C05, who saw an r.m.s. scatter in of 40 for their –4 SMG sample. In fact, the large scatter provides a plausible explanation for the handful of radio non-detections amongst our SMGs: we would expect at least 10 per cent to be scattered below the radio flux density threshold of our survey.
Is there anything which distinguishes the non-radio SMGs from the rest of the population? Three of the four were detected at in the MAMBO survey (LH 1200.019, .022 and .104). This is interesting since we would expect the 1.2-mm MAMBO data to be more sensitive than SCUBA to the most distant starbursts (Fig. 5), and hence to yield more radio non-detections — a possible hint that LH 1200.104, at least, is warm rather than cold and/or distant. Two of the radio non-detections, LH 1200.007 and .022, have the largest mm–submm separations in the sample and may thus consist of blended, faint sources.
3.3 Implications for submm positional uncertainty
Fig. 6 shows a histogram of positional offsets in R.A. and Dec. between the average of the 0.85- and 1.2-mm positions and the most likely radio counterparts. A Gaussian fit to the distribution yields a fwhm of 5.2 1.2 arcsec, which translates into a 1- separation of 2.2 arcsec between our (sub)mm and radio positions. The sample can thus be employed to re-calibrate the rule-of-thumb relationship between positional accuracy, beam size and SNR (typically, SNR 6 here). We must acknowledge a mild circularity to the logic, given that positional offsets have been used to calculate , although this may be offset by the lack of correction for radio sources in the field.
Following Ivison et al. (in preparation), the conventional positional uncertainty, , occurs where the distribution of radial offsets peaks; this is the same as the 1- separation deduced earlier. Within this radius we expect to find 39.3 per cent of the population, with 86.5 and 98.9 per cent within 2 and 3 (from 1 – ). In the absence of radio counterparts, it would seem from our analysis that around 39 per cent of SMGs can be located within a radial distance of , where is the fwhm beam size, in arcsec). Thus the positional uncertainty () for 3–3.5 SCUBA-selected SMGs is 4–5 arcsec, cf. the rule of thumb quoted by Hughes et al. (1998).
4 Optical/infrared observations
Divining robust counterparts and redshifts for SMGs is a challenging process, with fewer than ten published redshifts prior to 2002. Ideally, the process follows the pattern outlined below:
-
1.
definition of submm sample (e.g. Scott et al. 2002; Greve et al. 2004);
-
2.
determination of robust counterparts, using sensible priors and data of sufficient quality in the radio and optical/IR (e.g. I02; Borys et al. 2004);
-
3.
spectroscopy, preferably with an instrument sensitive from the blue atmospheric cut-off (310 nm) to 1 m.
For the particularly retentive, when the spectroscopic identification is not for a radio-identified galaxy these should be augmented with:
-
4.
confirmation of redshift in IR via H or another nebular line (Ivison et al. 2000; Simpson et al. 2004; Swinbank et al. 2004);
-
5.
detection of molecular gas at that redshift via CO (e.g. Neri et al. 2003; Greve et al. 2005).
We have endevoured to follow this process, although only the last two of the seven Keck runs described by C05 preceded the arrival of the MAMBO catalogue, so steps (iii) and (iv) have largely preceeded (i) and (ii). This should not have introduced any strong bias but it has inevitably reduced the number of robust identifications with successful redshift determinations.
4.1 Imaging with Subaru and Gemini
To illustrate the precise coverage of our spectroscopic observations, we exploit -band archival imaging taken with the 8-m Subaru Telescope using SuprimeCam (3 limit 27.4, 1.5-arcsec-radius aperture). Postage stamps of these data are shown in Fig. 3, with the radio counterparts highlighted — those with from §3.2. For the purposes of cross-identification of radio/optical counterparts — i.e. to match the radio astrometry — the optical image required a shift of 0.5 arcsec and 0.4 arcsec. We report the -band photometry of potential counterparts in Table 3.
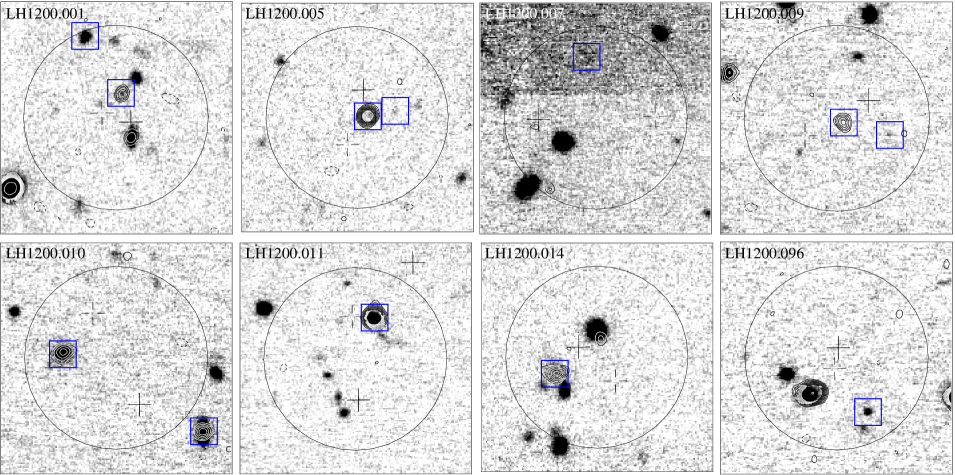
New near-infrared () imaging (Fig. 4) of eight of the SMGs is also exploited here, obtained in photometric conditions with seeing 0.6 arcsec at the 8-m Gemini Observatory, Mauna Kea, using NIRI (GN/01A/11) with a total integration time of 5.4 ks per source. The resulting 3 limit in is 20.9 for a 1.5-arcsec-radius aperture. As we have only partial coverage of our fields in , we only include it in our qualitative discussion of the properties of potential counterparts in these regions in Appendix A.
4.2 Spectroscopy with Keck


C05 describe spectroscopy of faint radio galaxies and SMGs with the LRIS spectrograph (Oke et al. 1995) on the 10-m Keck-i222The W. M. Keck Observatory is operated as a scientific partnership among the California Institute of Technology, the University of California and the National Aeronautics and Space Administration. The Observatory was made possible by the generous financial support of the W. M. Keck Foundation. telescope during seven runs between 2002 March and 2004 February. Position for the 1.2 6.5-arcsec slits were chosen without regard for optical magnitude, guided where possible by radio identifications. In unused regions of the masks, slits were added for a variety of non-SMG objects.
For each mask, C05 obtained 3–12 30-min exposures in the red and blue arms of the spectrograph, with a useful wavelength range of 310-800 nm. Conditions were usually photometric, with seeing ranging from 0.7–1.1 arcsec.
We have searched the catalogue of Lockman Hole slit positions to find targets from our new SMG catalogue that were observed by C05. Nine slits had been placed on the most likely radio counterpart, that with the lowest value, identified in §3: LH 1200.001, .003, .005, .006, .008, .010, .011, .042 and .096. For LH 1200.004, a slit had been placed on a nearby radio source with . In another five cases, LH 1200.005, .009, .012, .014 and .042, slits had been placed on optical/IR galaxies not coincident with radio emission (additional slits, in the cases of LH 1200.005 and .042). For LH 1200.007, where there is no robust radio counterpart, a slit had been placed on a nearby X-ray source. For LH 1200.001, .003, .010 and .012, additional slits had also been placed on radio sources outside of our nominal 99.9-per-cent positional confidence regions.
Swinbank et al. (2004) presented near-IR spectra for five of our targets, using NIRSPEC on Keck ii during four runs in 2003–04. These spectra utilised a 42 0.76-arcsec slit (marked in Fig. 3), yielding a resolution of 1,500 across the band. We obtained 2.4-ks and spectra of LH 1200.001 during 2005 March 16 and 17 ut, using identical procedures to those described by Swinbank et al. (2004), although in poorer seeing (1 arcsec).
4.3 Spectroscopy with Gemini
To augment the spectroscopic data from Keck, we have obtained spectra from the Gemini333The Gemini Observatory is operated by the Association of Universities for Research in Astronomy, Inc., under a cooperative agreement with the NSF on behalf of the Gemini partnership: the National Science Foundation (United States), the Particle Physics and Astronomy Research Council (UK), the National Research Council (Canada), CONICYT (Chile), the Australian Research Council (Australia), CNP (Brazil) and CONICET (Argentina). Multi-Object Spectrograph (GMOS North – GN/02B/42) using 1-arcsec slits, 2 to 5 arcsec in length.
Data were taken in queue mode, in photometric conditions and 0.8-arcsec seeing, using the B600 grating (spectral range: 350–650 nm). The spectral resolution was with an output pixel scale of 0.0912 nm pixel-1. Each observation was split into 3-ks exposures, with a total integration time of 9 ks.
Five GMOS slits were placed on the most likely radio counterparts for LH 1200.005, .009, .010, .014 and .096. For LH 1200.001, .002, .006, .009, .010, .012 and .096, slits were placed on optical/IR galaxies not coincident with radio emission (additional slits, in the cases of LH 1200.006,.009, .010 and .096). Slits were placed on radio sources outside of our nominal 99.9% positional confidence regions for LH 1200.003 and .096.
In Appendix A we discuss our spectroscopic observations of the individual sources, one by one, referring to the slit positions shown in Fig. 3.

| Namea | magb | Magnitude-related notes | Spectrometer | Redshift-related notes | |
| LH 1200.001 | 25.67 0.08 | NNW radio id | 2.94 | GMOS | Optical galaxy to NW: Ly, N v, Si ii |
| 24.34 0.05 | SSW radio id | 3.04? | LRIS | Ly, N v?; AGN? | |
| LH 1200.002 | 24.83 0.04 | Tentative radio id | GMOS | for nearby optical galaxy | |
| LH 1200.003 | 24.04 0.03 | Central radio id | 0.53 | LRIS | |
| 25.40 0.12 | S radio id | 1.48 | LRIS | ||
| 2.43 | GMOS, LRIS | NNW radio id | |||
| LH 1200.004 | 26.14 0.18 | Central radio id | LRIS | ||
| 25.22 0.07 | S radio id | LRIS | line at 558nm? | ||
| LH 1200.005 | 25.79 0.14 | Central radio id; ERO | 2.15? | LRIS, NIRSPEC | ERO, 3′′ to W to radio source, H? |
| LH 1200.006 | 25.00 0.06 | SSE radio id | 2.14? | LRIS, NIRSPEC | IS abs; starburst |
| (LH 1200.007) | 3 | X-ray source, 21.76 0.01 | LRIS | = 0.715 for X-ray source | |
| LH 1200.008 | 22.01 0.01 | Central radio id | 1.21 | LRIS | IS abs; starburst |
| LH 1200.009 | 3 27.4 | Central radio id | 1.96? | LRIS | Ly, C iv; starburst (opt gal 4′′ SWW of radio) |
| LH 1200.010 | 22.78 0.02 | Confused region | 2.61 | LRIS, GMOS, NIRSPEC | Ly, N v, Si ii, H; starburst |
| LH 1200.011 | 23.68 0.03 | NNW radio id | 2.24 | LRIS, NIRSPEC | Ly abs, C iv abs, H; starburst |
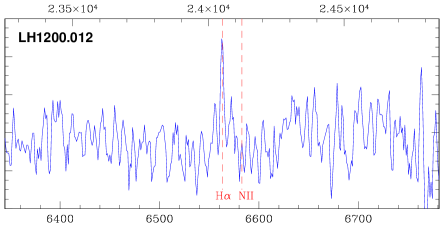
| LH 1200.012 | 24.28 0.03 | Confused region | 2.66 | LRIS, NIRSPEC | H; see §5 |
| LH 1200.014 | 23.05 0.02 | Confused region | 0.69 | LRIS | [O ii], Ca HK (2′′ SSW of brightest radio id) |
| LH 1200.017 | — | Diffraction spike | |||
| (LH 1200.019) | 3 | Brightest object 24.50 0.05 | |||
| 23.86 0.02 | N radio id | ||||
| (LH 1200.022) | 3 | Brightest object 21.20 0.01 | |||
| LH 1200.042 | 25.17 0.07 | WSW radio id | 1.85 | LRIS | IS abs |
| LH 1200.096 | 24.90 0.07 | SE radio id | 1.15 | LRIS | Starburst |
| (LH 1200.104) | — | Diffraction spike |
Notes:
Sources in parentheses lack robust radio identifications.
Values in bold are for sources identified in the radio ().
Values in bold are for redshifts that we consider to be most robust.
5 Discussion
5.1 The distribution of optical magnitudes
Table 3 lists the mag_best magnitudes of our sample in , measured using sextractor. Fig. 7 shows a histogram of magnitudes compared with those from the surveys by Smail et al. (2002), I02, Clements et al. (2004) and Pope et al. (2005). The various surveys broadly agree, with median -band magnitudes ranging between –26 and a wide range in magnitude within each sample. The Clements et al. (2004) sample has a bright tail which is less evident in the other surveys. Our sample appears to show the smallest dispersion, although the presence of upper-limits in all five samples make this statement hard to quantify.
Nevertheless, from this comparison we can state that the bright, radio-identified SMG population, spanning barely a magnitude in submm flux density, covers over 10 orders of magnitude in rest-frame ultraviolet flux. The optical magnitudes of the radio-identified SMGs discussed in this paper span around –26, with a faint tail. The median magnitude is , comparable to the sample analysed by C05, , and 0.6 mag fainter than the spectroscopically-identified sample of C05. As expected, a similar bias in the spectroscopically identified subset exists within our own sample, which is 0.9 mag brighter than our complete catalogue.


5.2 The distribution of spectroscopic redshifts
The redshift distribution determined here inevitably suffers from spectroscopic incompleteness, but our sample should be otherwise unbiased. Concentrating on cases where our spectroscopy failed to secure a robust redshift the failures tend to coincide with the faintest optical counterparts, , as one might expect. Looking at the long-wavelength flux ratios (Fig. 5) for those targets where we failed to obtain identifications or redshifts, e.g. LH1200.002 or .004, we see no indication that their (sub)mm/radio photometric properties differ from those of the sample as a whole. It seems unlikely therefore that they lie at substantially higher redshifts than the subset of SMGs for which we have obtained redshifts. The exceptions are LH1200.022, and especially LH1200.007, which have relatively low 0.85-/1.2-mm flux density ratios and fairly high 1.2-mm/1.4-GHz flux density ratios. This suggests they may lie at high redshift, or be particularly cold. However, as discussed in §3.2, these two sources are not particularly secure (although that may simply reflect their general faintness in all bands due to their high redshifts). Reliable identification of these two sources is therefore only achievable through higher resolution (interferometric) (sub)mm observations (e.g. Lutz et al. 2001).
For the six SMGs where we have a single radio identification (and hence an unambigious counterpart) and for which we have measured robust redshifts (Table 3), we determine a median of (where the scatter is estimated from bootstrap re-sampling). This rises slightly to if we include the four sources with robust redshifts for at least one radio counterpart and the five SMGs where we have less secure redshifts. These figures are slightly lower than, but entirely consistent with, the spectroscopic redshift distribution determined by C05 (z̄ = 2.2). This suggests that the statistical properties of the C05 sample has not been strongly biased by the modest significance 3) of some of the submm data used in their analysis.
The median redshift we derive is in reasonable agreement with that predicted by the Galform semi-analytic model (Baugh et al. 2005), which gives a median redshift of at our flux limit, with a quartile range of 0.9 and only 10–20 per cent of the population at . This again suggests that much of the activity in the bright SMG population is amenable to study via the precise positions derived from their radio counterparts. This provides a much-needed route to identify the true far-IR-luminous source within these frequently morphologically complex and crowded fields.
We illustrate in Fig. 8 the distribution of 1.2-mm/1.4-GHz and 0.85-/1.2-mm flux ratios for our sample versus our spectroscopic redshifts. The former show a trend to higher flux ratios at higher redshifts, in line with predictions from SED modelling (e.g. Carilli & Yun 1999), although with a large scatter; the latter flux ratio, however, is essentially a scatter plot. We conclude that significantly more reliable flux measurements (in terms of both absolute calibration and overall SNR) will be needed to use the 0.85-/1.2-mm flux ratio for astrophysical analysis.
At face value, both our spectroscopic redshift distribution and that of C05 are inconsistent with the redshift distribution (z̄ 3) claimed by Eales et al. (2003) using the flux density ratio (Fig. 8). The Eales et al. sample contained 23 sources with = 3.1–6.5 mJy (cf. 19 sources, = 1.6–5.7 mJy here), with a radio-detected fraction of 73 per cent (cf. 79 per cent here). Thus, the two samples differ only in that the Eales et al. photometry targets were selected above 4 at 1200 m rather than above 5 at a combination of 850 and 1200 m. We believe the disagreement in the mean redshifts derived by these studies most likely results from the fact that current photometric measurements in the mm and submm wavebands are insufficiently precise for typical SMGs to allow them to be used as a reliable redshift indicator, particularly when some data do not comprise fully sampled images. The disagreement may have been compounded by the lower significance of the Eales et al. targets, and the dual-wavelength extraction performed here could exclude the most distant starbursts (though we note that the radio-detection of a substantial number of the Eales et al. targets is hard to reconcile with the high median redshift claimed for that sample; indeed, the radio-based estimates given in Eales et al., with z̄ = 2.35, are more consistent with the spectroscopic results).
6 Conclusions
We have developed and applied a dual-survey extraction technique to SCUBA and MAMBO images of the Lockman Hole, resulting in a robust sample of 19 SMGs. Of these, 15 are detected securely by our deep radio imaging. Those undetected at 1.4 GHz can be explained by a combination of contamination by spurious sources (10 per cent) and the large observed scatter in radio flux densities, which is probably due to a significant range in dust temperature.
We determine 15 spectroscopic redshifts, of which we consider ten to be secure. The resulting redshift distribution (z̄ = 2.14 for the full spectroscopic sample) is consistent with that determined for a much larger sample by C05 (z̄ = 2.2). Our results thus support the conclusions of C05, who modelled their incompleteness and estimated only a small shift () in the median redshift as a result. Those galaxies for which our spectroscopy failed to determine redshifts are usually optically faint, , where the sample ranges from to with a median of 25.0.
From the radio detections, and the spectroscopy, is seems unlikely that a significant fraction of bright SMGs lie at very high redshift () and we conclude that the bright SMG population is readily amenable to study via radio-selected samples, down to a 850-m flux density limit of 7 mJy. ”We note, however, that the dual-wavelength extraction performed here could potentially bias our sample against very-high-redshift sources which would only be detected at 1.2mm.
An analysis of separations between SMGs and their radio counterparts has allowed us to re-calibrate the rule-of-thumb relationship between positional accuracy, beam size and significance. The most secure SMGs, at 10, representative of those expected in upcoming, confusion-limited, wide-field (tens of square degrees) 0.85-mm surveys using SCUBA-2 (Audley et al. 2004), with lower significance, simultaneous detections at 0.45 mm, will be located with a uncertainty of arcsec, at which level the precision of the telescope pointing and SCUBA-2 flat-field may become important contributors to the positional error budget. Assuming these sources of uncertainty can be minimised, the current requirement for deep radio coverage to identify counterparts and enable follow-up spectroscopy may not be as urgent, particularly if 3 3-arcsec deployable integral-field units are employed for spectroscopic follow up (e.g. KMOS — Sharples et al. 2003, 2004).
Acknowledgements
IS acknowledges support from the Royal Society. AWB acknowledges support from NSF grant AST-0205937, the Research Corporation and the Alfred P. Sloan Foundation.
References
- (1) Aretxaga I., Hughes D.H., Chapin E.L., Gaztañaga E., Dunlop J.S., Ivison R.J., 2003, MNRAS, 342, 759
- (2) Audley M.D. et al., 2004, SPIE, 5498, 63
- (3) Baugh C.M., Lacey C.G., Frenk C.S., Granato G.L., Silva L., Bressan A., Benson A.J., Cole S., 2005, MNRAS, 356, 1191
- (4) Blain A.W., Smail I., Ivison R.J., Kneib J.-P., 1999, MNRAS, 302, 632
- (5) Blain A.W., Chapman S.C., Smail I., Ivison R.J., 2004, ApJ, 611, 52
- (6) Borys C. et al., 2004, MNRAS, 352, 759
- (7) Borys C., Scott D., Chapman S., Halpern M., Nandra K., Pope A., 2005, MNRAS, 355, 485
- (8) Carilli C.L., Yun M.S., 1999, ApJ, 513, L13
- (9) Chapman S.C., Smail I., Ivison R.J., Blain A.W., 2002, MNRAS, 335, L17
- (10) Chapman S.C., Blain A.W., Ivison R.J., Smail I., 2003, Nature, 422, 695 (C03)
- (11) Chapman S.C., Smail I., Blain A.W., Ivison R.J., 2004a, ApJ, 614, 671
- (12) Chapman S.C., Smail I., Windhorst R., Muxlow T., Ivison R.J., 2004b, ApJ, 611, 732
- (13) Chapman S.C., Blain A.W., Smail I., Ivison R.J., 2005, ApJ, 622, 772 (C05)
- (14) Clements D. et al., 2004, MNRAS, 351, 611
- (15) Downes A.J.B., Peacock J.A., Savage A., Carrie D.R., 1986, MNRAS, 218, 31
- (16) Downes D., Solomon P.M., 2003, ApJ, 582, 37
- (17) Dunlop J.S. et al., 2004, MNRAS, 350, 769
- (18) Dunlop J.S., 2005, in: ‘Starburst — from 30 Doradus to Lyman break galaxies’, eds de Grijs R., Gonzalez-Delgado R.M., in press (astro-ph/0501429)
- (19) Eales S., Bertoldi F., Ivison R.J., Carilli C., Dunne L., Owen F., 2003, MNRAS, 344, 169
- (20) Egami E. et al., 2004, ApJS, 154, 130
- (21) Fox M.J. et al., 2002, MNRAS, 331, 839
- (22) Gear W.K., Lilly S.J., Stevens J.A., Clements D.L., Webb T.M., Eales S.A., Dunne L., 2000, MNRAS, 316, L51
- (23) Genzel R., Baker A.J., Tacconi L.J., Lutz D., Cox P., Guilloteau S., Omont A., 2003, ApJ, 584, 633
- (24) Greve T.R., Ivison R.J., Bertoldi F., Stevens J.A., Lutz D., Dunlop J.S., 2004, MNRAS, 354, 779
- (25) Greve T.R. et al. 2005, MNRAS, 359, 1165
- (26) Holland W.S. et al., 1999, MNRAS, 303, 659
- (27) Huang J.-S. et al., 2004, ApJS, 154, 44
- (28) Hughes D.H. et al., 1998, Nature, 394, 241
- (29) Ivison R.J., Smail I., Le Borgne J.-F., Blain A.W., Kneib J.-P., Bézecourt J., Kerr T.H., Davies J.K., 1998, MNRAS, 298, 583
- (30) Ivison R.J., Smail I., Barger A., Kneib J.-P., Blain A.W., Owen F.N., Kerr T.H., Cowie L.L., 2000, MNRAS, 315, 209
- (31) Ivison R.J. et al., 2002, MNRAS, 337, 1 (I02)
- (32) Ivison R.J. et al., 2004, ApJS, 154, 124
- (33) Kneib J.-P., van der Werf P.P., Kraiberg Knudsen K., Smail I., Blain A., Frayer D., Barnard V., Ivison R., 2004, MNRAS, 349, 1211
- (34) Knudsen K.K., van der Werf P.P., Jaffe W., 2003, A&A, 411, 343
- (35) Kreysa E. et al., 1998, Proc. SPIE, 3357, 319
- (36) Laurent G.T. et al., 2005, ApJ, 623, 742
- (37) Ledlow M.J., Smail I., Owen F.N., Keel W.C., Ivison R.J., Morrison G.E., 2002, ApJ, 577, L79
- (38) Lutz D. et al., 2001, A&A, 378, L70
- (39) Mortier A.M.J. et al., 2005, MNRAS, submitted
- (40) Neri R. et al., 2003, A&A, 597, L113
- (41) Oke J.B. et al., 1995, PASP, 107, 375
- (42) Pope A., Borys C., Scott D., Conselice C., Dickinson M., Mobasher B., 2005, MNRAS, 358, 149
- (43) Scott S.E. et al., 2002, 331, 817
- (44) Scott S.E., 2004, PhD thesis, University of Edinburgh
- (45) Sharples R.M., Bender R., Hofmann R., Genzel R., Ivison R.J., 2003, SPIE, 4841, 1562
- (46) Sharples R.M. et al., 2004, SPIE, 5492, 1179
- (47) Simpson C., Dunlop J.S., Eales S.A., Ivison R.J., Scott S.E., Lilly S.J., Webb T.M.A., 2004. MNRAS, 353, 179
- (48) Smail I., Hogg D.W., Yan L., Cohen J.G., 1995, ApJ, 449, L105
- (49) Smail I., Ivison R.J., Blain A.W., 1997, ApJ, 490, L5
- (50) Smail I., Ivison R.J., Kneib J.-P., Cowie L.L., Blain A.W., Barger A.J., Owen F.N., Morrison G., 1999, MNRAS, 308, 1061
- (51) Smail I., Ivison R.J., Owen F.N., Blain A.W., Kneib J.-P., 2000, ApJ, 528, 612
- (52) Smail I., Ivison R.J., Blain A.W., Kneib J.-P., 2002, MNRAS, 331, 495
- (53) Smail I., Chapman S.C., Ivison R.J., Blain A.W., Takata T., Heckman T.M., Dunlop J.S., Sekiguchi K., 2003, MNRAS, 342, 1185
- (54) Smail I., Smith G.P., Ivison R.J., 2005, ApJ, in press (astro-ph/0506176)
- (55) Swinbank A.M., Smail I., Chapman S.C., Blain A.W., Ivison R.J., Keel W.C., 2004, ApJ, 617, 64
- (56) Townsend R.H.D., Ivison R.J., Smail I., Blain A.W., Frayer D.T., 2001, MNRAS, 328, L17
- (57) Webb T.M. et al., 2003a, ApJ, 587, 41
- (58) Webb T.M.A., Lilly S.J., Clements D.L., Eales S., Yun M., Brodwin M., Dunne L., Gear W.K., 2003b, ApJ, 597, 680
- (59) Wiklind T., 2004, ApJ, 588, 736
Appendix A
Notes on our spectroscopic observations of the individual sources, referring to the slit positions shown in Fig. 3.
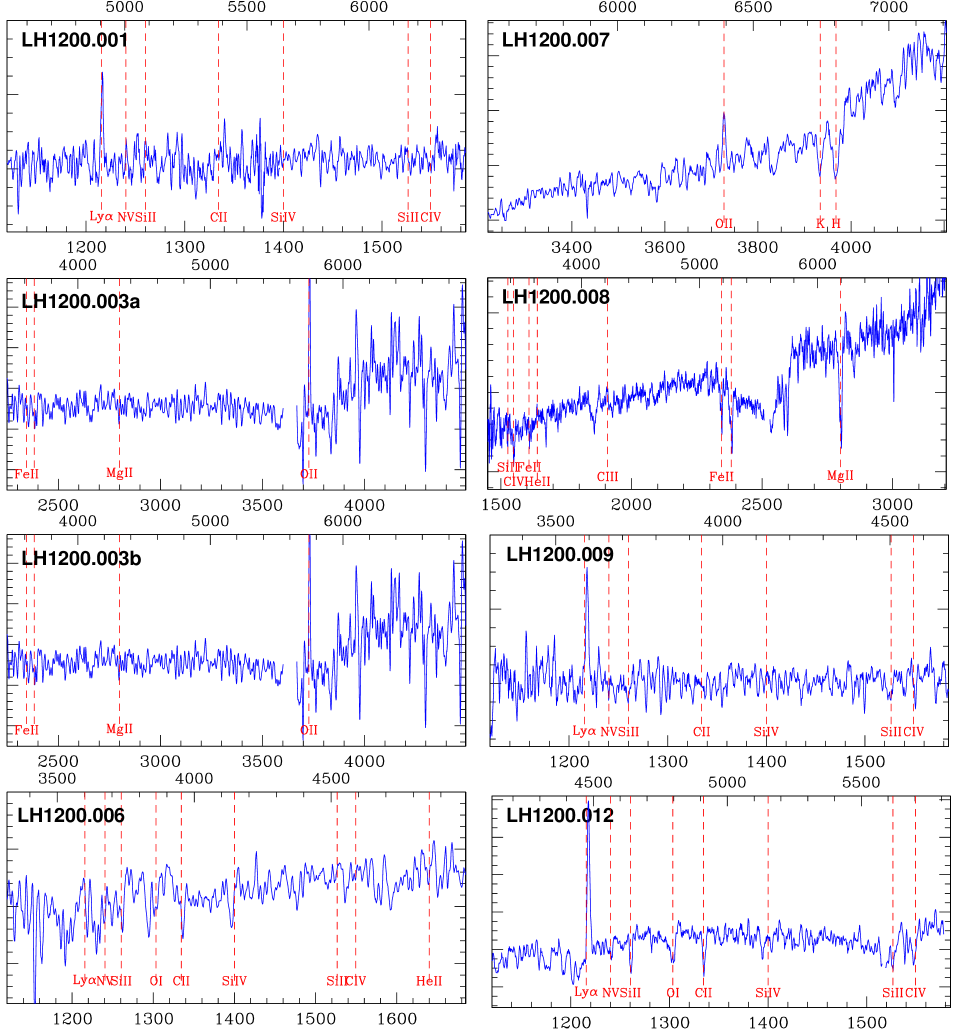
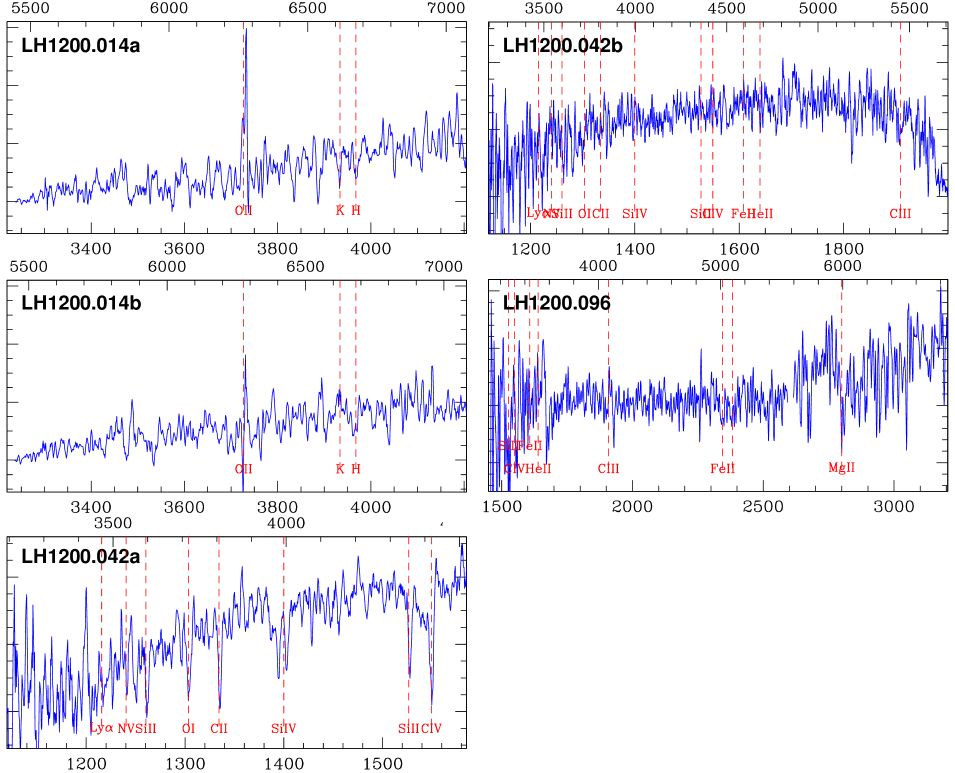
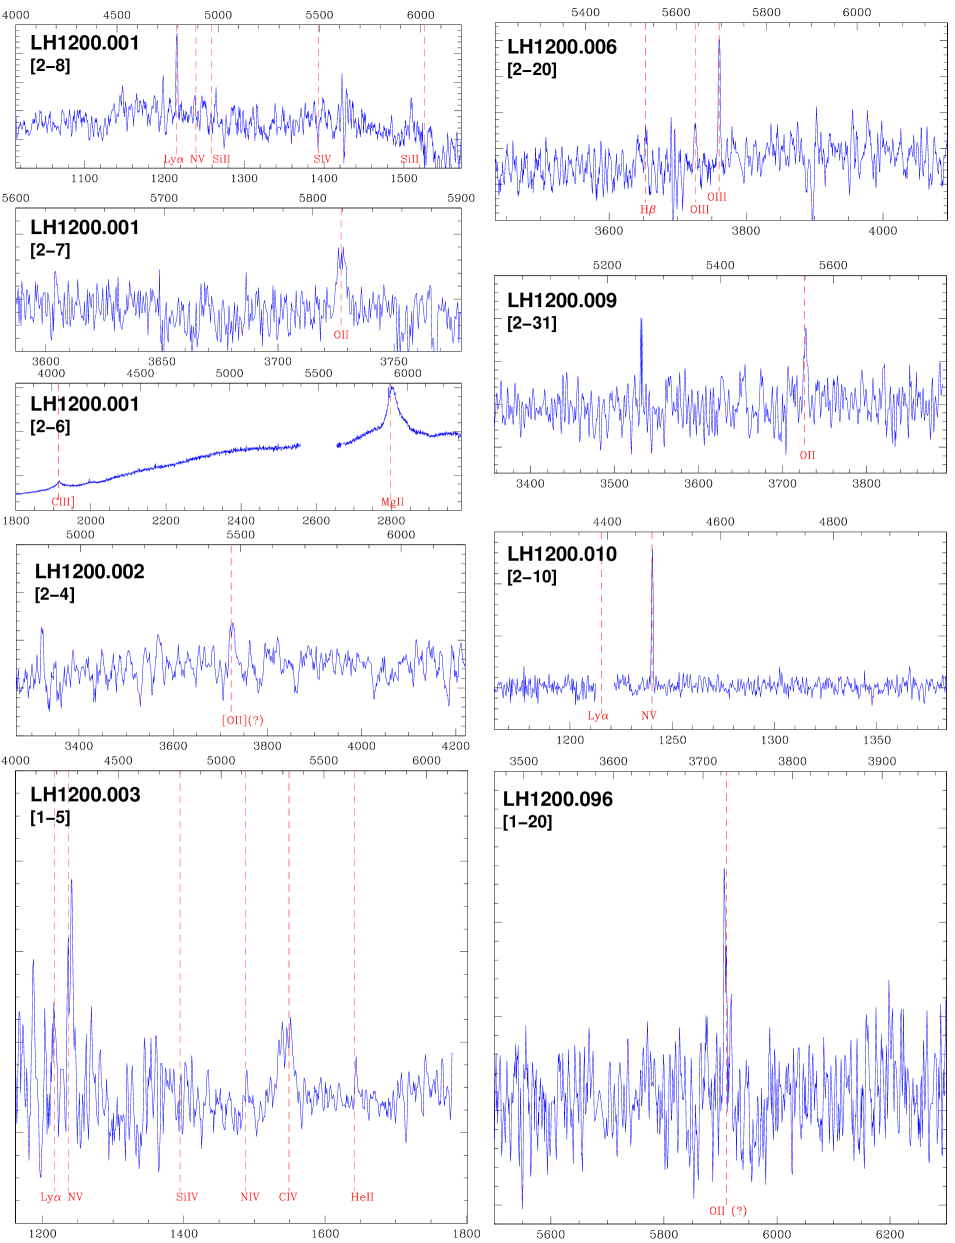
LH 1200.001: A complex field. LRIS slits on several masks had been placed on a faint -band source coincident with the most probable radio counterpart (). Its spectrum, shown in Fig. A1, is consistent with a redshift of 3.036, with Ly and hints of weak N v and several other lines. We searched for [O ii] and [O iii] using NIRSPEC (§4.1), yet we were not able to confirm or rule out with confidence. A search for CO(3–2) at IRAM was unsuccessful (Greve et al. 2005), though this could have been due to insufficient velocity coverage. The second radio counterpart, 4 arcsec to the north and also with , is associated with an ERO (Fig. 4). The NIRSPEC longslit was positioned to cover this galaxy; no lines were evident. Its closest neighbour was observed with GMOS (Fig. A2; [2–8]) and found to have emission lines (Ly , possibly N v and Si ii) consistent with (the apparent continuum blueward of Ly is merely an artifact of the reduction process). At the edge of the same slit, near the northern radio position, there is tentative evidence for line emission from Ly , N v and possibly C iv at . The optically bright radio source 11 arcsec SE of the SMG centroid (Fig. A2; [2–6]) is an AGN, with broad C iii] and Mg ii emission lines, this time at . The optical galaxy 8 arcsec SSE of the SMG centroid (Fig. A2; [2–7]) has [O ii] at . A further ERO, overlooked by I02, and detected at 3.5 in our smoothed radio image, lies 7.5 arcsec NNE of the SMG centroid (Fig. 4). We conclude that the submm emission likely originates from the two central radio components, which most probably lie at .
LH 1200.002: Two galaxies in this field were targeted spectroscopically with GMOS. One target, slit [2–5], lies close to the faint radio emission near the SMG centroid, but we were unable to identify its redshift. The other target — probably unassociated with the SMG — has a faint emission line which, if [O ii], indicates (Fig. A2; [2–4]).
LH 1200.003: Another complex field. LH 1200.003 may be a blend of 2–3 SMGs, with MAMBO resolving the source into two, and the VLA resolving three faint radio sources (one marginally outside our radio search region). Slits had been placed on all likely counterparts. The radio source to the SE, targeted by slits on five LRIS masks at various position angles, is a starburst at . The most probable (central) radio identification is associated with a galaxy at (Fig. A1). The galaxy to the NNW — possibly associated with faint mm emission, LH 1200.213 in Greve et al. (2004) — was targeted spectroscopically using LRIS and GMOS and is an AGN at , with broad C iv emission, as well as narrower Ly , He ii, N iv and N v (Fig. A2; [1–5]).
LH 1200.004: From two possibilities, an LRIS slit had been placed on the galaxy with the marginally higher value (0.044 versus 0.033). The galaxy has a weak line in its spectrum at 558 nm, possibly Ly , but we were unable to determine the redshift reliably.
LH 1200.005: LRIS slits were placed on a faint optical galaxy 3 arcsec west of the obvious radio counterpart. The galaxy is estimated to lie at from absorption lines in its optical spectrum (C05), a value tentatively confirmed via H in the band, although NIRSPEC slit-rotation problems mean the line cannot be recovered in the final spectrum or image. Although optically faint (Fig. 3, ), the extremely red object (ERO) described by Lutz et al. (2001), seen in Fig. 4 at the radio position, was targeted using LRIS and GMOS. No redshift was forthcoming. The likelihood of finding a galaxy so close to the SMG centroid is slim, so the two may well be associated, but we regard the redshift as tentative until H is detected unambiguously.
LH 1200.006: LRIS slits had been placed on by far the most probable radio counterpart in the region (). Its optical spectrum was identified by C05 as that of a starburst at (Fig. A1). This position was also observed by Swinbank et al. (2004) using NIRSPEC, although only [N ii] would have been accessible. Since the one-dimensional optical spectrum is not wholly convincing, this redshift cannot be relied upon absolutely. The optically bright object to the NW was targeted by GMOS: a foreground galaxy () with H and [O iii] emission lines evident (Fig. A2; [2–20]).
LH 1200.007: There is no secure radio counterpart. An LRIS slit was placed on a nearby XMM-Newton X-ray source, which is marginally detected in our smoothed radio image. It lies at (Fig. A1), and may contribute submm flux to what could well be a blended submm source. The faint, red galaxy to the north, barely seen in a noisy part of our image (Fig. 4), was not targeted spectroscopically.
LH 1200.008: An LRIS slit had been placed on by far the most probable radio counterpart in the region (), an galaxy amongst a dense ensemble of fainter objects (Fig. 3), with absorption lines in its spectrum corresponding to (Fig. A1), with C iii] and He ii weakly in emission.
LH 1200.009: GMOS slits were placed on the radio counterpart and on an optically bright galaxy to the NNW. An unambiguous redshift could not be determined for either, although the NNW galaxy may show faint [O ii] at (Fig. A2; [2–31]). LRIS slits had been placed on a faint -band galaxy 6 arcsec SSW of the obvious radio counterpart. This was due to an positional offset in an earlier version of the Greve et al. MAMBO catalogue. The galaxy 3 arcsec NW of the slit centre, 4 arcsec SWW of the radio source, appears to be a Ly emitter at (Fig. A1), though no other lines are seen. As with LH1200.005, the likelihood of finding a galaxy so close to the submm centroid is low, so it may be associated with the radio source and the SMG. The position of the radio source is blank to in our deep Gemini/NIRI imaging (Fig. 4). The Ly emitter is detected, barely, in . We note that at least one similarly faint SMG (SMM J14009+0252, ) has been found at (Smith et al., in preparation).
LH 1200.010: LRIS slits had been placed on both of the radio-identified galaxies in this region with one of them (and several other radio-quiet galaxies) targeted by GMOS. By far the most robust counterpart (), morphologically complex in (Fig. 3) but relatively uncluttered in (Fig. 4), has the spectrum of a starburst at (C05, SMM J105230.73+572209.5), confirmed in H by Swinbank et al. (2005) and in N v by GMOS (Ly falling between chips — Fig. A2; [2–10]), although undetected in CO(3–2) at IRAM (Greve et al. 2005). The LRIS spectrum of the radio-bright disk-like galaxy 10 arcsec to the SW is also consistent with this redshift. Nothing was seen at the remaining GMOS slit positions, [2–11] and [2–12].
LH 1200.011: An LRIS slit had been placed on by far the most probable radio counterpart in the region (), a compact source with a 5-arcsec-long tail visible in and (Figs 3 & 4). It has the spectrum of a starburst at (C05, SMM J105158.02+571800.2), confirmed convincingly in H and [N ii] by Swinbank et al. (2005). The fainter radio source, 14 arcsec to the NEE, lies at . Simpson et al. (2004) identified a -band feature, presumably a noise spike, as [O ii] at (rest-frame 359 nm for ), as well as a continuum break at 1.2 m (consistent with the Balmer break at either redshift).
LH 1200.012: A complex field, with the robust radio identification () lying between 3–4 galaxies visible in , and on top of a galaxy seen in the Spitzer 3.6-m imaging of Huang et al. (2004). A NS-oriented LRIS slit had been placed on the brightest of the -band galaxies, 2 arcsec SSE, a starburst at (Fig. A1; C05, SMM J105155.47+572312.7). The NIRSPEC slit, centred on the same point, yielded continuum but no strong lines. However, 2 arcsec NW along the slit — where fuzz is visible in , 1 arcsec SW of the radio centroid — there is more red continuum emission a line at 2.405 m, corresponding to H at (Fig. A3). We view the likelihood of its association with the SMG as high. Another LRIS slit was placed on the radio source to the NW, associated with another Spitzer galaxy, this time at ( in H according to Swinbank et al. 2005). GMOS slits — [1–29] through [1–32] — were placed on all of the brightest optical knots, but nothing was seen in the spectra.
LH 1200.014: An interesting case, with strong similarities to LH 1200.010 and .012. The brightest of the two radio counterparts — associated with faint -band emission (Fig. 4) — is the least likely identification, although by a small margin ( versus 0.022). LRIS slits were placed on the brightest -band galaxy (Fig. 3), just to the WSW, which displays [O ii] in emission as well as Ca H/K and several Balmer lines in absorption at (Fig. A1 — LH 1200.014a; C05, SMM J105200.22+572420.2). Its association with the SMG, and with the radio-identified galaxies, is plausible, as is the possibility that it acts as a lens (Chapman et al. 2002). The slit passed over the radio centroid which appears to share the same broad spectral features (Fig. A1 — LH 1200.014b). A GMOS slit, [1–23], was placed directly on the radio centroid, but the spectral coverage (550 nm in this case) meant we were unable to confirm the presence of [O ii].
LH 1200.017: A robust radio identification that was not targeted spectroscopically.
LH 1200.019: There is no obvious identification in this field.
LH 1200.022: Again, no obvious identification to target spectroscopically.
LH 1200.042: LRIS slits had been placed on by far the most probable radio counterpart in the region (). Although optically faint, it has an absorption-line spectrum consistent with (Fig. A1 — LH 1200.042a). The bright optical galaxy 3 arcsec to the SSE, targeted by both GMOS [2–25] and LRIS, is associated with very faint radio emission and is tentatively consistent with (Fig. A1 — LH 1200.042b).
LH 1200.096: Again, LRIS and GMOS slits had been placed on the most probable radio counterpart (), an ERO (I02) visible out to 24 m (Egami et al. 2004), ignoring several brighter optical galaxies. The LRIS spectrum was classified as a starburst at by C05 (Fig. A1 — SMM J105151.69+572636.0); GMOS saw nothing at this position. This is the curious SMG discussed by I02, apparently associated with the steep-spectrum lobe of a radio galaxy, the flat-spectrum core of which lies to the west, with [O ii] evident at in its spectrum (Fig. A2, [1–20]). Is this system a jet-triggered burst, a galaxy projected onto an unrelated radio lobe, or a faint, dusty, ultra-steep-spectrum radio galaxy? Our picture of this system is muddled and contradictory. To confuse matters further, our NIRI -band imaging (Fig. 4) reveals another ERO, WSW of the radio emission, visible out to 8 m in the Spitzer imaging, and just missed by GMOS slit [1–19] on a nearby, bluer galaxy.
LH 1200.104: Despite the lack of radio detections in the vicinity, a bright Spitzer counterpart described by Ivison et al. (in preparation) suggests this SMG is not spurious. A diffraction spike from the nearby star makes identification impossible in our optical imaging.