A variable Quasi-Periodic Ocillation in M82 X-1.
Timing and
spectral analysis of XMM-Newton and RossiXTE
observations††thanks: Based on observations obtained with XMM-Newton,
an ESA science mission with instruments and contributions directly funded
by ESA Member States and NASA, and with RossiXTE.
Abstract
We report results from a spectral and timing analysis of M82 X-1, one of the brightest known ultraluminous X-ray sources. Data from a new 105 ks XMM-Newton observation of M82 X-1, performed in April 2004, and of archival RossiXTE observations are presented. A very soft thermal component is present in the XMM spectrum. Although it is not possible to rule out a residual contamination from the host galaxy, modelling it with a standard accretion disk would imply a black hole mass of . An emission line was also detected at an energy typical for fluorescent Fe emission. The power density spectrum of the XMM observation shows a variable QPO at frequency of 113 mHz with properties similar to that discovered by Strohmayer & Mushotzky (2003). The QPO was also found in 7 archival RXTE observations, that include those analyzed by Strohmayer & Mushotzky (2003) and Fiorito & Titarchuk (2004). A comparison of the properties of this QPO with those of the various types of QPOs observed in Galactic black hole candidates strongly suggests an association with the type-C, low frequency QPOs. Scaling the frequency inversely to the black hole mass, the observed QPO frequency range (from 50 to 166 mHz) would yield a black hole mass anywhere in the interval few tens to 1000 .
keywords:
galaxies: individual: M82 — stars: oscillations — X-rays: binaries — X-rays: individual: M82 X-1 — X-rays: stars1 Introduction
First revealed by the Einstein Observatory (see e.g. Fabbiano 1989), point-like, off-nuclear X-ray sources with luminosities significantly in excess of the Eddington limit for one solar mass have been discovered in a large number of nearby galaxies (e.g. Colbert & Ptak 2002; Colbert & Miller 2004; Swartz et al. 2004; Liu & Bregman 2005). The nature of most of these ultraluminous X-ray sources (ULXs) remains unclear. In several cases a variability on timescales of months/years has been detected, a possible signature of an accreting compact object. Were these sources X-ray binaries in the host galaxy, and assuming Eddington-limited accretion, masses in the range 100-1000 are inferred from the observed flux. The central object would be then an intermediate mass black hole (IMBH). Mass estimates based on the Eddington limit are, however, questionable: these sources need not to be spherically symmetric, nor stationary. It has been proposed that many of the ULX properties can be explained assuming that they do not emit isotropically (King et al., 2001) or are dominated by emission from a relativistic jet (e.g. Kaaret et al. 2003). In this case, they may harbor stellar mass BHs and may be similar to Galactic black-hole binaries.
The available XMM-Newton and Chandra observations show that, for sources with sufficiently good statistics, the best fit of the X-ray spectrum is often obtained with a two-component model: an absorbed multicolor disk (MCD)+power-law. Some ULXs have MCD temperatures eV, much lower than in Galactic BH binaries. Since , the low temperature of the soft component has been taken as further evidence for the presence of an IMBH of 100–1000 in some ULXs (Miller et al., 2003, 2004; Cropper et al., 2004; Zampieri et al., 2004; Kong et al., 2005). A few sources have a temperature above 1 keV, higher than that of Galactic BH candidates, but still in the range of Galactic microquasars.
Optical counterparts of ULXs have been studied by a number of authors (see e.g. Zampieri et al. 2004 and Liu et al. 2005, and references therein). Several ULXs are associated with optical emission nebulae of a few hundred parsecs in diameter, whose properties are consistent with those of X-ray irradiated nebulae (Pakull & Mirioni, 2002).
Another approach to study the nature of ULXs is through time variability. The analysis of the aperiodic variability in the X-ray flux of X-ray binaries is a powerful tool to study the properties of the inner regions of the accretion disk around compact objects (for a review see van der Klis 2005). In particular, Quasi-Periodic Oscillations (QPOs) provide well-defined frequencies, which can be linked to specific time scales in the disk. QPOs can be broadly divided into three classes: (a) QPOs at very low frequencies (0.02 Hz), probably associated to oscillations and instabilities in the accretion disk (see Morgan et al. 1997; Belloni et al. 1997, 2000); (b) Low-Frequency (LF) QPOs, with typical frequencies between 0.1 and 10 Hz, probably connected to similar oscillations in neutron star systems (see e.g. Belloni et al. 2002; Remillard et al. 2002a; van der Klis 2005; Casella, Belloni & Stella 2005), over whose origin there is no consensus; in Black Hole Candidates (BHCs) 3 main different types of LF QPOs have been identified (Casella, Belloni & Stella 2005, and references therein); (c) “hecto-Hertz” QPOs, with a typical frequency of 100-300 Hz, in two cases observed to appear in pairs (Strohmayer, 2001a, b). It is currently unclear whether these QPOs show a constant frequency for each source (see Homan et al. 2001; Remillard et al. 2002b), and whether they do appear in pairs obeying particular frequency ratios (see Remillard et al. 2002b). However, since they identify the highest frequencies observed in these systems, they are the best candidates for association with, e.g., the keplerian frequency at the innermost stable orbit, or relativistic precession frequencies.
Whatever their physical nature, as they originate in the inner regions of accretion disks around black holes, these features are expected to be produced also in ULXs. However, if ULXs contain IMBHs of 100-1000 , the frequencies involved are much smaller. The first and, to date, only ULX where a QPO has been discovered is M82 X-1 (Strohmayer & Mushotzky, 2003). The QPO has a frequency of 54.4 mHz and a FWHM of 11.4 mHz, leading to a quality value 5. The total fractional rms of the QPO in the 2-10 keV band is 8.4%. Recently, Fiorito & Titarchuk (2004) reported the identification of another QPO at 106 mHz in the power spectrum of M82 X-1 from RossiXTE data, arguing that it may be a harmonic of the QPO at 54 mHz.
Here we report the results from a joint spectral and timing analysis of a 105 ks XMM-Newton observation of M82 X-1 performed in April 2004 and of archival RossiXTE observations of the same field. The new XMM data are part of a pointing to M82, originally requested to study the enrichment of the galactic interstellar medium (Ranalli et al., in preparation). The plan of the paper is the following. In §2 we present the spectral analysis of the new XMM observation and a re-analysis of the data by Strohmayer & Mushotzky (2003). §3 reports the long term light curve of M82 X-1. In §4 the timing analysis of the new XMM observation and other archival RossiXTE observations is presented. Finally, in §5 we discuss our results.
2 Spectral Analysis
2.1 XMM-Newton observation of April 2004
XMM-Newton observed the galaxy M82 on April 21, 2004 (Observation ID 0206080101, PI: P. Ranalli) for a total exposure time of 105 ks. The three XMM EPIC cameras (pn, MOS1 and MOS2) operated in Full Frame mode with the medium filter. Photon lists, data screening, region selection and events extraction were performed with standard software (XMM-SAS v 5.4.1 and 6.0.0). Events lists were directly extracted from the observation data files using the tasks epproc and emproc for the EPIC pn and MOS data, respectively. The last part of the exposure was affected by high background radiation. Standard high flares filtering (total off-source count rate above 10 keV less than 1 count s-1 for pn and 0.35 count s-1 for MOS) leaves 76/72 ks of good time intervals for the pn/MOS cameras. Slightly different good time intervals were used for the spectral and timing analysis, as specified below.
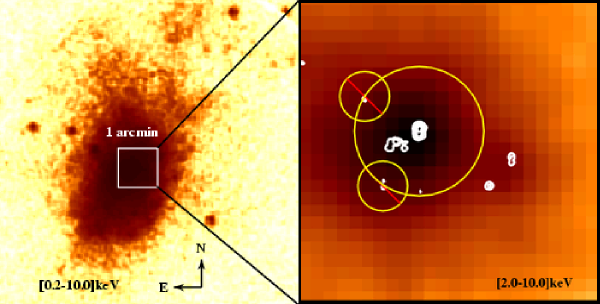
Source counts of M82 X-1 were extracted from a circular region of radius 13′′, centered on the coordinates RA= 09:55:50.2, DEC=+69:40:47. A previous observation with Chandra showed several sources in or nearby the position of M82 X-1 (Matsumoto et al., 2001). To avoid as much as possible contaminations we subtracted the contribution of some of them by excluding circular regions of 5′′ radius centered on the Chandra positions (see Figure 1). The nearest sources could not be eliminated in this way. Another strong source of background contamination, especially at low energies, is the host galaxy itself. Strohmayer & Mushotzky (2003) did not attempt to subtract it and limited their analysis to energies keV. Here we try to perform spectral fits of the XMM data in the [0.8-10] keV range and therefore perform subtraction of the host galaxy diffuse emission. The background was extracted from an annulus of inner and outer radii of 18 and 35′′, respectively, eliminating the contribution of sources 1, 8 and 9 of Matsumoto et al. (2001) in a way similar to that described above. The background subtracted count rate is 1.0 count s-1 for pn and 0.35 count s-1 for each MOS.
Spectra were grouped to require at least 150/80 counts per bin for pn/MOS and analyzed with XSPEC v.11.2.0. Standard interstellar absorption (wabs) was taken into account and an overall normalization constant was used to minimize residual detector calibration uncertainties. Results of the spectral fits with various models are reported in Table 1. The spectrum is rather composite, so that fits with single component models do not give satisfactory results. In particular, the residual contribution from the host galaxy at soft energies ( 2 keV) needs to be adequately modelled. In a different context, Stevens et al. (2003) tried to fit the nuclear emission of M82 with two MEKAL (optically thin, thermally emitting plasma) components plus a power-law (PL). Following Stevens et al. (2003), we tried to fit the residual galactic contamination with a dual MEKAL model with different absorbing columns. Using this model for the diffuse emission plus an absorbed PL for the ULX gives a reasonable fit ( for 846 d.o.f.). This can be further improved adding a third MEKAL component, needed mainly to fit a residual excess in emission around 6.6 keV ( for 843 d.o.f.). This line, attributed to fluorescent K Fe emission, can also be fitted adding a gaussian to the PL component.
| Model | Column density | Temperature | Photon index | Line param. | |
|---|---|---|---|---|---|
| Red. | |||||
| Obs.ID 0206080101 | |||||
| WABS*MEK + | 1.660.08 | 0.510.03 | |||
| WABS*MEK + | 1.310.18 | 0.990.07 | |||
| WABS*PL | 1.380.07 | 1.540.02 | 1.31(846) | ||
| WABS*MEK + | 1.670.08 | 0.510.04 | |||
| WABS*MEK + | 1.310.19 | 0.960.07 | |||
| WABS*(PL+GAUSS) | 1.380.07 | 1.560.02 | E=6.640.03 | 1.27(843) | |
| 0.090.01 | |||||
| WABS*MEK + | 1.670.10 | 0.490.06 | |||
| WABS*MEK + | 1.440.20 | 0.940.08 | |||
| WABS*MEK + | 8.864.34 | 7.591.22 | |||
| WABS*PL | 1.310.11 | 1.610.05 | 1.24(843) | ||
| WABS*MEK + | 1.970.34 | 0.430.06 | |||
| WABS*MEK + | 1.470.16 | 0.900.03 | |||
| WABS*MEK + | 9.964.64 | 8.241.21 | |||
| WABS*(PL+MEK) | 1.390.10 | 0.140.03 | 1.650.05 | 1.24(841) | |
| WABS*MEK + | 1.600.12 | 0.480.08 | |||
| WABS*MEK + | 1.680.18 | 0.920.07 | |||
| WABS*MEK + | 13.7210.04 | 6.351.44 | |||
| WABS*(PL+MCD) | 1.760.24 | 0.180.01 | 1.660.06 | 1.22(841) | |
| Obs.ID 0112290201 | |||||
| WABS*MEK + | 1.500.04 | 0.560.01 | |||
| WABS*MEK + | 1.820.14 | 1.670.11 | |||
| WABS*(PL+MCD) | 5.990.31 | 0.190.01 | 1.530.04 | 1.17(884) | |
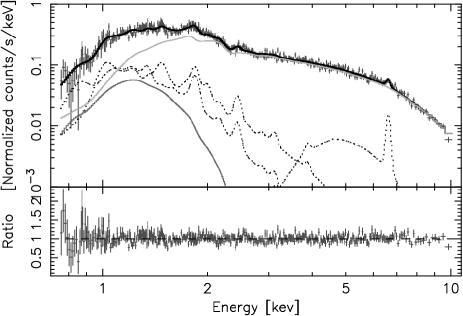
Adding an additional soft component to the PL results in a further improvement of the fit. The best fit of the joint pn and MOS spectra of M82 X-1 is obtained adding to the composite 3-MEKAL model of the diffuse galactic emission and the PL a multicolor disk (MCD) component with a very low temperature ( eV; see again Table 1). Adding the MCD component to the 3-MEKAL plus PL model leads to an improvement in of . A plot of the [0.8-10.0] keV EPIC pn spectrum with the best fitting spectral model is shown in Figure 2.
To check the accuracy of the power-law photon index, we tried to fit only the high energy part of the spectrum of M82 X-1 in the energy interval [3.3-10.0] keV (cfr. Fiorito & Titarchuk 2004). This should clearly minimize the contamination from the galactic diffuse soft emission. In this energy range the fits were performed with a power-law plus one or two MEKAL components. Without fixing the value of the column density, unacceptable fits or unreasonably high/low values of some parameters are obtained. Thus, we kept fixed at the values derived from the best fits in Table 1. The resulting photon index is in the range , in agreement within with that derived from the full spectral fit, (see Table 1).
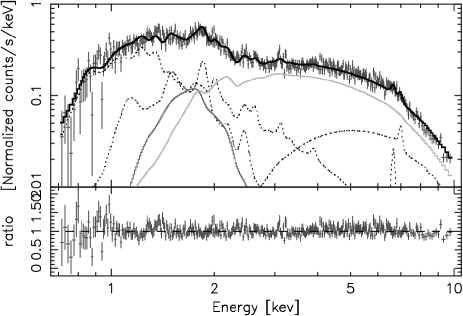
2.2 XMM-Newton observation of May 2001
The XMM observation taken on May 6, 2001 (Observation ID 0112290201), analyzed by Strohmayer & Mushotzky (2003), lasted 31 ks. We re-analyzed it following the procedure outlined in the previous subsection. Standard flares filtering leaves 22 and 29 ks of good time intervals for the pn and MOS cameras, respectively. Source counts were extracted from a 13′′ region centered on the same source position. The net count rate is 1.6 count s-1 for pn and 0.56 count s-1 for each MOS. The best fit of this observation is obtained with a dual MEKAL model plus a PL+MCD with different absorbing columns. Adding a third MEKAL component leads to an improvement of the fit, but the temperature converges to unphysically large values ( keV). The parameters of the best fit are reported in Table 1. The temperature of the MCD component and the PL photon index are consistent, within , with those of the April 2004 observation. However, the absorbing column of these components is approximately 3 times larger than that measured in the 2004 observation. It should be noted that the relative normalization and temperatures of the MEKAL components vary slightly between the 2001 and 2004 observations. Clearly, this is not a consequence of a variation in the diffuse galactic emission, but reflects simply the fact that the model adopted for it is approximate.
Also in this case, we checked the accuracy of the PL photon index fitting the spectra in the restricted energy interval [3.3-10.0] keV. The fits were performed with a PL, with or without a MEKAL component. As for the 2004 observation, without freezing unacceptable fits or unreasonably high/low values of some parameters are obtained. Fixing the column density at the value reported in Table 1, the resulting photon index is in the range , consistent within with that of the full spectral fit, .
Finally, we note that, although Strohmayer & Mushotzky (2003) reported evidence for a Fe line at 6.55 keV from an analysis of the spectral residuals, we are unable to confirm its detection (the improvement obtained adding a gaussian component to the fit is negligible).
| Observatory | Date | Count Rate | Absorbed Fluxa | Unabsorbed fluxa |
|---|---|---|---|---|
| (count s-1) | (erg cm-2 s-1) | (erg cm-2 s-1) | ||
| Chandra HRC-I | 1999-10-28 | 0.07b | / c | / c |
| Chandra HRC-I | 2000-01-20 | 0.52b | / c | / c |
| XMM EPIC | 2001-05-06 | 1.6/0.56d | ||
| XMM EPIC | 2004-04-21 | 1.0/0.35d | ||
| a For the XMM EPIC observations, average of the pn and MOS fluxes as calculated by XSPEC | ||||
| b From Matsumoto et al. (2001) | ||||
| c See text for details about the adopted spectral model | ||||
| d pn/MOS count rates | ||||
3 X-ray light curve
Table 2 shows the long time scale flux variability of M82 X-1 from XMM and Chandra data. Measurements from RXTE are not reported because it does not have imaging capabilities and contamination from the host galaxy and nearby point sources may significantly affect the count rate. For the XMM observations the fluxes are those of the best fit models of Table 1, avaraged over the three EPIC instruments. For the Chandra HRC–I observations, the fluxes are calculated using the web interface to PIMMS (v. 3.6c). We adopt a simplified MEKAL and MCD+PL model with two different absorbing columns and approximate the MEKAL/MCD component with a Bremsstrahlung/Blackbody at the same temperature. The Chandra fluxes are probably underestimated because the shape of the MCD and blackbody spectra start to differ significantly below 0.5 keV.
The highest recorded flux emitted by M82 X-1 ( erg cm-2 s-1) corresponds to a luminosity erg s-1 ( Mpc; Sakai & Madore 1999). Making the usual assumption that, at maximum, the source emits at the Eddington limit, we can derive a rough estimate of the BH mass, .
4 Timing analysis
4.1 XMM-Newton data
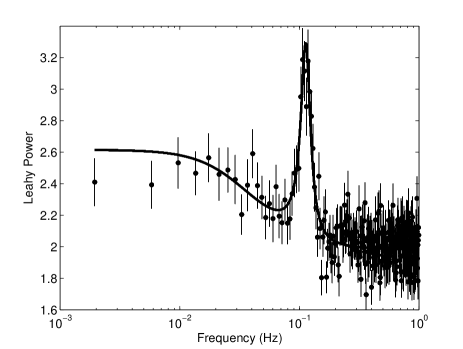
For the timing analysis of the 2004 data we avoided the interval with high background radiation and limited the extraction to the longest (nearly) uninterrupted segment of data (66 ks) free from solar flares with count rate higher than 30 count s-1. To minimize galactic contamination, source counts were extracted from a circular region of 8′′ radius and at energies 2 keV. We produced a light curve from pn+MOS data with a time binning of 0.5 s. A few gaps of typical duration of 100 s were present in the light curve and were filled with a Poissonian realization around the mean value of counts before and after the gap. We produced a power spectrum (normalized after Leahy et al. 1983) from the resulting light curve and rebinned it by a factor of 256 reaching a frequency resolution of 3.9 mHz (see Figure 4). A rather strong QPO peak is evident in the figure. We fitted the power spectrum with a model consisting of a constant (for the Poissonian level) plus two Lorentzian components (see Belloni et al. 2002): one zero-centered for the broad band-limited noise and one for the QPO peak. The characteristic frequency for the band-limited noise component (see Belloni et al. 2002 for a definition) is 39.48.6 mHz and its integrated fractional rms is 22% (after subtracting the contribution of the host galaxy). The parameters of the QPO can be seen in Table 3. The quality value , defined as the ratio of the centroid frequency over the FWHM of the QPO, is 4.30.5. We repeated the analysis in two separate energy bands, 2-4 keV and 4-10 keV. The fractional rms of the QPO in these bands resulted to be 13.8% and 23.9% respectively.
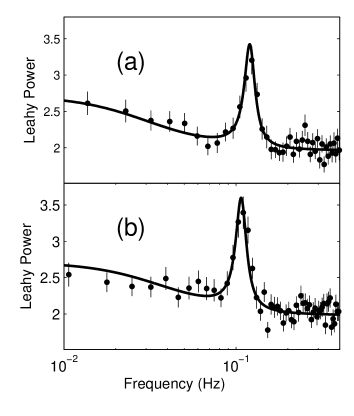
In order to investigate the possible variability of the QPO during the observation, we produced a spectrogram, by aligning power spectra obtained from consecutive stretches of data 2048 seconds long. The spectrogram is shown in Figure 5. For display purposes, in the spectrogram each pixel is smoothed as the bilinear interpolation of the values at its vertices. A trend towards lower QPO frequencies is apparent, correlated with the source count rate (top panel). In order to quantify the decrease in centroid frequency, we divided the 66 ks interval in two segments of 33 ks each and repeated the power spectral analysis described above. The two resulting power spectra are shown in Figure 6. A fit with the same model used for the total power spectrum confirms that the centroid frequency of the QPO decreased by 10.84.0% (see Table 3).
| Parameter | Total observation | First half | Second half |
|---|---|---|---|
| (mHz) | 1132 | 1203 | 1074 |
| 263 | 214 | 193 | |
| Frac % rms | 18.31.0 | 17.51.1 | 17.31.1 |
| Signif. () | 8.9 | 8.3 | 8.2 |
In Galactic BHCs the frequency of some QPOs is correlated with certain spectral parameters, in particular with the power law spectral index (see e.g. the QPO frequency- relation in GRS 1915+105; Vignarca et al. 2003). We then analyzed the spectra of M82 X-1 in the two 33 ks intervals after filtering for solar flares, adopting the best fitting model reported in Table 1. The spectral analysis does not show any evidence of variability in the PL spectral index in the two intervals.
4.2 RXTE data
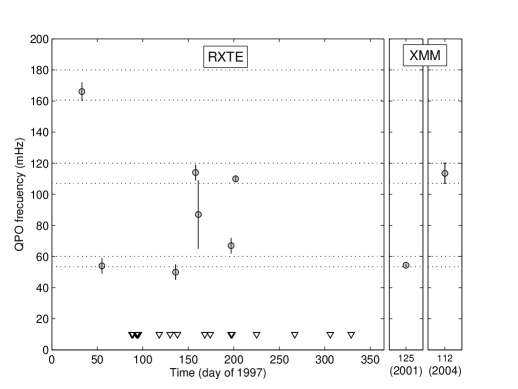
In order to investigate the variability of the QPO frequency on longer time scales, we extracted from the RXTE public archive all 30 public observations of M82, spanning over the year 1997. For each observation, we accumulated PCA light curves in the channel range 0-35, corresponding to 2-13 keV, with a 0.5 s bin size and produced power spectra in the same way as for the XMM data. We detected a significant QPO in seven observations, including the three reported by Strohmayer & Mushotzky (2003) and Fiorito & Titarchuk (2004). These detections are summarized in Table 4 and a timing history of their centroid frequencies is shown in Figure 7, where also the XMM detections are indicated. Although the frequencies are variable, they are roughly consistent with three groups in harmonic 1:2:3 ratio, as recently suggested by Fiorito & Titarchuk (2004). In order to calculate the significance of such an harmonic relation we did a numerical simulation and found the nine QPO frequencies (the seven from RXTE data plus the two from XMM) to be consistent at 2.8 with being harmonics of a fundamental frequency of 54.9 Hz. However, this is not sufficient to completely rule out that such a distributions occurs by chance and then we did not explore further the consequences of this result. More detections are clearly needed in order to address this issue.
| ObsID | Date | Exp. (s) | QPO (mHz) | |
|---|---|---|---|---|
| 20303-02-01-00 | 1997 Feb 02 | 3709 | 1666 | 6.8 |
| 20303-02-02-00 | 1997 Feb 24 | 3616 | 545 | 5.3 |
| 20303-02-03-00 | 1997 May 16 | 3312 | 505 | 6.0 |
| 20303-04-04-00 | 1997 Jun 07 | 3872 | 1145 | 5.8 |
| 20303-04-05-00 | 1997 Jun 10 | 2848 | 8722 | 4.4 |
| 20303-08-07-00 | 1997 Jul 16 | 3127 | 675 | 6.5 |
| 20303-02-04-00 | 1997 Jul 21 | 2896 | 1102 | 4.3 |
5 Discussion
5.1 Energy spectra
M82 X-1 is one of the best studied ULXs. It suffers from huge contamination in the soft X-rays from the diffuse emission of the host galaxy, the starburst prototype M82 (Origlia et al., 2004). Despite the care in subtracting the contribution of this emission, a residual contamination is present in the spectra. We modelled this emission with a 3-MEKAL model with different absorbing columns. The third MEKAL component at high temperature can account for the He-like Fe excess emission in the spectrum, suggesting that it may originate from the diffuse emission in M82 and not from the ULX. The upper limit to the flux of a line at keV in the 2001 XMM observation is consistent with the line flux measured in the 2004 XMM observation. Since in 2001 the source count rate was 50% higher, it might have been difficult to detect a line with a flux comparable to that of the 2004 observation. This result appears to be consistent with the absence of line flux variability and then with a galactic origin. However, it should be noted that the very high column density of the third MEKAL component may represent a problem for this interpretation, although absorption columns as high as cm-2 are reported in not-dissimilar galaxies (Pietsch et al., 2001).
The HRI instrument on board Chandra allowed Matsumoto et al. (2001) to resolve the central part of the galaxy, revealing the presence of a number of point sources in addition to M82 X-1 (the Chandra source CXOM82 J095550.2+694047, labelled source 7 by Matsumoto et al. 2001). A total of 9 sources are present in a field of centered on the galaxy. Most of these sources are rather close to M82 X-1, below the resolving power of the XMM EPIC cameras. For this reason, as mentioned in §2, we subtracted from the spectral extraction region circular patches (5′′) in coincidence with the position of the Chandra sources. Although we are aware that for XMM this is not as effective as for Chandra (because a region of 5′′ corresponds to a XMM encircled energy fraction of about 30-50%), this appears to be a reasonable compromise between minimizing the contamination from these sources and preserving the counting statistics of M82 X-1. This procedure could not be adopted to eliminate the contribution from the three nearest sources to M82 X-1 (4, 5 and 6 in Matsumoto et al. 2001). In particular, source 5 is highly variable. In the Chandra observation of October 1999 the count rate of this source was only 30% of that of M82 X-1. Later, the former decreased by an order of magnitude while the latter increased by a factor 7. Therefore, while sources 4 and 6 are roughly constant and weak with respect to M82 X-1, significant contamination from source 5 can not be ruled out.
A number of ULXs show very soft spectral components well fitted by a MCD model, representing emission from an accretion disk. Our best fit includes a soft MCD component with temperature =0.18 keV. A plot of the contours for vs. normalisation of the MCD component shows that the temperature is well constrained while, within 3, the normalization varies between and (XSPEC units; best fit value 1745). Although this is a large variation, the lower bound makes the detection of the MCD component quite robust. Adding this component results in a statistical improvement of the fit. However, although a 3-MEKAL model with different absorbing columns offers a fair representation of the starbust diffuse emission, it is not possible to rule out completely a residual contamination at very soft energies from the host galaxy. Under the assumption that the softest emission is entirely due to an accretion disk, the temperature of the MCD fit () can be used to estimate the BH mass. We note that such an interpretation in terms of a standard accretion disk does not encounter the severe inconsistencies that are found when a similar hypothesis is applied to the soft excess in AGNs (see Gierliński & Done 2004). Assuming that represents an estimate of the maximum temperature of a standard accretion disk, it is , with (see Zampieri et al. 2004). If the disk terminates at the innermost stable circular orbit of a Schwarzschild BH, the expression for the BH mass then becomes: , where is a color correction factor (Shimura & Takahara, 1995; Zampieri, Turolla & Szuszkiewicz, 2001). Assuming Eddington limited accretion, the BH mass is , roughly in agreement with the value inferred from the X-ray flux.
5.2 Timing
M82 X-1 is at present the only ULX where a QPO has been discovered. There are a total of 9 detections, two of which in the XMM data and seven in the RXTE data, with frequencies in the range 50-170 mHz. An important issue is of course the possible identification of this QPO with one of the QPO types observed in the X-ray light curves of stellar-mass BHCs. In the following we will summarize the main properties of the QPO in M82 X-1, and discuss its similarities and differences with the QPOs observed in BHCs.
-
•
The lowest and highest observed frequencies are mHz and respectively (see Figure 7).
-
•
The frequency distribution over this range is suggestive of a harmonic 1:2:3 ratio between them.
-
•
In the 2004 XMM observation the frequency is observed to vary by a factor of 10% in less than one day.
-
•
The QPO peak has a quality value higher than 4 (up to 6 in one case).
-
•
It shows a high fractional rms (up to 18%).
-
•
The underlying band limited noise is strong (fractional rms 22%) and has a characteristic frequency comparable to the QPO frequency.
-
•
The integrated fractional rms of the QPO above 4 keV is higher than below that energy.
Let us compare now all these properties with those of the various types of QPOs observed in BHCs.
-
•
Very-low frequency QPOs. An association of the QPO in M82 X-1 with the very low frequency ( Hz) “heart-beat” QPOs observed in GRS 1915+105 is unlikely as their frequency is lower. This, assuming an inverse scaling with the black-hole mass, would imply a very low (solar) mass black hole in M82 X-1, which is not in agreement with the spectral evidences.
-
•
High-frequency QPOs. The observed short-time scale variability seems to exclude an association with the high-frequency “hecto-Hertz” QPOs observed in BHCs, since the latter have been detected at rather stable frequencies. However, it is worth noticing that, assuming a scaling factor between the two phenomena, the mHz variation of the centroid frequency on a time scale of 30 ks observed in M82 X-1 would correspond to a Hz variation on a time scale of 30 s in a 10 solar mass BHC. Such a short time scale variability is impossible to detect in BHCs with the present instrumentation. On the other hand, the presence of a strong underlying band limited noise, with a characteristic frequency comparable to the QPO frequency, is clearly at variance with the high-frequency ”hecto-Hertz”QPOs observed in BHCs. Furthermore, the rms amplitude of the QPO itself in M82 X-1 is roughly an order of magnitude bigger than that of the ”hecto-Hertz” QPOs in BHCs, thus making the association very unlikely. For the sake of completeness we stress that the detection of the QPO at 166 mHz reported in this paper lowers the upper limit for the mass of the black hole in M82 X-1 (assuming that this frequency is associated with the Keplerian frequency at the innermost circular orbit around a Schwarzschild black hole) to .
-
•
Low-frequency QPOs. Three main types of low-frequency QPOs are observed in BHCs (see Casella, Belloni & Stella 2005). In two of them, the type-A and the type-B QPOs, the peak appears always at frequencies near 8 and 6 Hz respectively. Moreover, they are both characterized by a weak (a few %) underlying red noise component. These properties make an association with the variable, strong QPO observed in M82 X-1 unlikely. In the case of type-A QPOs, its low coherence and amplitude make the association even less likely.
The properties of the QPO in M82 X-1 are on the contrary reminiscent of those of the third type of BHCs low-frequency QPO, the type C, whose characteristic frequencies vary in the range 0.1-15 Hz. The similarities in fractional rms, variability, quality value, and underlying noise strongly suggest an association between the two features. Furthermore, in the 2004 XMM observation there is evidence for a positive correlation of the QPO frequency with the count-rate, and a similar correlation is often observed in type-C QPOs. However, during the 2001 XMM observation (when the QPO was detected at a lower frequency) the count rate was higher than during the 2004 observation. Since the count-rate vs. frequency correlation in BHCs is “outburst dependent” (which means that during different outburst a source can show similar frequencies at different count-rates) no conclusion can be derived from the observed phenomenology in M82 X-1. No information on the count-rate variability could be obtained from the RXTE observations, given the lack of imaging capabilities of the satellite.
Assuming that the QPO detected in M82 X-1 is a type-C QPO, and scaling the frequency inversely to the BH mass, the observed frequency range (from 50 to 166 mHz) would yield anywhere in the range 10-1000 . However, type-C QPOs are observed in BHCs throughout the whole Hard-Intermediate State (see Homan & Belloni 2005), and their frequency is known to decrease with the hardness of the energy spectrum. At the lowest observed frequencies, the spectrum is hard and there is often no evidence for the presence of a soft thermal component. As the contribution from a disk appears and increases, the QPO frequency also increases. The XMM spectra of both observations in which a QPO has been detected in M82 X-1 show possible evidence for a disk contribution (see before). To the extent that the two phenomena can be compared, the presence of a soft component would exclude that the type-C QPO in M82 X-1 is in the lowest frequency range, increasing the lower limit for .
6 Conclusions
In this paper we reported a complete analysis of XMM-Newton and RXTE observations of the superluminal X-ray source M82 X-1. The similarities in fractional rms, variability, quality value, and underlying noise strongly suggest an association between the QPO in M82 X-1 and the low-frequency, type-C QPOs observed in BHCs. The combined spectral and timing analysis allows us for the first time to put strong constrains to the mass of the central black hole in this source, yielding to a value between a few tens to one thousand solar masses.
Acknowledgments
We thank an anonymous referee for valuable comments. This work has been partially supported by the Italian Ministry for Education, University and Research (MIUR) under grants PRIN-2002-027145 and PRIN-2003-027534_004 and by INAF-PRIN grant.
References
- Belloni et al. (1997) Belloni, T., et al., 1997, ApJ, 488, L109
- Belloni et al. (2000) Belloni, T., et al., 2000, A&A, 355, 271
- Belloni et al. (2002) Belloni, T., et al., 2002, ApJ, 572, 392
- Casella, Belloni & Stella (2005) Casella, P., Belloni, T.,& Stella, L., 2005, ApJ, 629, 403
- Colbert & Ptak (2002) Colbert, E.J.M., & Ptak, A.F., 2002, ApJS, 143, 25
- Colbert & Miller (2004) Colbert, E.J.M., & Miller, M.C., 2004 (astro-ph/0402677)
- Cropper et al. (2004) Cropper, M., et al., 2004, MNRAS, 349, 39
- Fabbiano (1989) Fabbiano, G., 1989, ARAA, 27, 87
- Fabbiano et al. (2003) Fabbiano, G., et al. 2003, ApJL, 584, L5
- Fiorito & Titarchuk (2004) Fiorito, R., Titarchuk, L., 2004, ApJL, 614, L113
- Gierliński & Done (2004) Gierliński, M. & Done, C., 2004, MNRAS, 349, 7
- Homan et al. (2001) Homan J., et al., 2001, ApJS, 132, 377
- Homan & Belloni (2005) Homan J., & Belloni, T., 2005, to appear in Proc. of “From X-ray binaries to quasars: Black hole accretion on all mass scales”, (Amsterdam, July 2004), eds. T. Maccarone, R. Fender, L. Ho
- Kaaret et al. (2001) Kaaret, P., Prestwich, A.H., Zezas, A., Murray, S.S., Kim, D.W., Kilgard, R.E., Schlegel, E.M., Ward, M.J., 2001, MNRAS, 321, L29
- Kaaret et al. (2003) Kaaret, P., et al., 2003, Science, 299, 365
- King et al. (2001) King, A.R., et al., 2001, ApJ, 552, L109
- Kong et al. (2005) Kong, A.K.H., Rupen, M.P., Sjouwerman, L.O. & Di Stefano R. 2005, in Proceedings of the XXII Texas Symposium on Relativistic Astrophysics, Stanford University, in press (astro-ph/0503465)
- Leahy et al. (1983) Leahy, D.A., Darbro , W., Elsner, R.F., Weisskopf, M.C., Kahn, S., Sutherland, P.G. & Grindlay, J.E., 1983, ApJ, 266, 160
- Liu & Bregman (2005) Liu, J.-F. & Bregman, J.N. 2005, ApJS, 157, 59
- Liu et al. (2005) Liu, J.-F., Bregman, J.N., Seitzer, P. & Irwin, J. 2005, AJ, submitted (astro-ph/0501310)
- Matsumoto et al. (2001) Matsumoto, H., Tsuru, T.G., Koyama, K., Awaki, H., Canizares, C.R., Kawai, N., Matsushita, S., Kawabe, R., 2001, ApJL, 547, L25
- Miller et al. (2003) Miller, J.M., et al., 2003, ApJ, 585, L37
- Miller et al. (2004) Miller, J.M., et al., 2004, ApJ, 607, 931
- Morgan et al. (1997) Morgan, E.H., et al., 1997, ApJ, 482, 993
- Origlia et al. (2004) Origlia, L., Ranalli, P., Comastri, A., Maiolino, R., 2004, ApJ
- Pakull & Mirioni (2002) Pakull, M.W., & Mirioni, L., 2002, ESA SP-488 (astro-ph/0202488)
- Pietsch et al. (2001) Pietsch, W., et al., 2001, A&A, 365, 174
- Remillard et al. (2002a) Remillard, R.A., et al., 2002, ApJ, 564, 962
- Remillard et al. (2002b) Remillard, R.A., et al., 2002b, ApJ, 580, 1030
- Sakai & Madore (1999) Sakai, S. & Madore, B F. 1999, ApJ, 526, 599
- Shimura & Takahara (1995) Shimura, T., & Takahara, F. 1995, ApJ, 445, 780
- Stevens et al. (2003) Stevens, I.R., Read, A.M., Bravo-Guerrero, J., 2003, MNRAS, 343, L47
- Strohmayer (2001a) Strohmayer, T.E., 2001a, ApJ, 552, L49
- Strohmayer (2001b) Strohmayer, T.E., 2001b, ApJ, 554, L169
- Strohmayer & Mushotzky (2003) Strohmayer, T.E., Mushotzky, R.F., 2003, ApJL, 586, L61
- Swartz et al. (2004) Swartz, D.A., Ghosh, K.K., Tennant, A.F. & Wu, K. 2004, ApJS, 154, 519
- Vignarca et al. (2003) Vignarca, F., Migliari, S., Belloni, T., Psaltis, D., van der Klis, M., 2003, A&A, 397, 729
- van der Klis (2005) van der Klis, M., 2005, in “Compact Stellar X-Ray Sources”, in press (astro-ph/0410551)
- Zampieri, Turolla & Szuszkiewicz (2001) Zampieri, L., Turolla, R., & Szuszkiewicz, E. 2001, MNRAS, 325, 1266
- Zampieri et al. (2004) Zampieri, L., et al. 2004, ApJ, 603, 523