Observational Constraints on Variable Chaplygin Gas
Zong-Kuan Guob
***e-mail address: guozk@itp.ac.cn
and Yuan-Zhong Zhanga,b
aCCAST (World Lab.), P.O. Box 8730, Beijing 100080, China
bInstitute of Theoretical Physics, Chinese Academy of
Sciences, P.O. Box 2735, Beijing 100080, China
Abstract
We investigate observational constraints on the variable Chaplygin gas model from the gold sample of type Ia supernova data and the recent measurements of the X-ray gas mass fractions in galaxy clusters. Combining these databases, we obtain a tight constraint on the two model parameters. Our results indicate that the original Chaplygin gas model is ruled out by the data at 99.7% confidence level.
1 Introduction
Recent observations of type Ia supernovae (SNe Ia) suggest that the expansion of the universe is accelerating and that two-thirds of the total energy density exists in a dark energy component with negative pressure [1]. In addition, measurements of the cosmic microwave background (CMB) [2] and the galaxy power spectrum [3] also indicate the existence of the dark energy. The simplest candidate for the dark energy is a cosmological constant , which has pressure . Specifically, a reliable model should explain why the present amount of the dark energy is so small compared with the fundamental scale (fine-tuning problem) and why it is comparable with the critical density today (coincidence problem). The cosmological constant suffers from these problems. One possible approach to construct a viable model for dark energy is to associate it with a slowly evolving and spatially homogeneous scalar field , called “quintessence” [4, 5]. Such a model for a broad class of potentials can give the energy density converging to its present value for a wide set of initial conditions in the past and possess tracker behavior.
Recently, the Chaplygin gas model was proposed as an alternative to the cosmological constant in explaining the accelerating universe [6]. The Chaplygin gas is characterized by an exotic equation of state , where is a positive constant. An attractive feature of the model is that it can naturally explain both dark energy and dark matter. The reason is that the Chaplygin gas behaves as dust-like matter at early stage and as a cosmological constant at later stage. Some possible motivations for this model from the field theory point of view are discussed in Refs. [7]. The Chaplygin gas appears as an effective fluid associated with -branes [8] and can also be derived from the Born-Infeld action [9]. An interesting range of models was found to be consistent with SN Ia data [10], CMB experiments [11] and other observational data [12]. The Chaplygin gas model has been extensively studied in the literature [13].
However, the Chaplygin gas model produces oscillations or exponential blowup of the matter power spectrum that are inconsistent with observation [14]. In Ref. [15], we considered a variable Chaplygin gas (VCG) model and showed that it interpolates between a universe dominated by dust and a quiessence-dominated one described by the constant equation of state. Furthermore, we showed that the model corresponds to a Born-Infeld tachyon action [15]. Recently, the model parameters were constrained using the location of peaks of the CMB spectrum and SN Ia data [16]. In this paper we consider observational constraints on the VCG model from the gold sample of 157 SN Ia data and the recent measurements of the X-ray gas mass fractions in 26 galaxy clusters. We perform a combined analysis of these databases and obtain the confidence region on the two parameters. Our results indicate that the original Chaplygin gas is ruled out at confidence level.
2 Variable Chaplygin Gas
Let us now consider the VCG characterized by the equation of state
| (1) |
where is a positive function of the cosmological scale factor . This assumption is reasonable since is related to the scalar potential if we take the Chaplygin gas as a Born-Infeld tachyon field [9, 15]. In a spatially flat Friedmann-Robertson-Walker (FRW) universe, the energy conservation equation is
| (2) |
By inserting Eq. (1) into the above equation, one finds that the VCG density evolves as
| (3) |
where is an integration constant. Given a function , Eq. (3) allows us to obtain a solution . We assume is of the form , where and are constants. This ansatz has the following important features: a) the VCG model with reduces to the original scenario, b) we will see that the VCG behaves as a quiessence rather than a cosmological constant at late times and c) the function can be calculated analytically. Then from Eq. (3) it follows that
| (4) |
Note that corresponds to the original Chaplygin gas scenario, in which the Chaplygin gas behaves initially as dust-like matter and later as a cosmological constant [6]. However, Eq. (4) shows that, in the VCG scenario, it interpolates between a dust-dominated phase and a quiessence-dominated phase described by the constant equation of state [17]. From Eq. (4) we get the present value of the energy density of the VCG
| (5) |
where the present value of the scale factor is normalized to unity, i.e., . Defining , Eq. (4) takes the form
| (6) |
where is redshift. In the spatially flat FRW metric the Friedmann equation can be written as
| (7) |
where is the Hubble parameter, is the gravitational coupling and is the energy density of the baronic matter. Substituting Eq. (6) into the Friedmann equation (7) gives
| (8) | |||||
where is the present value of the Hubble parameter and is the density parameter of the baryonic matter component. Then it is straightforward to show that the luminosity distance and the angular diameter distance in the spatially flat FRW universe are respectively given by
| (9) | |||||
| (10) |
3 Supernova Ia Constraints
Let us now consider constraints on the VCG model from the gold sample of 157 SN Ia data compiled in Ref. [18]. The parameters in the model are determined by minimizing
| (11) |
where is the total uncertainty in the observation, is the observed distance modulus of SNe Ia, and is the theoretical distance modulus
| (12) |
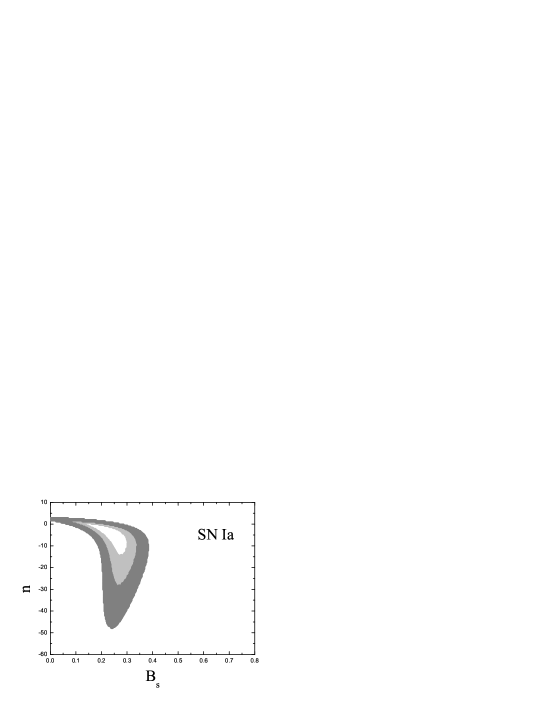
To determine the likelihood of the parameters and , we marginalize the likelihood function over and . We adopt Gaussian priors such that from the Hubble Space Telescope Key Project [19] and from the observed abundances of light elements together with primordial nucleosynthesis [20]. The results of our analysis for the VCG model are displayed in Fig. 2. We show 68.3%, 95.4% and 99.7% confidence level contours in the (, ) plane. The best-fit model parameters and marginalized error bars are and with . The results show that the two parameter and are highly degenerate. It is interesting to note that the dark energy component with is favored, which allows the possibility that the dark energy density in increasing with time.
4 Constraints from the X-ray Gas Mass Fraction of Galaxy Clusters
The matter content of rich clusters of galaxies is thought to provide a fair sample of the matter content of the universe as a whole. The observed ratio of the baryonic to total mass in clusters should therefore closely match the ratio of the cosmological parameter , where and are the mean baryon and total mass densities of the universe in units of the critical density. The combination of robust measurements of the baryonic mass fraction in clusters with accurate determinations of from cosmic nucleosynthesis calculations can therefore be used to determine [21]. The measurements of the apparent redshift dependence of the baryonic mass fraction can also, in principle, be used to constrain the geometry and dark energy density of the universe [22]. The first successful application of such a test was carried out by Allen et al. using a small sample of X-ray luminous, dynamically relaxed clusters with precise mass measurements, spanning the redshift range [23] (see also [24]). Recently Allen et al. present a significant extension and obtained a tight constraint on the mean matter density and dark energy equation of state parameter. The clusters sample is significantly larger and includes 26 X-ray luminous, dynamically relaxed systems spanning the redshift range [25]. We will use this database to constraint the VCG model. To determine the confidence region of the model parameters, we use the following function
| (13) |
where is the measured X-ray gas mass fraction with the defaut standard cold dark matter (SCDM) cosmology, is the symmetric root mean square errors, and is the model function
| (14) |
where the bias factor [25] is a parameter motivated by gas dynamical simulations, which suggest that the baryon fraction in clusters is slightly depressed with respect to the universe as a whole, and the effective matter density parameter is
| (15) |
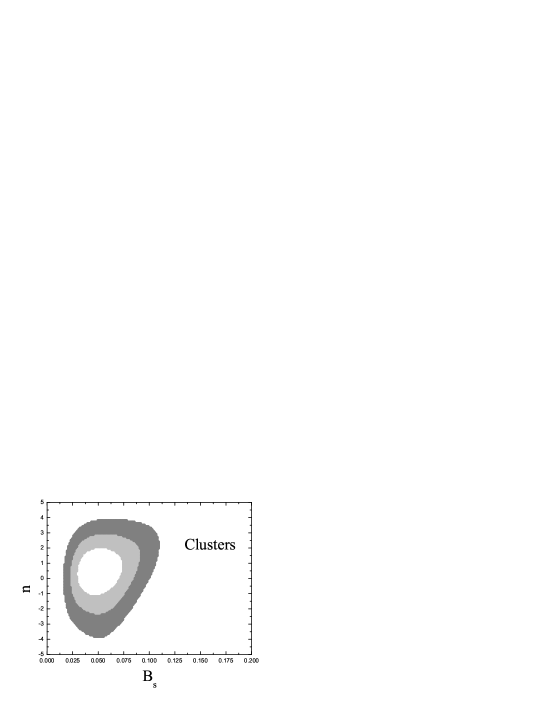
Adopting Gaussian priors such that and , the 68.3%, 95.4% and 99.7% confidence level contours in the (, ) plane are shown in Fig. 2. The best-fit model parameters and marginalized error bars are and with . The results favor the original Chaplygin gas model with .
5 Combined Analysis, Conclusions and Discussions
Let us now consider a combined analysis of the constraints from the gold sample of SN Ia data and the measurements of the X-ray gas mass fraction in galaxy clusters. The fit is done by minimizing the following function
| (16) |
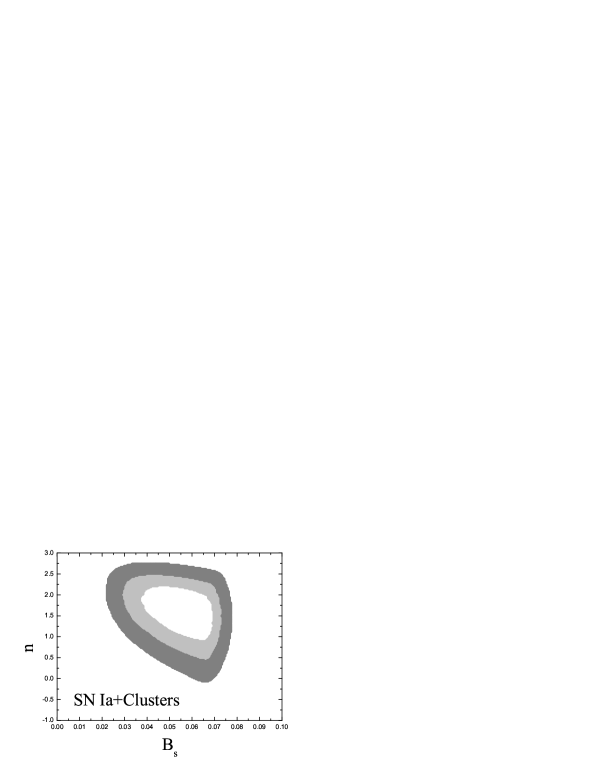
Fig. 3 shows the constraints on and obtained from the analysis of the combined the SN Ia and the X-ray gas mass fraction data set. We see that SNIa data set provides a remarkably tight constraint in the (, ) plane, with best fit values ( error bar) and ( error bar) with . We find that the original Chaplygin gas model is ruled out by the data at 99.7% confidence level. Fig. 5 and Fig. 5 show the probability distribution for and , respectively, marginalized over and in the spatially flat FRW universe.


The VCG model, which plays the role of both dark energy and dark matter in terms of a single component, deserves to explore its various observational effects [16]. In this paper we have focused our attention on the gold sample of SN Ia data and the recent measurements of the X-ray gas mass fractions in galaxy clusters. Adopting simple Gaussian priors of and , we have obtained stringent constraints on the two parameters, and , which describe the effective density parameter of the dark matter component and the effective equation of state of the dark energy component, respectively. The combined analysis of these databases shows that the original Chaplygin gas model is ruled out and the universe tends to be quiessence-dominated rather than phantom-dominated at confidence level in the VCG scenario. It would be interesting to investigate the evolution of density perturbations in this VCG model.
Acknowledgements
We are grateful to Zong-Hong Zhu and Adam G. Riess for helpful discussions. We would like to thank Robert W. Schmidt for sending us their compilation of the X-ray mass fraction data. This project was in part supported by National Basic Research Program of China under Grant No. 2003CB716300 and by NNSFC under Grant No. 90403032.
References
- [1] A.G. Riess et al., Astron. J. 116 (1998) 1009; S. Perlmutter et al., Astrophys. J. 517 (1999) 565.
- [2] D.N. Spergel et al., Astrophys. J. Suppl. 148 (2003) 175.
- [3] M. Tegmark et al., Phys. Rev. D69 (2004) 103501.
- [4] B. Ratra and P.J.E. Peebles, Phys. Rev. D37 (1988) 3406; C. Wetterich, Nucl. Phys. B302 (1988) 668.
- [5] I. Zlatev, L.M. Wang and P.J. Steinhardt, Phys. Rev. Lett. 82 (1999) 896; P.J. Steinhardt, L. Wang and I. Zlatev, Phys. Rev. D59 (1999) 123504.
- [6] A. Kamenshchik, U. Moschella and V. Pasquier, Phys. Lett. B511 (2001) 265; V. Gorini, A. Kamenshchik and U. Moschella, Phys. Rev. D67 (2003) 063509.
- [7] M.C. Bento, O. Bertolami and A.A. Sen, Phys. Rev. D66 (2002) 043507; N. Bilic, G.B. Tupper and R.D. Viollier, Phys. Lett. B535 (2002) 17; N. Bilic, G.B. Tupper and R.D. Viollier, astro-ph/0207423.
- [8] M. Bordemann and J. Hoppe, Phys. Lett. B317 (1993) 315; J.C. Fabris, S.V.B. Gonsalves and P.E. de Souza, Gen. Rel. Grav. 34 (2002) 53.
- [9] M.C. Bento, O. Bertolami and A.A. Sen, Phys. Lett. B575 (2003) 172.
- [10] M. Makler, S.Q. de Oliveira and I. Waga, Phys. Lett. B555 (2003) 1; J.C. Fabris, S.V.B. Goncalves and P.E. de Souza, astro-ph/0207430; Y. Gong and C.K. Duan, Mon. Not. Roy. Astron. Soc. 352 (2004) 847; Y. Gong, JCAP 0503 (2005) 007.
- [11] M.C. Bento, O. Bertolami and A.A. Sen, Phys. Rev. D67 (2003) 063003; L. Amendola, I. Waga and F. Finelli, astro-ph/0509099.
- [12] A. Dev, J.S. Alcaniz and D. Jain, Phys. Rev. D67 (2003) 023515; R. Bean, O. Dore, Phys. Rev. D68 (2003) 023515; Z.H. Zhu, Astron. Astrophys. 423 (2004) 421.
- [13] P.F. Gonzalez-Diaz, Phys.Lett. B562 (2003) 1; L.P. Chimento, Phys.Rev. D69 (2004) 123517; T. Barreiro, A.A. Sen, Phys. Rev. D70 (2004) 124013; L.P. Chimento and R. Lazkoz, Phys. Lett. B615 (2005) 146; U. Debnath, A. Banerjee and S. Chakraborty, Class. Quant. Grav. 21 (2004) 5609; W. Zimdahl and J.C. Fabris, gr-qc/0504088.
- [14] H. Sandvik, M. Tegmark, M. Zaldarriaga and I. Waga, Phys. Rev. D69 (2004) 123524.
- [15] Z.K. Guo and Y.Z. Zhang, astro-ph/0506091.
- [16] G. Sethi, S.K. Singh, P. Kumar, D. Jain and A. Dev, astro-ph/0508491.
- [17] Z.K. Guo, N. Ohta and Y.Z. Zhang, Phys. Rev. D72 (2005) 023504.
- [18] A.G. Riess et al., Astrophys. J. 607 (2004) 665.
- [19] W. Freedman et al., Astrophys. J. 553 (2001) 47.
- [20] D. Kirkman, et al., Astrophys. J. Suppl. 149 (2003) 1.
- [21] S.D.M. White and C.S. Frenk, Astrophys. J. 379 (1991) 52.
- [22] S. Sasaki, Publ. Astron. Soc. Jpn., 48 (1996) L119; U. Pen, New Astronomy 2 (1997) 309.
- [23] S.W. Allen, et al., Mon. Not. Roy. Astron. Soc. 334 (2002) L11; S.W. Allen, et al., Mon. Not. Roy. Astron. Soc. 342 (2003) 287.
- [24] Z.H. Zhu, M. Fujimoto and X.T He, Astron. Astrophys. 417 (2004) 833; Z.H. Zhu and M. Fujimoto, Astrophys. J. 602 (2004) 12; Z.H. Zhu, M. Fujimoto and X.T He, Astrophys.J. 603 (2004) 365; Z. Chang, F.Q. Wu and X. Zhang, astro-ph/0509531.
- [25] S.W. Allen, et al., Mon. Not. Roy. Astron. Soc. 353 (2004) 457.