Cool Gas and Massive Stars - the Nuclear Ring in M100
Abstract
The SAURON integral field spectrograph was used to observe the central area of the barred spiral galaxy M100 (NGC 4321). M100 contains a nuclear ring of star formation, fueled by gas channeled inward by the galaxy’s bar. We present maps of emission line strengths, absorption line strength indices, and the gas velocity dispersion across the field. The H emission is strongest in the ring, along two curved bar dustlanes and at the ends of the bar. The Mg b absorption line strength shows a younger population of stars within the ring as compared to the surrounding area. The gas velocity dispersion is notably smaller than elsewhere in the field both in the ring and along the leading edge of the dustlanes. Low gas dispersion is correlated spatially with the H emission. We thus see stars being formed from cold (low dispersion) gas which is being channeled inward along the dustlanes under the influence of a large bar, and accumulated into a ring near the location of the inner Lindblad resonances. This lends further strong support to the interpretation of nuclear rings in barred galaxies as resonance phenomena.
1 Introduction
The centers of many spiral galaxies show evidence of star formation (SF), often organized into a nuclear ring or pseudo-ring. Such rings are found in 20 of spiral galaxies (Knapen 2005), are thus relatively common, and almost always occur within a barred host (Buta & Combes 1996; Knapen 2005). They are sites of massive SF; Kennicutt et al. (2005) estimate that nuclear rings contribute 3-5 to the overall current SF rate in the local universe. Dynamically, nuclear rings are thought to trace the position of the inner Lindblad resonances (ILRs), where gas driven in under the influence of the large bar slows down (Lynden-Bell & Kalnajs 1972; Shlosman 1999). Because nuclear rings turn inflowing gas into stars within the central region, they will contribute to secular evolution and pseudo-bulge formation. The SF within the rings is most likely a combination of gravitational instabilities (Elmegreen 1994) and the influence of shocks and density waves (Knapen et al. 1995a, hereafter K95; Ryder, Knapen & Takamiya 2001).
M100 (NGC 4321) is a prominent, relatively face-on spiral galaxy with a moderately strong bar, at a distance of 16.1 Mpc (Ferrarese et al. 1996); at this distance 1 arcsec is equal to 70 pc. M100 hosts a well-known nuclear ring with prominent massive SF, which is located near a pair of ILRs induced by the bar (K95). A detailed analysis of the optical and NIR morphology of the circumnuclear region of M100 has been given by K95, Knapen et al. (1995b) and Ryder & Knapen (1999).
Here we present integral field spectroscopic data of the bar and circumnuclear region of M100 and derive maps of emission line intensities, gas velocity dispersions and absorption line strengths. We report a ring of relatively cold gas within the circumnuclear region, which lies exactly at the location of the H emission.
2 Observations and Analysis
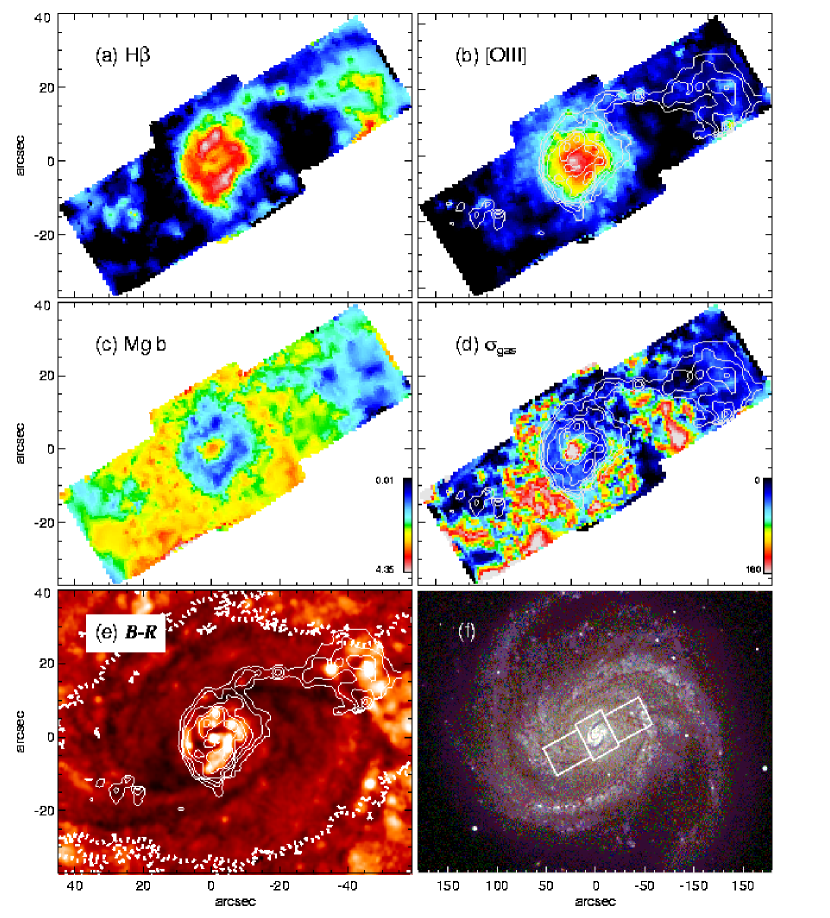
The SAURON integral field spectrograph (Bacon et al. 2001) was used on the 4.2m William Herschel Telescope (WHT) on La Palma on 2003, May 2. The field of view was 3341 arcsec2, and contains 1431 square lenses of 0.940.94 arcsec2 in size, each producing a spectrum. A further 146 lenses cover a region 1.9 arcmin from the field for simultaneous observation of the sky background. The wavelength range of 4760-5350Å is observed, which contains the stellar absorption features H, Mg b, Fe5015, and the emission lines H, [Oiii] and [NI]. The velocity resolution is 110 km s-1. To cover the complete bar and circumnuclear region of M100, three pointings were made (see Figure 1f).
The data were reduced using the specially developed XSauron software, originally described by Bacon et al. (2001). The data were bias and dark subtracted and the spectra extracted, wavelength and flux calibrated. The separate exposures were merged and mosaicked together to produce one final datacube. This was spatially binned using the Voronoi 2D binning method of Cappellari & Copin (2003) to achieve a minimum S/N across the field of 60 per angstrom for the extraction of the kinematics, and 100 for the line strength maps.
To determine the gas kinematics and emission line strengths we followed a 2-step approach (Sarzi et al. 2005): we first determined in each bin the stellar line of sight velocity distribution (LOSVD) using the Penalized Pixel Fitting Method (Cappellari & Emsellem 2004), using the spectra outside the region of the emission lines. We then fitted the full spectra using a linear combination of single age, single metallicity models from Vazdekis (1999), a 6th order polynomial to fit the continuum, and gaussians with variable widths, centers and amplitudes, all convolved with the previously determined LOSVD. In this way maps of the different absorption and emission lines, presented below, were determined.
3 Results
3.1 Intensity Maps
Figures 1a and 1b show the intensity of the emission lines H and [Oiii] over the field of view. H emission mimics the well-known H morphology (e.g., Knapen et al. 1995b) and is most prominent in the nuclear ring (broken up into hotspots), and within the Hii regions in the western field. H emission can also be seen along the two main dustlanes in the bar, as outlined in the B-R image (Fig 1e). The [Oiii] emission peaks at the center of the galaxy, and is weaker than H elsewhere while still tracing the most prominent Hii regions.
3.2 Line Indices
The method explained in Sect. 2 has enabled us to determine the absorption line indices of Fe 5015, Mg b and H (Lick system; Worthey 1994) with a systematic accuracy of about 0.1 Å (see Sarzi et al. 2005 for detailed simulations to establish the accuracy of the absorption - emission line separation). The Mg b line absorption line strength (Fig. 1c) increases for older and more metal rich stars. We find a significantly lower value coinciding spatially with the H emission, in both the nuclear ring and along the bar. From the [Oiii]/H values found for this galaxy, the H emission in the ring is thought to come from photoionization by stars, which have to be sufficiently hot, i.e. young. This confirms that a young population of stars is dominates the spectrum at these locations, diluting the stellar absorption features of the older bulge stars. A more detailed analysis of the stellar populations (including the Fe 5015 and H indices) within the central regions of M100 will be presented by E. Allard et al. (in preparation, hereafter Paper II).
3.3 Gas Velocity Dispersion
The gas velocity dispersion map (Fig. 1d) shows a value of 10 km s-1 averaged over the central 5 arcsec. Barth, Ho & Sargent (2002) measured a value of the stellar velocity dispersion across a central 3.7 arcsec aperture of km s-1. From our data, we find a value averaged over the central 4 arcsec of km s-1 (Paper II). These values are consistent with SAURON results in the literature (de Zeeuw et al. 2002; Emsellem et al. 2004; Sarzi et al. 2005) for a galaxy such as M100. They will include contributions from the rapidly rising rotation curve in gas (Knapen et al. 2000 measured a circular velocity of 145 km s-1 at a radius of 2 arcsec from the nucleus from H Fabry-Pérot data) and stars (Paper II, where we find a comparable value of some 140 km s-1), as well as from the unresolved broad line emission from the LINER nucleus.
A ring of considerably lower velocity dispersion111Our quoted errors are derived from pixel to pixel variations within the field. Errors due to the determination of within individual pixels are typically a few tens of km s-1, depending on the value of and the signal strength; see Sarzi et al. (2005) for a full discussion., 8 km s-1, is seen at a distance of 7 arcsec from the center. It has a thickness of 7 arcsec, and is surrounded by a zone where 30 km s-1 (Fig. 1d). Regions of low are correlated spatially with enhanced H emission (Fig. 1d), such as the arc of material seen in the western side of the bar. An overlay of H emission on B-R (Fig. 1e), shows that the low dispersion material is offset by some 700 pc from the dark dustlanes in the bar (Sect. 4.1).
4 Discussion
4.1 Gas Inflow
Many barred galaxies show a symmetric pair of dustlanes, connecting the nuclear region with the spiral arms, and associated with shocks in the gas flow (Prendergast 1964; Athanassoula 1992). At the location of the shocks we expect strong shear, and SF will be prevented. Immediately after the shock, however, the piling up of gas allows material to cool and acquire a lower velocity dispersion, and SF can be triggered. We see this expected offset, of some 700 pc in this case, between the dustlanes and the ridges of SF, which coincides with the cold gas (Fig. 1e). Zurita et al. (2004) studied the strong bar in NGC 1530, and found that the largest velocity gradients occur at the location of the dustlanes, with massive SF along the dustlanes offset by some 900 pc.
4.2 Creation of a Nuclear Ring
Rings are thought to be the result of radial gas inflow (e.g., Schwarz 1979; K95; Heller & Shlosman 1996). Material gathers in rings where the radial flow of gas approaches an important resonance (set up by the mass distribution of the bar). The nuclear ring emits strongly in gas emission lines, confirming the existence of enhanced massive SF. K95 modeled the gas flow in M100 using a self consistent disk of gas and stars embedded within a halo. Using nonlinear orbital analysis, a double ILR was confirmed to lie at the location of the ring. Material collected at the ILR(s) experiences no net torque from the bar pattern, and so the velocity dispersion of gas there will not increase quickly with time, as may be the case outside the ring. The fact that we see a circular region of lower dispersion, relatively cold gas confirms this picture. Massive stars form in the ring which implies that the gas in the ring is constantly being replenished.
4.3 Star Formation in the Ring
SF is generally thought to occur when the gas density of the ISM exceeds the Toomre (1964) criterion for gravitational stability. Within the ring, the density will continue to increase with the accumulation of gas into the region. The ring will eventually become unstable to collapse and SF is triggered (Elmegreen 1994), probably orchestrated by the dynamics of the ring and bar (K95; Knapen et al. 1995b; Ryder et al. 2001). The gas density within the ring of cold gas in M100 will be greatest at the contact points between the ring and the dustlanes, where gas flows into the region. We expect the distribution of the SF and the youngest stars to be clumpy, and the intensity to be strongest at these contact points. This is in fact the case, as can be seen in Fig. 1b (see also in Knapen et al. 1995b). H emission is an indicator of very young stars (107 yrs), and Mg b of an older population. The absorption line index of Mg b shows a complete ring, as opposed to clumpy hotspots. This is probably because the stars born from the cold gas diffuse slowly out to fill the ring (K95). The contact points are found at positions (-2,7) and (-2,-9) in Fig. 1c (offset RA and dec, in arcsec). The average Mg b index across both contact points (over apertures of 3 arcsec radius) is 0.980.18. We measure an average Mg b index across the rest of the ring of 1.340.1. These numbers confirm that indeed, as Fig. 1c suggests, the contact points have slightly lower Mg b than the rest of the ring (a 1.8 effect), which suggests a younger population at these positions. This supports the findings of Ryder et al. (2001) who found marginal evidence for an azimuthal age gradient around the ring in M100, with the youngest star forming regions found at the contact point. SF in the nuclear ring is, in conclusion, likely to sequentially triggered, with the first burst of SF triggered at the contact points, where the bar dust lanes connect to the ring.
5 Conclusions
We have obtained integral field spectroscopic data of the central region of the barred spiral galaxy M100. From these data we have derived maps of emission line intensities, line strength indices, and the gas velocity dispersion across the field. The H emission shows the well-known bright ring, broken into hotspots of emission. The [Oiii] emission is brightest at the very center of the galaxy, enhanced by LINER emission. The ring is seen as a clear drop in the Mg b index values, suggestive of the dilution of the stellar absorption features of the older bulge stars by the presence of a younger population of stars within the ring. In the gas velocity dispersion map, the ring is clearly colder than the underlying disk. Significantly lower dispersion occurs exactly where the strongest H emission occurs, both within the ring and aligned and offset from the dustlanes in the bar. The low gas dispersion suggests that cold gas flows into the area through the dustlanes, and accumulates into a ring under the influence of the ILRs. Instabilities within this gas then trigger significant massive SF. A more detailed analysis of the kinematics and stellar populations within the region will be presented in Paper II.
References
- athanassoula (1992) Athanassoula, E., 1992, MNRAS, 259, 345
- bacon (2001) Bacon, R., et al. 2001, MNRAS, 326, 23
- (3) Barth, A. J., Ho, L. C., & Sargent, W. L. W. 2002, AJ, 124, 2607
- Buta and Combes (1996) Buta, R. & Combes, F. 1996, FCPh, 17, 95
- cappellari2 (2003) Cappellari, M. & Copin, Y. 2003, MNRAS, 342, 345
- cappellari1 (2004) Cappellari, M. & Emsellem, E. 2004, PASP, 116, 138
- de zeeuw (2002) de Zeeuw, P. T., et al. 2002, MNRAS, 329, 513
- elmegreen (1994) Elmegreen, B. G. 1994, ApJ, 425, L73
- emsellem (2004) Emsellem, E., et al. 2004, MNRAS, 352, 721
- ferrarese (1996) Ferrarese, L., et al. 1996, ApJ, 464, 568
- Heller (1996) Heller, C., & Shlosman, I. 1996, ApJ, 471, 143
- kennicutt (2005) Kennicutt, R.C., Janice, C.L., Funes, J.G., Sakai, S., & Akiyama, S. 2005, ASSL 329, 187
- Knapen (2005) Knapen, J. H. 2005, A&A, 429, 141
- knapen 1995b (1995) Knapen, J. H., Beckman, J. E., Heller, C. H., Shlosman, I., & de Jong, R. S. 1995a, ApJ, 454, 623 (K95)
- knapen 1995a (1995) Knapen, J. H., Beckman, J. E., Shlosman, I., Peletier, R. F., Heller, C. H. & de Jong, R. S. 1995b, ApJ, 443, L73
- Knapen et al.(2000) (2000) Knapen, J. H., Shlosman, I., Heller, C. H., Rand, R. J., Beckman, J. E., & Rozas, M. 2000, ApJ, 528, 219
- Knapen (2004) Knapen, J. H., Stedman, S., Bramich, D. M., Folkes, S. L. & Bradley, T. R. 2004, A&A, 426, 1135
- lynden (1972) Lynden-Bell, D. & Kalnajs, A. J. 1972, MNRAS, 157, 1
- Prendergast (1964) Prendergast, K. H. 1964, Astron J, 111, 1566
- ryder (1999) Ryder, S. D. & Knapen, J. H. 1999, MNRAS, 302, L7
- ryder (2001) Ryder, S. D., Knapen, J. H. & Takamiya, M. 2001, MNRAS, 323, 663
- Schwarz 1979 (1979) Schwarz, M. P. 1979, PhD Thesis, Australian National University
- Sarzi (1999) Sarzi, M., et al. 2005, MNRAS, submitted
- Shlosman (1999) Shlosman, I. 1999, ASPC, 187, 100
- (25) Toomre, A. 1964, ApJ, 139, 1217
- vazdekis (1999) Vazdekis, A. 1999, ApJ, 513, 224
- (27) Worthey, G. 1994, ApJSS, 95, 107
- zurita (2004) Zurita, A., Relaño, M., Beckman, J. E. & Knapen, J. H. 2004, A&A, 413, 73