11email: vik@astro.yale.edu 22institutetext: Institute of Physics, Stachki 194, Rostov-on-Don, Russia
22email: nata@ip.rsu.ru 33institutetext: Earth Observation Research Center, National Space Development Agency of Japan, 1-8-10 Harurau, Chuo-ku, Tokyo 104-6023, Japan
33email: kikuchi@eorc.nasda.go.jp 44institutetext: National Astronomical Observatory, Mitaka, Tokyo 181–8588, Japan
44email: miyama@th.nao.ac.jp 55institutetext: Special Astrophysical Observatory of Russian AS, Nizhnij Arkhyz 369167, Russia
55email: moisav@sao.ru
Application of the global modal approach to spiral galaxies
We have tested the applicability of the global modal approach in the density wave theory of spiral structure for a sample of six spiral galaxies: NGC 488, NGC 628, NGC 1566, NGC 2985, NGC 3938 and NGC 6503. The galaxies demonstrate a variety of spiral patterns from the regular open and tightly wound spiral patterns to a multi-armed spiral structure. Using the observed radial distributions of the stellar velocity dispersions and the rotation curves we have constructed equilibrium models for the galactic disks in each galaxy and analyzed the dynamics of the spiral perturbations using linear global modal analysis and nonlinear hydrodynamical simulations. The theory reproduces qualitatively the observed properties of the spiral arms in the galactic disks. Namely the theory predicts observed grand-design spiral structure in the galaxy NGC 1566, the tightly-wound spirals in galaxies NGC 488 and NGC 2985, the two-armed spiral pattern with the third spiral arm in the galaxy NGC 628, and the multi-armed spiral structure in the galaxies NGC 3938 and NGC 6503. In general, more massive disks are dominated by two-armed spiral modes. Disks with lower mass, and with lower velocity dispersion are simultaneously unstable for spiral modes with different numbers of arms, which results in a more complicated pattern.
Key Words.:
Galaxies: kinematics and dynamics – Galaxies: spiral – Interstellar Medium: structure – Physical Data and Processes: Instabilities1 Introduction
During the last 60 years many efforts have been made to reveal the nature of the spiral structure in galaxies. Most researchers agree that the spiral structure is a manifestation of density variations in the galactic disks under the influence of gravity. However, opinions as to the governing mechanisms of spiral structure differ beyond this starting point. There is no consensus as to whether the spirals are a long-lived phenomenon, or are regenerated many times during the galactic evolution. C.C. Lin and his collaborators advocate long-lived spiral patterns which are the manifestation of unstable global modes (see, e.g., Bertin et al. 1989a,b). Other researchers favor short-lived or recurrent patterns which are developed through swing amplification in shearing flows or by external forcing (Goldreich & Lynden-Bell 1965; Julian & Toomre 1966; Toomre 1981). A new realization of the recurrent mechanism was recently proposed by Sellwood (2000) with further development by Fuchs (2001a,b).
Some studies demonstrate that the modal approach, and the fluid dynamical approximation qualitatively explain the dynamics of the collisionless galactic disks. Vauterin and Dejonghe (1996) performed a linear global modal analysis of a family of collisionless self-gravitating disk models. Kikuchi et al. (1997) using fluid approximation made a comparison of the linear global modal analysis with the results of Vauterin and Dejonghe (1996). Kikuchi et al. (1997) showed that the stability properties of disks described in a fluid approximation are in good qualitative and to some extent quantitative agreement with the properties of the global modes found by Vauterin and Dejonghe from the exact collisionless Boltzmann equation. However, only a direct comparison of the theoretical models with the observed properties of the spiral patterns of particular galaxies can help to make a choice in favor of one or another theory. A number of authors have undertaken such comparisons in the past (e.g., Lin et al. 1969; Roberts et al. 1975; Mishurov et al. 1979; Elmegreen & Elmegreen 1990). Typically, these studies relied on empirical estimates of the positions of the corotation and Lindblad resonances in the galactic disks using “optical tracers” in the optical images of the galaxies. A local dispersion relation was used then to calculate the spiral response under an additional assumption regarding the radial behavior of the stability parameter derived by Toomre (1964). Arbitrary assumptions made in such comparisons obviously reduce the predictive power of the theory.
Based on the recent long-slit spectroscopic observations of the disk galaxies, we use a new approach to predict theoretically the parameters of spiral structure in the galactic disks. The approach we use is based on the observational data. Measurements of the radial distribution of the stellar velocity dispersion in the galactic disks in combination with the known rotation curves provide the disk’s basic axisymmetric properties. These data uniquely determine the axisymmetric background equilibrium of the galactic disks, and can be used for the linear-, and the nonlinear analyses aimed at modeling the spiral structure.
Such an approach have been applied to model spiral structure in the galaxy NGC 1566 (Korchagin et al. 2000). The two armed spiral pattern constitutes the most unstable global mode in the disk of NGC 1566, and the theoretical surface brightness distribution and the velocity variations across the spiral arms of NGC 1566 are in qualitative agreement with observations for the obsrtvationally based models of NGC 1566.
In this paper we extend the study to a set of nearby spiral galaxies of different morphological types. Namely, we choose six spiral galaxies with measured kinematical properties of their disks: NGC 1566, NGC 488, NGC 628, NGC 2985, NGC 3938 and NGC 6503. We include the galaxy NGC 1566 studied previously by Korchagin et al. (2000) in our list, for which we present some new results. We use an approach similar to the one previously used to model the spiral structure in the grand design spiral galaxy NGC 1566 (Korchagin et al. 2000). We construct observationally-based axisymmetric background distributions in the disks of the spiral galaxies to undertake linear global modal analysis, and determine the set of unstable global modes that might grow in their disks. The results of the linear global modal analysis are then compared with the direct nonlinear simulations of the galactic disks using 2-D one-component and multi-component fluid dynamical codes. We follow the dynamics of the disks of the galaxies starting from the random initial perturbations up through the nonlinear saturated phase of spiral instability. We compare then the theoretically predicted spiral patterns with the observed properties of the spiral galaxies, and find that the theoretically predicted global modes reproduce qualitatively well the observed morphological properties of the spiral spiral structure in our sample. We conclude that our results support the global modal approach as a theoretical explanation of the spiral structure of galactic disks.
2 Approach and Assumptions
Fluid approximation.–We base our study on a fluid dynamical approximation. In this approach, a stellar disk is modeled as a fluid with the polytropic equation of state:
| (1) |
Here is a surface density, is a vertically integrated pressure, is the polytropic index, and is a polytropic constant.
There are a few justifying arguments why the fluid dynamical equations can be applied to describe the behavior of galactic disks built mostly from collisionless stars. Marochnik (1966), Hunter (1979) and Sygnet et al. (1987) derived from the collisionless Boltzmann equation a set of hydrodynamic equations that describe the behavior of perturbations in the collisionless rotating disks. Another argument comes from the comparison of the global modes calculated in a fluid-dynamical approach with the results of the exact simulations that use the collisionless Boltzmann equation. Kikuchi et al. (1997) found that the global modes calculated in a collisionless disk by using the Boltzmann equation (Vauterin and Dejonghe 1996), are in a good agreement with the global modes calculated in a fluid dynamical approach.
We use in this paper the simplest realization of the collisionless hydrodynamics - the polytropic equation of state with the polytropic index 2 (Marochnik 1966). The disks of galaxies are self-gravitating in a perpendicular direction, and this law naturally explains the empirical ”square root” proportionality between the velocity dispersion and the surface density found in galactic disks (Bottema 1992).
Velocity dispersion.–Observational data for the line-of-sight stellar velocity dispersion as a function of a galactocentric radius are available for all galaxies in our sample. The observed line-of-sight velocity dispersion is determined by the radial, tangential and vertical components of the velocity dispersion. For the galaxies that have a low inclination, the observed velocity dispersion gives approximately the z-component of the velocity dispersion. For the highly inclined galaxy NGC 6503, the observed line-of-sight velocity dispersion is determined by the tangential component of the velocity dispersion ellipsoid (Bottema 1989).
The observed radial distributions of the velocity dispersion in the galactic disks are close to exponential profiles. We assume that the radial distributions of the velocity dispersion in the galactic disks are exponential and choose, in agreement with observations (Bottema 1992), the radial scale length of the velocity dispersion to be twice as large as the radial scale length of the surface density distribution in the galactic disks. To construct the equilibrium models of the galactic disks, one needs to know the radial as well as the vertical components of the stellar velocity dispersion. Two galaxies in our sample, namely NGC 2985 and NGC 488 have measured velocity ellipsoids (Gerssen et al. 2000; Gerssen et al. 1997), and we adopt measured radial and vertical velocity dispersions for these galaxies in our analysis. For the rest of the sample, we accept the value of the ratio of vertical to radial velocity dispersion of stars in the galactic disks, and assume this ratio to be constant throughout a galactic disk. In general, the ratio of the velocity dispersions varies with the Hubble type of the galaxy, and is in the range (Merrifield 2001; Shapiro et al. 2003). To construct equilibrium models for the galaxies with unknown velocity dispersion ellipsoids, we vary the ratio of the vertical to the radial velocity dispersions between . We find, however, that once the galactic disk is unstable, the morphological properties of the growing spiral modes, i.e., the number of arms and their pitch angles, are largely insensitive to the adopted velocity dispersion ratio.
Surface density.– The surface density in the galactic disks is determined under the assumption that the disks are in equilibrium in the vertical direction, and can be modeled as a locally isothermal, self-gravitating slab. The surface density and the vertical velocity dispersion are then related as (Spitzer 1942):
| (2) |
Here is the gravitational constant, and is the exponential scale height of the disk density distribution.
The exponential scale height of the galactic disks is an unknown parameter for the galaxies in our sample. Observations of a few edge-on galaxies (van der Kruit & Searle 1982), show that the vertical scale height is constant with radius, and varies between 0.3 - 0.8 kpc within their sample. The measurement of the vertical scale height of the thin disk component in the Milky Way gives a value close to 0.28 kpc (Drimmel and Spergel 2001). We assume this parameter to be constant throughout the galactic disk, and vary it in our models within 0.3 - 0.8 kpc.
In the outer galactic disks, the stars that are observed, are relatively bright and massive. These stars do not contain most of the mass of an old stellar disk which is accumulated in form of dim K - M dwarfs. Nevetheless, the method correctly predicts the local surface density of the disk. One can use the measured velocty dispersion and the scale height of a ‘tracer’ stellar population to estimate the total surface density of underlying mass distribution ( Korchagin et al. 2003).
The radial scale lengths of the exponential disk are photometrically determined for each particular galaxy. For numerical reasons, we assume that the surface density vanishes at the outer boundary of the disk and introduce a dimensionless factor which smoothly enforces this behavior.
The density distributions in the central regions of the galaxies NGC 488 and NGC 2985 are dominated by the bulge. To study a possible influence of the bulge on the modal properties of the disks in these galaxies, we followed Bertin et al. (1989a), and introduce in some models another dimensionless multiplier which decreases the surface density in the central regions mimicing a replacement of the disk stars by a bulge stellar populations. We find though that a drop of the disk density near its center has a little effect on the disk modal properties.
Rotation curve.– To model the observed rotation curves in our sample of galaxies, we have adopted the rotation curve from Korchagin et al. (2000):
| (3) |
where the constants and are determined from the best fit to the observed rotation curve in a particular galaxy, and the constants and in most of cases were equal to 0.75. Analytical representation to the rotation curves of the galaxies exhibits basic features of the galactic rotation, and allows an accurate modelling of the observed rotation of the galactic disks. We find that a particular choice to represent analytically the rotation curve of a galaxy is not important once a modeled rotation curve is close to an observed rotation profile of the galactic disk.
Q-parameter.– Radial velocity dispersion together with the surface density and epicyclic frequency give the radial dependence of the stability Q-parameter (Toomre 1964), given by:
| (4) |
Here is the epicyclic frequency determined by the observed rotation curve, is the disk surface density, and is the radial velocity dispersion in the galactic disk. With exponential distributions of the surface density and the velocity dispersion, the Q-parameter tends to be larger in the central regions and at the peripheries of the galactic disks. The minimum value of the Q-parameter is larger than unity in the galactic disks which, however, does not prevent them from experiencing global instabilities.
Inactive halo.– An equilibrium rotation of the galactic disk is supported by the combined disk and halo/bulge gravitational potential. Once the radial profile of surface density of a galactic disk is determined from the observed velocity dispersion, the gravitational potential and the density distribution of an inactive spherically symmetric halo and bulge can be calculated from the rotational equilibrium of the disk. The potentials of spherical components are kept intact during the all simulational run. Typically, the mass of spherical components in computational region is a few times larger than the mass of a galactic disk.
Cold gas component.– We explore the simplest possible model of the galactic disks approximating them as a one-component fluid obeying an adiabatic equation of state. Galactic disks consist of stars and gas in different forms, that affects the stability properties and the dynamics of the unstable modes. This question was addressed by a number of studies (e.g., Jog & Solomon 1984, Berting & Romeo 1988, Orlova et al. 2002). An admixture of a cold gas component increases the growth rates of the unstable global spiral modes in the disk. However, the appearance of the global modes in the multi-component models remains quite similar to that in one-component models. E.g., an unstable two-armed spiral growing in a one-component disk remains a governing unstable mode in a multi-component disk, and has a comparable winding (Orlova et al. 2002). The colder components would not change therefore a qualitative analysis we present.
Computational methods.– The computational methods used in this paper are similar to those described in Korchagin et al. (2000). Briefly, the linearized hydrodynamical equations are reduced to a single integro-differential equation that describes an unstable global mode ( e.g., Adams et al. 1989). Together with the boundary conditions, this equation formulates the eigenvalue problem, which is solved numerically by means of a matrix method. In this method, the governing eigenvalue equation is applied at (N+1) radial grid points, and the problem is then reduced to an (N+1)(N+1) matrix equation which yields an eigenfrequency of the global mode. The nonlinear simulations are made with the two-dimensional numerical code based on a second-order van Leer-type advection scheme to integrate hydrodynamical equations, and a fast Fourier transform algorithm to solve the gravitational potential. For the runs discussed here, a grid of 256 256 zones was employed with equally spaced azimuthal zones, and logarithmically spaced radial zones. We checked a dependence of the results on grid resolution by employing the grids with resolutions 64 64, 128 128 and 512 512. We find that results of the simulations do not change if the grid resolution 128 128 or higher.
The simulations were launched from an initial condition in which each hydrodynamic zone was given a random density perturbation of up to one part in away from the equilibrium state. In some cases, random density perturbations of order of of unperturbed state were imposed. The growth rate, patterm speed, winding or the nolinear saturation amplitude of an emerging spiral pattern do not depend on amplitude of the initial noise perturbations.
3 Results
3.1 NGC 1566
With its near-perfect two-armed spiral pattern and with inclination of about , this nearby ( distance 17.4 Mpc) spiral galaxy was studied observationally by a number of authors. Korchagin et al (2000) have undertaken a theoretical modeling of spiral structure in NGC 1566 based on the Bottema’s (1992) measurement of the rotation curve and the radial dependence of the -component of the velocity dispersion in its disk. Assuming a fixed vertical scale height of 0.7 kpc, Korchagin et al. (2000) found that NGC 1566 should be gravitationally unstable when the ratio of the vertical to the radial velocity dispersions, is close to unity. In this paper we make different assumptions for NGC 1566, choosing a lower values of , and varying a vertical scale height of the disk. Measurements of the Milky Way velocity ellipsoid in solar neighborhood give for this ratio the value of about 0.5 ( Dehnen and Binney, 1998). Theoretical arguments (e.g., Villumsen 1985; Lacey 1984) also favor a smaller value of 0.6 – 0.8. There is an observational evidence for a systematic trend of ratio among galaxies of different Hubble types (Merrifield 2001; Shapiro et al. 2003). Galaxies of late Hubble types tend to have a lower ratio, while in the galaxies of earlier Hubble types this ratio is larger. Shapiro et al. (2003) studied the ratio of the vertical to radial velocity dispersion for four spiral galaxies of Hubble type from Sa to Sbc. They find that is generally in the range of . In this paper, we re-analyze the theoretical models of spiral structure in NGC 1566 varying the value of the vertical to radial velocity dispersion within , but allowing the vertical scale height of the disk of NGC 1566 to vary within kpc.
The observed velocity dispersion in NGC 1566 is approximately four percent larger than the -component of the velocity dispersion (Bottema 1992). Following Bottema, we neglect this difference and assume that measured velocity dispersion gives the real -dispersion in the disk of NGC 1566.
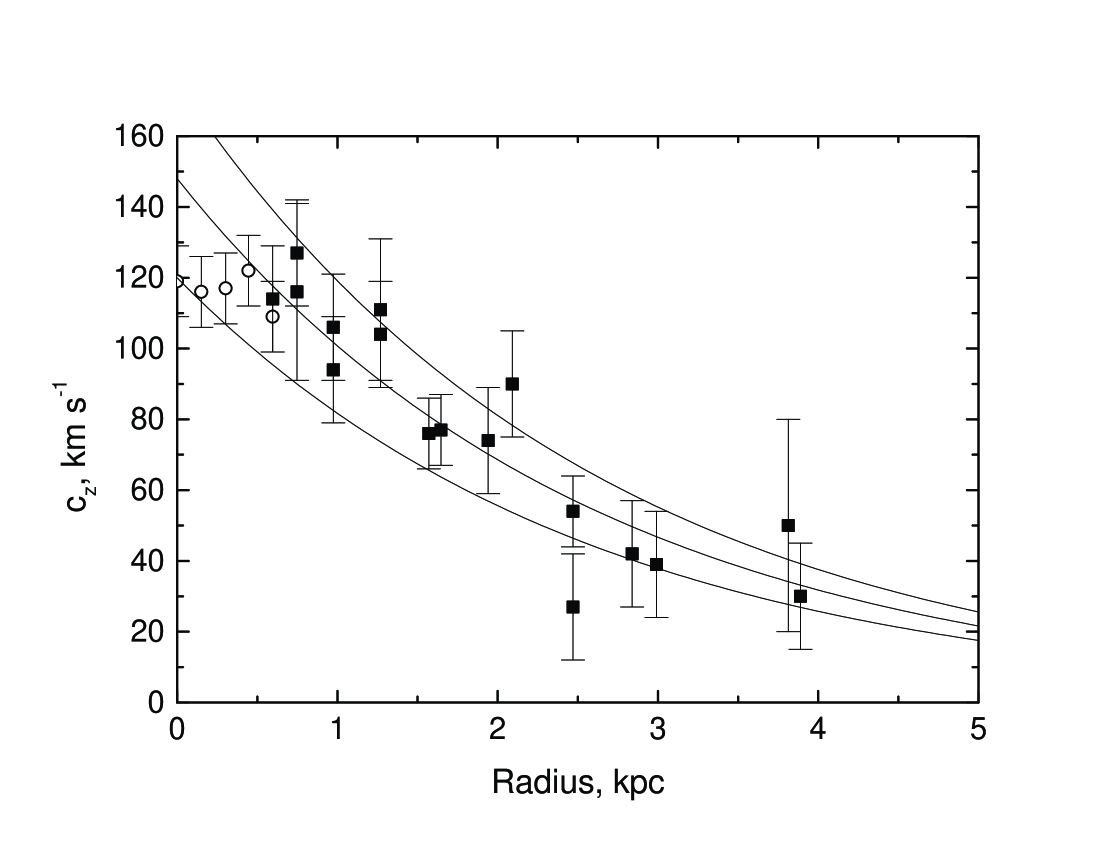
Figure 2 shows the observed vertical velocity dispersion as a function of radius taken from Bottema (1992) modeled with an exponential distribution. The radial scale length for the velocity dispersion profile was choosen of 2.6 kpc, which is twice as large than the scale lengh of the surface brightness distribution (Bottema 1993). The best fit to the exponential function gives the value for the velocity dispersion at the disk center of 148 km/sec. An exponential function satisfactory reproduces the observed profile of the velocity dispersion within the error bars except for the near-central regions (Figure 2). An anomalous behavior of the velocity dispersion at the core of NGC 1566 is probably related to a small central bulge (Bottema 1992).
We considered also models with the ”upper” and ”lower” velocity dispersion profiles allowed within the error bars, as shown in Figure 2. These models have central velocity dispersions of 120 km/sec and 176 km/sec.
Knowledge of the -component of the velocity dispersion allows us to determine the surface density in the disk, provided the vertical scale height of the stellar distribution is known. The vertical scale height of the stellar disk of NGC 1566, which is seen nearly face-on, cannot be measured directly. Studies of the surface photometry of edge-on spiral galaxies show that the vertical disk profile shape is independent of galaxy type, and varies little with position along the major axis (van der Kruit and Searle 1982; de Grijs et al. 1997). Van der Kruit and Searle (1982) find the average vertical scale height of the old stellar population in galactic disks, when fitted to the sech2- function, is about 0.7 kpc. This value is higher than the sech2 vertical scale height measured in the Milky Way galaxy. Recent determinations of the thin disk scale height of the Milky Way in the solar neighborhood give the value of about 280 pc (Drimmel and Spergel 2001). We allow therefore in our models the vertical scale height to vary within 0.3 - 0.75 kpc. We find that the morphological properties of the emerging spiral pattern depend very little on the assumed value of the vertical scale height of a galactic disk, as demonstrated in the following section.
3.1.1 Linear Models
Table 1 lists the parameters of the twelve models of NGC 1566 studied in our linear analysis. All the models have the fixed ’medium’ rotation curve with the maximum rotation velocity of 212 km/sec. The range of disk vertical scale height values is 0.3 - 0.75 kpc, so the minimum value of Toomre -parameter is about 1.4 - 1.6. The last column of the Table 1 gives the pattern speed, , and the growth rate, Im of the most unstable spiral global mode. The ratio of the growth rate to the pattern speed varies from approximately one-fourth for the model with the , to the one-tenth for the model with the equal to 1.6. The shape of the spiral patterns does not change considerably from model to model, but the corotation radius and the overall extent of the spiral patten changes. Model from Table 1, which has intermediate values of key parameters, is used in our nonlinear simulations.
Dependence on the disk thickness.– The dependence of the global modes on the vertical scale height of the disk was studied in the models built from model by varying the disk scale height. The disk scale height was varied from 0.3 kpc, when the minimum value of Toomre’s -parameter is less than unity, to 0.5 kpc, until the disk becomes totally stable. The two-armed spiral remains the most unstable global mode in the sequence of models built in such way. We find that variation of the disk thickness within an observationally allowed range does not affect the modal properties of the disk. The winding of spirals do not change considerably, however, the growth rate increases by a factor of six, as the scale height is decreased. By decreasing the vertical scale height of the disk we simultaneously increase the disk mass from M⊙ to M⊙.
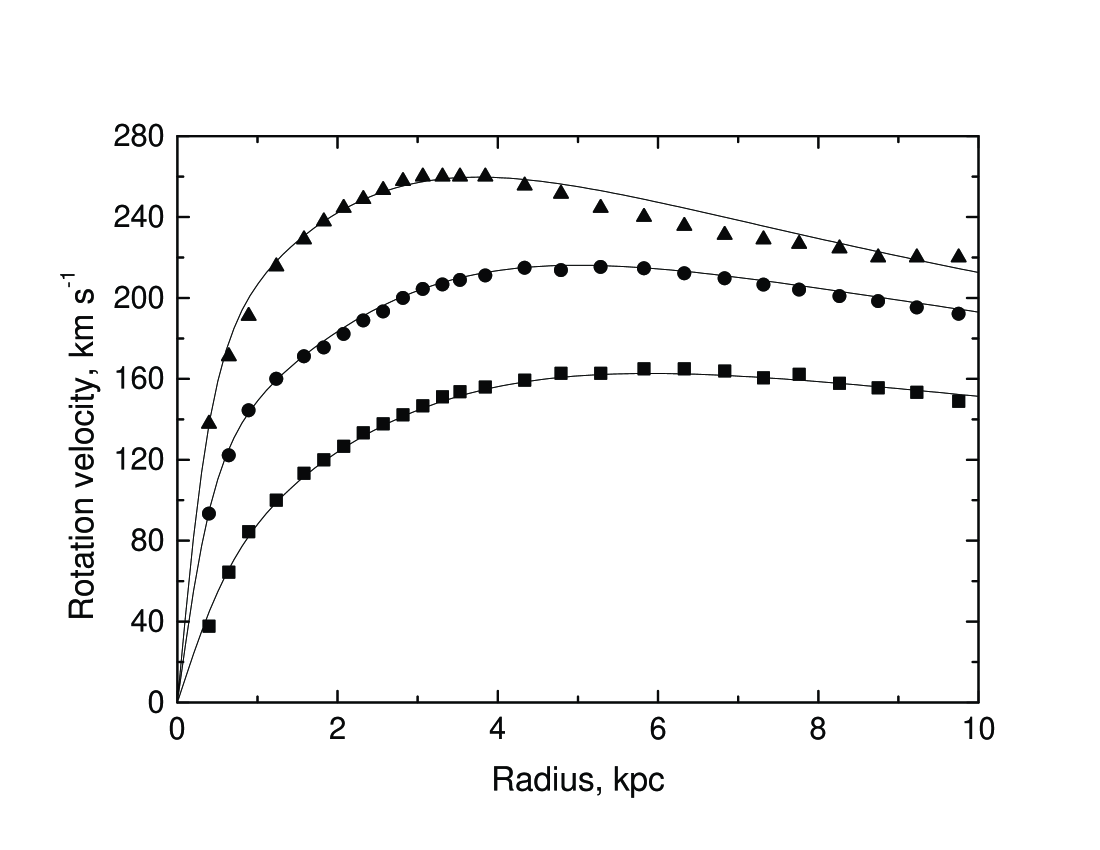
Dependence on the rotation curve.– Together with the ’standard’ medium rotation curve, we considered also models with the ”upper” and ”lower” rotation curves allowed within the error bars, as shown in Figure 1. These models demostrate qualitatively similar behavior. The models have the ratio of the velocity dispersions , fixed at 0.6, and central velocity dispersion fixed at 148 km/s. The rotation curve is varied from the “lower” to the “upper” curve as shown in Figure 1. Again, while the rotation speed and the growth rate of the most unstable spiral are sensitive to the particular parameters of the models (the rotation curve), the two-armed spiral remains the most unstable global mode, and its morphological properties vary little from model to model.
3.1.2 Nonlinear simulations
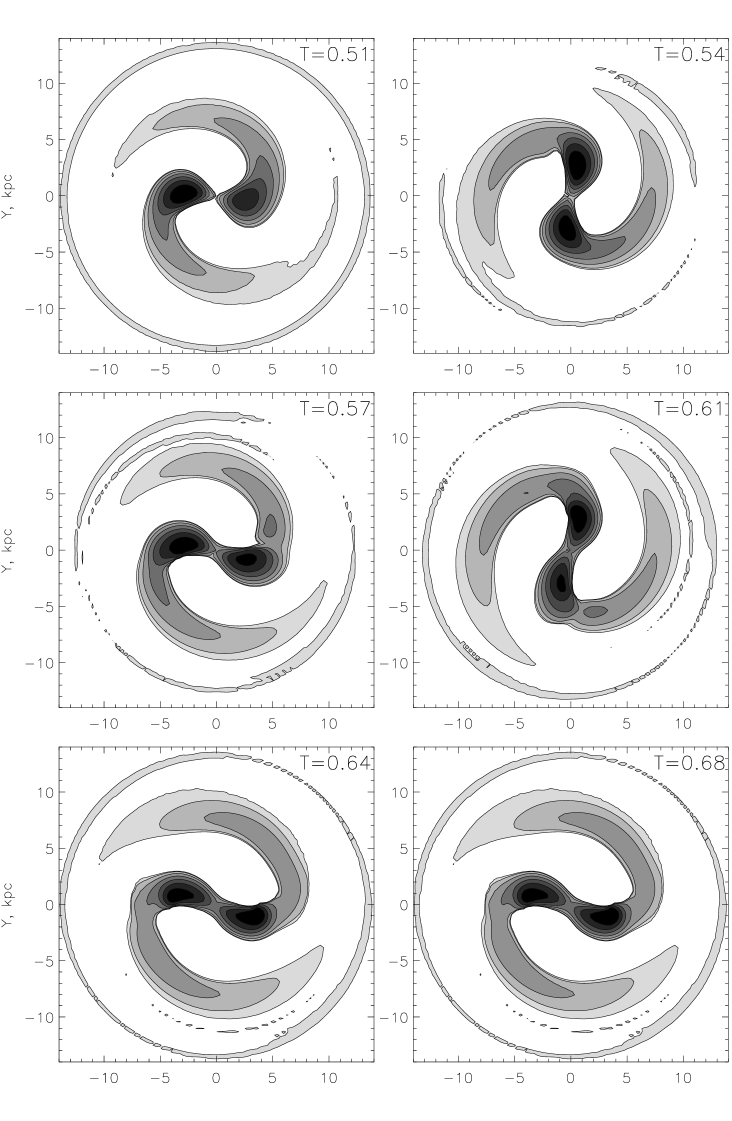
This section presents the results of the 2-D nonlinear simulations of the spiral pattern which develops in the disk of NGC 1566 once it is seeded with small amplitude noise perturbations. We choose as an example the model for our nonlinear simulations which is built for the best fit medium rotation curve and for the best fit to the observed radial distribution of the velocity dispersion.
In accordance with the linear analysis, the model is the most unstable with respect to the growth of a two-armed spiral. The perturbations exponentially grow during approximately years when the exponential growth phase merges into a saturation phase. The overall dynamics of the perturbations is dictated by the two-armed spiral mode. We checked that by calculationg time dependence of the global perturbation amplitudes, determined as the Fourier amplitudes of the perturbations averaged throughout the disk:
| (5) |
Here is the mass of the disk, and are the radii of the inner and the outer disk boundaries, and is the number of arms. Figure 3, which shows the time sequence for the surface density perturbations developing in the disk, also illustrates that the two armed pattern dictates the dynamics of perturbations. The nearest competitor, the the three-armed spiral, although present in the 2-D density perturbations, does not play a significant role in the morphological properties of the developing perturbations.
Dependence on boundary conditions.– Despite a good quantitative agreement between the results of the linear modal analysis and the nonlinear simulations, the limited radial dynamic range and the reflective boundary conditions accepted in simulations can affect our results. It is known (Toomre 1981), that a steep truncation of the density distribution at the outer edge of the disk can alter the spectrum of the global modes of the disk, thus compromising the comparison of theoretical models with observations. Laughlin et al. (1998) studied the behavior of perturbations in the nonlinear simulations depending on boundary conditions as well as on the radial dynamic range of the models. They find that the early development of a radially extended disk is more complex than the evolution of the model with the lower radial range, but the essential features of the two disks are very similar, and the two-armed spiral is the dominant feature in both experiments.
Figure 3 confirms the result of Laughlin et al. (1998). The panel ) in Figure 3 shows the two-dimensional contour plot taken at time yrs for the perturbations developing in model . In this model, the outer boundary is placed at at 20 kpc with the surface density chosen to be vanishing at the outer boundary in a smooth way . The panel ) of the same Figure shows the spiral pattern developing in the model with the outer radius placed at 20 kpc, but with the exponential density distribution abruptly truncated at the outer edge of the disk. The panel ) in Figure 3 is a result of simulations performed with the disk which has an exponential density distribution inside kpc, but with the outer boundary moved out to kpc. The surface density in the region between kpc and kpc is set to a small value about of the central surface density of the disk. In all three frames the perturbations are shown at the same moment of time. As it can be seen from Figure 3, the two-armed spirals are nearly identical in all three cases, and the outer boundary condition as well as the radial dynamic range of the disk do not affect the behavior of perturbations.
3.1.3 Comparison with observations
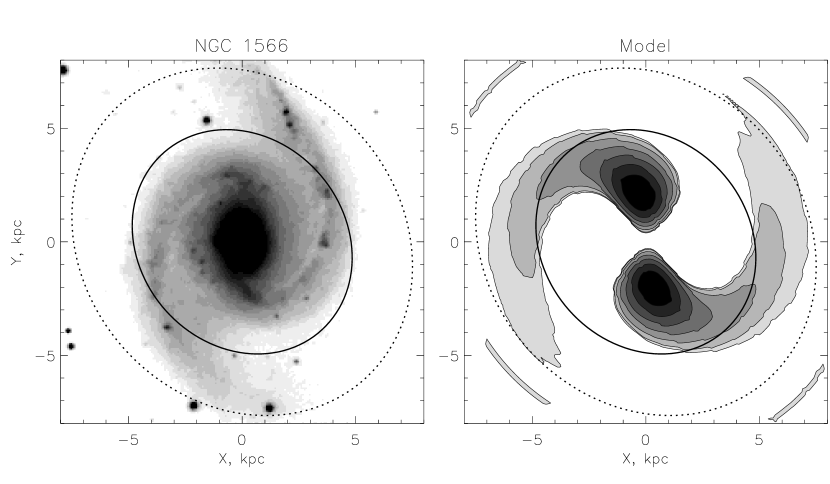
Figure 4 shows an I-band image of NGC 1566 taken from Korchagin et al. (2000) (left frame), as compared to the perturbed density distribution developing in model at a time of years. The spiral pattern found in the linear global modal analysis, and the pattern emerging in the disk from the noise perturbations agree well with each other, and with the observed spiral in NGC 1566. The pitch angle of the theoretical pattern is about 35, which is in good agreement with the pitch angle of 36 measured by Vera-Villamizar et al.(2001) in NGC 1566. Our simulations show that the two-armed spiral dominates the dynamics of the perturbations during the linear, as well as the nonlinear saturated stage of pattern evolution. The time of the nonlinear phase is comparable to the time of the exponential growth phase. In total, the modeled two-armed pattern exists more than 109 years, and makes about eight revolutions during the simulation time.
Corotation resonance.– The linear, as well as the nonlinear simulations provide a value of the pattern speed, which in principle allows the determinatin of the positions of the corotation and the Lindblad resonances. We measure in our simulations of NGC 1566 a pattern speed of 33 , which places the corotation resonance at approximately 6 kpc. Based on optical features of NGC 1566 (Elmegreen & Elmegreen 1990) and by comparing of blue and infrared frame azimuthal profile Fourier transforms of disk surface brightness (Vera-Villamizar et al. 2001) the position of the corotation resonance in NGC 1566 was determined at 8.5 - 10 kpc. There are a few possible sources for such a discrepancy. In our modeling of NGC 1566, we used the rotation curve taken from Bottema (1992). Bottema’s measurements give a maximum value of the rotation speed of 212 30 km s-1. Vera-Villamizar et al.(2001) based their studies on the rotation curve taken from Persic Salucci (1995) which has a maximum rotation speed of 150 . The uncertainties in the measurement of the rotation curve obviously alter the theoretical prediction of the positions of the principal resonances in the disk of NGC 1566.
As was demonstrated above, the overall morphological properties of the most unstable global mode do not depend strongly on the minimum value of Toomre’s Q-parameter once the galactic disk becomes unstable towards the growth of global modes. The growth rate, and the pattern speed do, however, depend on the minimum value of the Q-parameter. We find that more slowly growing spirals have lower pattern speed compared to the fast-growing spirals. E.g., a pattern speed of 33 was found in the disk with a Qmin of 1.6, while a disk with a Qmin of 1.17 has a pattern speed of 56 , and a corotation resonance at 4 kpc. Therefore the uncertainties in the measurements of the background properties of the disks prevent accurate quantitative predictions of the positions of principal resonances.
3.2 NGC 488
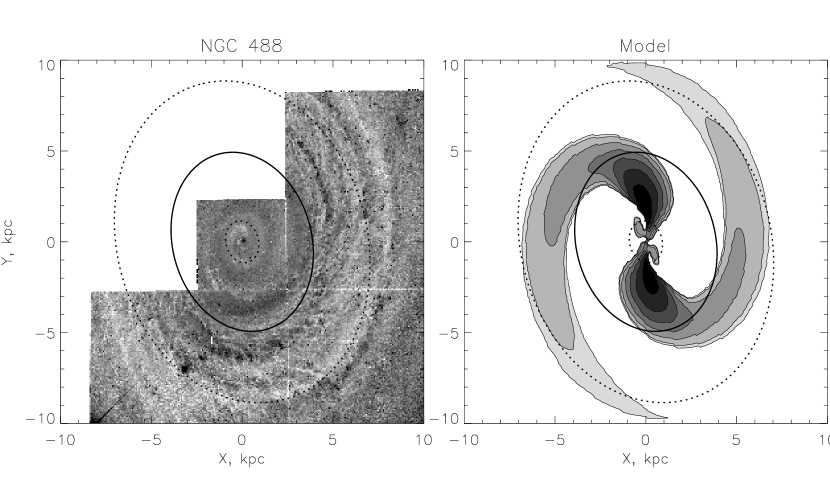
NGC 488 is a nearby Sb galaxy with an inclination of about 40 (Gerssen et al. 1997). With Hubble constant of 75 km s-1 Mpc-1, the distance to NGC 488 is about 30 Mpc. Sandage & Bedke (1994) describe this galaxy as a prototype of the multi-armed spiral galaxies. Hubble Space Telescope observations (Carollo et al. 1997, Sil’chenko 1999) reveal, however, a tightly wound two-armed spiral pattern shown on the left panel of Figure 5. This panel reproduces HST image of this galaxy in the optical band (F606W filter) taken from the NED archive. To trace better the spiral structure in the central regions of the disk, we have subtracted the bulge component assuming a Sersic (1968) profile for the bulge, with , and an exponential surface brightness distribution for the disk of NGC 488.
NGC 488 is well studied kinematically. Peterson (1980) measured the rotation curve of this galaxy using emission line spectra and Gerssen et al. (1997) have measured the disk rotation using stellar absorption-line data. NGC 488 has a remarkably high rotation velocity with a maximum value of about 360 . Figure 6 shows both rotation curves together with the best fits to the measurements. In the outer parts of the galactic disk the stellar rotation curve is consistent with the emission line measurements by Peterson (1980). In the bulge region, gaseous emission line measurements give higher values for the disk rotation. A discrepancy of gaseous and stellar rotation curves in the inner disk regions results probably due to a large asymmetric drift of high velocity dispersion stars in the bulge region. We explored both rotation curves to model stability properties of the disk of NGC 488.
Gerssen et al. (1997) measured the components of the stellar velocity dispersion. They found exponential radial distributions for the radial and vertical components of velocity dispersion, and using stellar absorption-line data estimated the radial and the vertical velocity dispersions of stars at the galactic center to be 253 32 and 164 27 respectively giving the value of the ratio of vertical to radial velocity dispersion in the disk of 0.70 0.19.
3.2.1 Linear Models
Based on the measured stellar velocity dispersions, we have studied stability properties for the family of models of NGC 488. The models listed in Table 2, explore the rotation curve based on the emission line measurements of Peterson (1980). The models cover an observed range of the radial velocity dispersions at the disk center of 221 - 285 km/s. The surface densities at the center of the disk determined with the help of Equation (2), correspond to the observed range of the disk vertical velocity dispersions of 137 - 191 km/s and the vertical scale height of the disk density distribution of 0.35 - 1 kpc.
The models are stable when the minimum value of Toomre’s parameter exceeds approximately 1.7. All the unstable models demonstrate, however, quite similar behavior: they are are mostly unstable towards a two-armed spiral.
3.2.2 Nonlinear Simulations
Exponential disk.- As an example, we present here the results of our nonlinear simulations for the model that has an exponential surface density distribution. The total mass of the disk is 1.25 1011 M⊙. The value of the vertical velocity dispersion at the disk center is 164 km/s. The ratio of the radial to vertical velocity dispersion is 0.73 as determined by Gerssen et al. (1997). Following Gerssen et al. (1997), we assume that the disk velocity dispersion exponentially decreases with radius with a radial scale length of 5.5 kpc.
Gerssen et al. (1997) find that the kinematic scale length in the disk of NGC 488 is comparable to the B-band photometric scale length, which is not the expectation for the local isothermal approximation. They note however, that a likely explanation is the fact that the stellar mass distribution is better traced in the near-infrared K-band. Empirically it is known that the scale lengths in K-band are shorter than in B-band up to a factor of 2 (Peletier et al. 1996), and we accept therefore the radial scale length for the surface density distribution being two times shorter than the kinematic scale length of Gerssen et al. (1997).
The equilibrium disk was initially seeded with the noise density perturbations with amplitude of 10-6 of the unperturbed density. The exponentially growing two-armed spiral pattern emerges from the noise perturbations. Until the nonlinear saturation phase, the dynamics of perturbations is governed by the two armed spiral. During the nonlinear saturation phase, the spiral shocks develop, and the regular spiral pattern is disrupted. The hydrodynamical approximation is not adequate to describe the behavior of the collisionless stellar disks at highly nonlinear stages of evolution.
Stellar rotation curve.– As it was mentioned above, there is a considerable discrepancy of gaseous and stellar rotation curves in the inner disk regions. To study how the results depend on our choice of the rotation curve, we used stellar rotation curve to model the disk dynamics. We find, that the difference between the both rotation curve measurements do not affect an overall dynamics of the disk. Figure 7 shows a time sequence for the density perturbations developing in model , but with the ’stellar’ rotation curve based on measuremenmts by Gerssen et al. (1997). A two-armed spiral quickly emerges from the noise and governs the dynamics of perturbations up to a nonlinear saturation phase.

Bulge.– NGC 488 is classified as an Sab galaxy and has a noticeable bulge. A bulge-disk decomposition for NGC 488 by Kent (1985) gives the value for the half-mass radius of the bulge of about 4.3 kpc with the Hubble constant of 75 km/s/kpc. Fuchs (1997) finds somewhat smaller value for the half-mass radius of about 2.5 kpc.
Little is known about the structure and the very existence of the disk inside the bulge. As it was mentioned by Bertin et al. (1989a), the disk might be actually replaced by the bulge stars in the inner regions, and the disk density is reduced to insignificant values near its center. We studied such a possibility by modeling the dynamics of a disk that has a suppressed density distribution near its center. We used the bulge density distribution from Fuchs (1997), namely
| (6) |
with the bulge core radius of 0.92 kpc. The resulting disk surface density is shown in Figure 8.
The disk dynamics is similar to the two previous cases. The disk is unstable towards the two-armed spiral, and the spiral morphology does not differ much compared to the two previous cases. We simulated the dynamics of the disk using the gaseous as well as the stellar rotation rotation curve, using the bulge parameters taken from Kent (1985). In all cases, the dynamics of perturbations is governed by the two-armed spiral. We find, however, that the models with the density depression near the disk center exhibit more tightly wound spirals.

Comparison with observations.– The right panel of Figure 5 shows the result of our nonlinear simulations for model taken at time 4 yr. The Figure shows the contour plots for density perturbations in the disk with the contour levels logarithmically spaced between the maximum value of the perturbed density and 1/100 of the maximum value of perturbations. As in the real galaxy, the model produces a two-armed spiral pattern. The modelled spiral arms are more open compared to the observed ones. A discrepancy between the modeled spiral arms and the observations, especially in the central disk regions, is not surprising taking into account the uncertainties in the observed density and the velocity dispersion distributions. However, within all possible uncertainties of the observed equilibrium disk distributions, and despite of our ignorance of the disk properties close to the center, all the models support the two-armed spiral that governs the dynamics of perturbations for about one Gyr. During this time, the spiral pattern makes about seven revolutions.
3.3 NGC 628
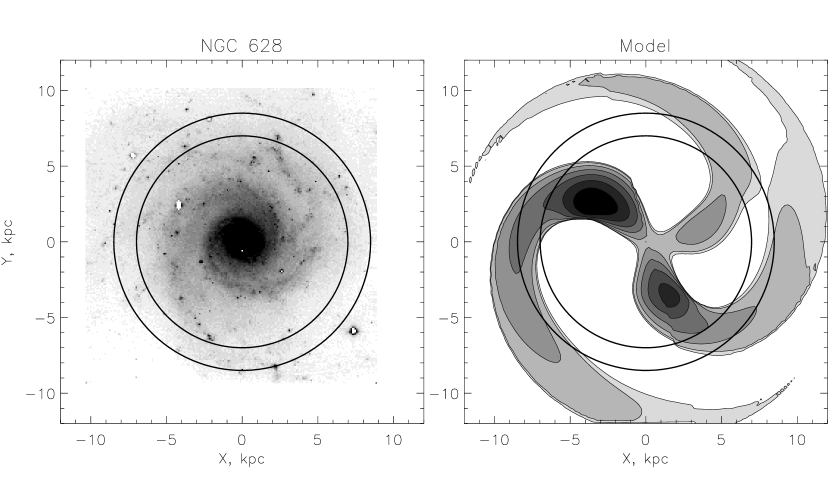
The proximity (distance of about 10 Mpc) and the orientation of NGC 628 makes it a convenient object to study the spiral structure. NGC 628 is a grand design galaxy that has two principal spiral arms, and a number of secondary arms. The I-band image taken from Larsen & Richtler (1999) and shown in the left panel of Figure 9.
Fourier analysis of the spiral structure of NGC 628 by Puerari & Dottori (1992) shows that the two-armed spiral pattern is a dominating component. However, there is a considerable admixture of a three-armed spiral in the inner regions of the galaxy.
The rotation curve of NGC 628 was measured by Kamphuis & Briggs (1992). They find a maximum rotation velocity of the disk to be about 200 km s-1 taking the inclination of NGC 628 of 6.5°. Figure 10 shows our best fit to the rotation curve of NGC 628 superimposed onto the observational points from Kamphuis & Briggs (1992).
With the inclination of NGC 628 of 6.5°, the observed data provide direct measurement of the vertical component of the disk velocity dispersion. Van der Kruit & Freeman (1984) find the vertical velocity dispersion of the stellar disk to be 60 20 at a distance 60′′ from the galactic center. Following van der Kruit and Freeman (1984), we assume that the velocity dispersion in the disk of NGC 628 exponentially decreases with radius, and has a scale length twice larger than the photometric scale length. Van der Kruit & Freeman (1984) find that the photometric scale length of the old stellar disk in NGC 628 is about 60′′. Based on this value, the kinematic scale length of the disk of NGC 628 is equal to 120′′. This yields a value of the velocity dispersion at the disk center equal to 99 33 .

Table 3 lists the parameters of the models studied in our linear analysis. The vertical scale height of the disk varies in the models between 0.35 - 0.8 kpc, and the ratio of the vertical to the radial velocity dispersion is allowed to vary within 0.5 - 0.8. With these parameters, the disk mass changes from 4 1010 M⊙ to 9 1010 M⊙.
Linear analysis shows that the dynamics of perturbations in the disk is not determined by one dominating mode. We find that in most of the models the two global modes grow simultaneously with comparable growth rates. In the models with the lowest values of the velocity dispersion allowed by observations, the three, and four-armed spirals are the most unstable (models - in Table 3). The models - that have the most probable value of the central velocity dispersion of 99 km/sec, are unstable towards and spirals. The models that have the highest possible velocity dispersion, support a two armed spiral prevailing considerably over other competitors.
The models with the most probable velocity dispersion profile, are unstable towards the two-armed, and the three-armed spirals. These modes determine the dynamics of perturbations in the disk, and the asymmetric shape of the spiral pattern in the disk of NGC 628 can be qualitatively explained by the interplay between these two dominant modes.
Nonlinear simulations are performed for the model listed in Table 3. This model has the velocity dispersion profile based on the measurements by van der Kruit & Freeman (1984) and the exponential surface density distribution with the radial scale length of 2.9 kpc. The vertical velocity dispersion profile is based on measurements by by van der Kruit & Freeman (1984), and has kinematical scale length of 5.8 kpc. The total mass of the disk is about 6 1010 M⊙, and the ratio of the velocity dispersions is 0.6.

Figure 11 shows the time dependence of the global amplitudes for spiral modes calculated with help of equationb (5). The two-armed, and three-armed modes grow with the approximately equal growth rates. At the beginning, the three-armed spiral slightly dominates the dynamics of the perturbations. Later on, the two-armed spiral reaches a comparable amplitude, which results in an asymmetric two-armed spiral pattern. The right panel of Figure 9 shows a theoretical contour plot of the density distribution in the disk of NGC 628 taken at time 1.6 109 years. The Figure shows also the positions of corotation resonances for two governing modes, with kpc, and global mode with kpc. As it can be seen from the Figure, the basic features of spiral structure of NGC 628, namely the two-armed spiral pattern with a third arm of comparable amplitude, are reproduced in our simulations.
3.4 NGC 2985
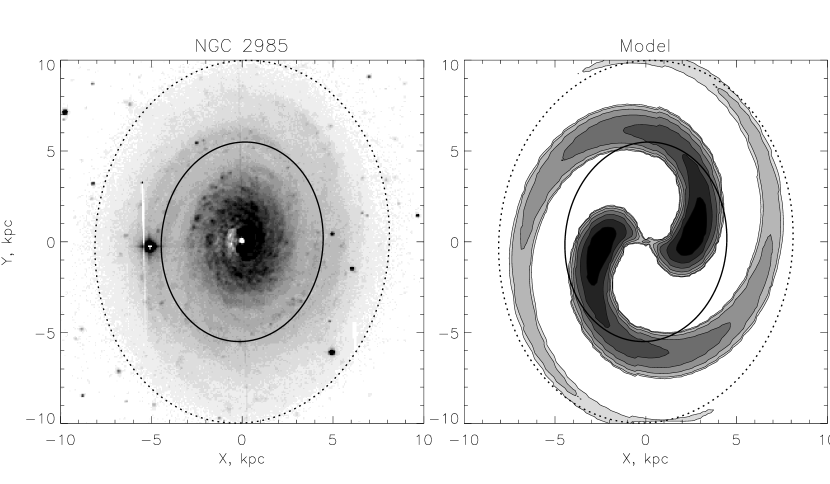
The Sab galaxy NGC 2985 is another example of an early type galaxy in our sample. This galaxy has an inclination of about 36 (Grosbol 1985), and distance of 18 Mpc with Hubble constant of 75 km/s/Mpc. The spiral pattern in NGC 2985 is similar to that in galaxy NGC 488. NGC 2985 has a regular two-armed spiral pattern outlined by tightly wound narrow arms, as can be seen on the left panel of Figure 12. The Figure reproduces high-resolution R-band image of NGC 2985 taken from the NED archive (Knapen et al. 2004). Similarly to the image of NGC 488, the bulge component has been subtracted assuming a Sersic (1968) profile for the bulge (, ), and an exponential surface brightness distribution for the disk of NGC 2985.
We build equilibrium models of NGC 2985 based on measurements by Gerssen et al. (2000). Figure 13 shows the observed rotation curve of the stellar disk of NGC 2985 obtained with long-slit absorption spectra along the major axis of the galaxy. The dashed line in Figure 13 is our best-fit to the observational data used in the numerical simulations.

NGC 2985 is one of the few galaxies that have a measured ellipsoid of the stellar velocity dispersions. Gerssen et al. (2000) find the values of the radial and vertical velocity dispersions at the disk center of 14912 and 127 10 correspondingly, and the ratio of the vertical to the radial velocity dispersion in the disk of NGC 2985 of . The radial scale length of the exponentially decreasing velocity dispersions from the Gerssen et al. (2000) measurements is about . This value is approximately two times larger than the value of the photometric scale length in I band of . We use the value of for the radial scale length of the exponentially decreasing surface density distribution. Some models are built using the radial scale length of the surface density distribution of which is based on the kinematical scale length obtained by Gerssen et al. (2000). The results from these two sets of models are comparable.
As in the case of NGC 488, we have studied a family of models varying the vertical scale height of the disk within 0.5 - 0.8 kpc, and the vertical velocity dispersion within the observational errors 10 . Table 4 summarizes the equilibrium and the stability properties of the models. In accordance with measurements, the stellar radial velocity dispersion at the disk center varies in the models within 137 - 161 km/s. The surface density at the disk center changes within 1.25 109 - 1.75 109 M⊙ kpc-1.
Right panel of Figure 12 shows the results of our nonlinear simulations for one of the models of the galaxy NGC 2985. In this particular model, the radial scale length of the surface density distribution was chosen to be 3.1 kpc ( ). The vertical and the radial velocity dispersions are taken 137 km/s and 117 km/s respectively, and the vertical scale height of the disk density distribution is equal to 0.8 kpc. With these parameters, the total mass of the disk is 7.14 1014 M⊙. The simulations start from noise perturbations of amplitute of order of 10-15. We find that the initial amplitude of perturbations does not affect the properties of an emerging spiral pattern, and determines only a duration of a linear exponential growth phase.
Soon after the beginning of simulations, global spiral mode emerges from the arbitrary noise, and prevails over other unstable modes until the nonlinear saturation phase is reached. The right panel of Figure 12 shows a two-dimensional contour plot of the density distribution taken at time 2.74 109 years from the beginning of simulations. The theoretical pattern shows good qualitative agreement with the observed spiral arms in the galaxy NGC 2985. In the inner regions, the theoretical arms are more open compared to the observed ones. A disagreement between the observed and the theoretical spiral patterns in the inner parts of the galactic disk can be probably be attributed to the uncertainty of our knowledge of the disk properties within the bulge region. Within all observational errors, however, the two-armed spiral pattern prevails over other unstable modes, and determines the properties of perturbations in the disk of NGC 2985.
3.5 NGC 3938
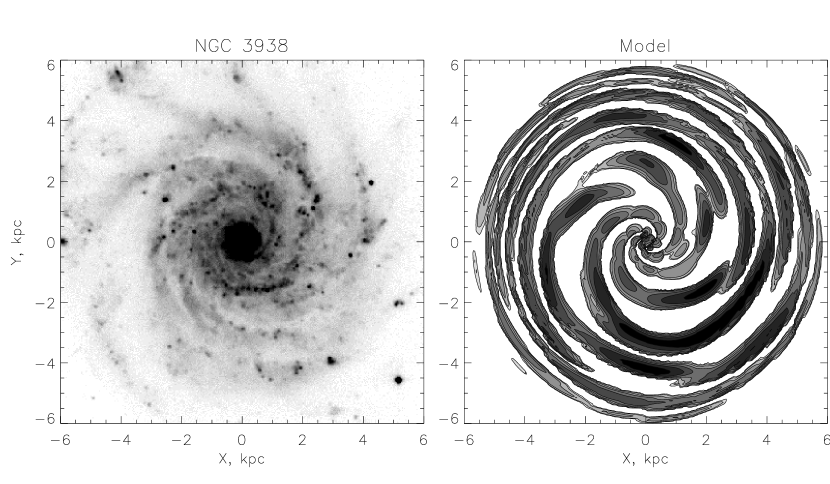
NGC 3938 is an Sc galaxy that has an inclination of about , and distance of 11.3 Mpc (Jiménez-Vicente et al. 1999). The left panel of Figure 14 shows the I-band image of NGC 3938 obtained with the Mauna Kea 2.2m telescope (Tully et al. 1996), taken from the NED archive. As can be seen from the Figure, NGC 3938 is a typical multi-armed spiral with the spiral arms branching from its center.
The rotation curve and the velocity dispersion of NGC 3938 have been measured, allowing us to build an equilibrium model for this galaxy. In Figure 15 is plotted the rotation curve of NGC 3938 taken from Jiménez-Vicente et al. (1999). A solid line shows our best fit to the observational data we use in our numerical simulations.
The rotation curve and the velocity dispersion of NGC 3938 have been measured, allowing us to build an equilibrium model for this galaxy. In Figure 15 is plotted the rotation curve of NGC 3938 taken from Jiménez-Vicente et al. (1999). A solid line shows our best fit to the observational data we use in our numerical simulations.
The stellar velocity dispersion profile of NGC 3938 was measured by Bottema (1988). Due to the small inclination of NGC 3938, the line of sight velocity dispersion is determined mainly by the component of the velocity dispersion perpendicular to the disk. Bottema (1988) finds that the z-component of the velocity dispersion can be described by an exponential function with a velocity dispersion at the disk center of 355 , and a scale length of 3.3 kpc. The velocity dispersion measurements of Bottema (1998) together with the velocity dispersion profiles used in our models are also plotted in Figure 15.

The thickness of the disk of nearly face-on NGC 3938 can be estimated using velocity dispersion measurements. In a rotating self-gravitating disk in equilibrium, the disk vertical scale height, , is related to the maximum rotation velocity and to the radial scale length of the exponential density distribution, , as (Freeman 1970):
| (7) |
The disks of real galaxies are supported by the combined disk self-gravity and halo potential. Bottema (1997) estimates that the disk of NGC 3938 can account for about 60 percent of the maximum rotational velocity of the disk. With this assumption, and taking the velocity dispersion at the disk center equal to 35 km/s and the radial scale length of the disk density distribution of 1.65 kpc, we find that the vertical scale height of the disk density distribution in NGC 3938 is about 0.2 kpc. We use models with a vertical scale height between 0.125 and 0.25 kpc. We find that with the scale heights larger than 0.25 kpc the disk of NGC 3938 is stable against spiral perturbations.
Table 5 summarizes the studied models and their stability properties. The linear stability analysis shows that the models are the most unstable towards the and global modes, which grow with the comparable rates. The superposition of the three-armed and the four-armed spirals of approximately equal amplitudes determines the multi-armed appearance of NGC 3938.
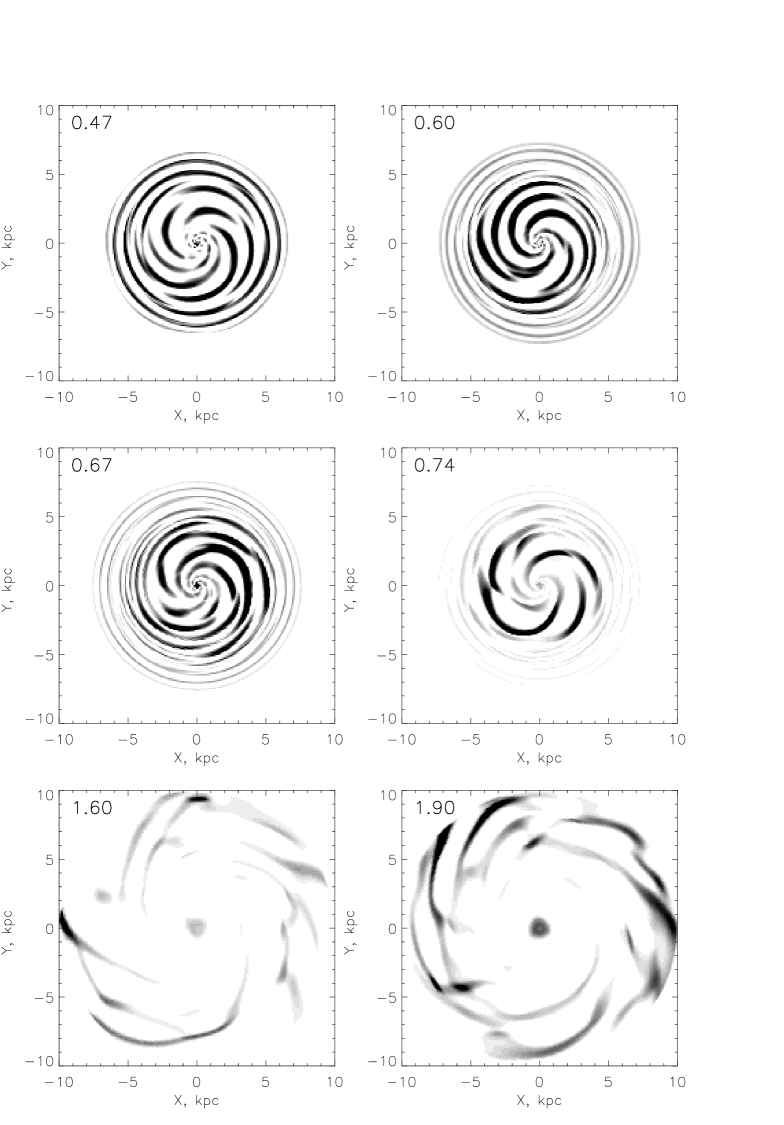
The nonlinear simulations confirm this conclusion. Figure 16 shows the time dependence of the global amplitudes for spirals calculated for model in Table 5. The simulation starts with the equilibrium disk seeded with noise perturbations with an amplitude of 10-6 of the equilibrium disk surface density. In agreement with the linear analysis, the disk is most unstable towards and spirals with the four-armed spiral slightly dominating over other competitors. The right panel of Figure 14 shows a snapshot of our nonlinear simulation taken at 0.7 109 years. As one can see, the disk indeed generates a multi-armed spiral pattern qualitatively resembling the observed spiral pattern.

As in the most of our hydrodynamical simulations, soon after the nonlinear saturation stage (about 0.9 Gyr for the model ), the spiral pattern re-organises itself, and the spiral arms are usually destroyed in the central regions of the disk. Typically, the mass concentration grows near the center, and the spiral pattern fragments into a few orbiting clumps. Figure 17 shows the evolution of the density perturbations in our model during approximately 2 Gyr. During the exponential growth phase, that lasts about 0.9 Gyr, and at the beginning of the nonlinear saturation phase, the spiral pattern keeps its multi-armed nature. However, in the outer regions of the disk, the spiral armlets can be seen at the later stages of evolution as well (see, e.g., the last two frames of Figure 17). These armlets are associated with the density clumps, and can be a result of swing amplified reaction of the disk to the perturbations imposed by the clumps’ gravitational force.
3.6 NGC 6503
NGC 6503 is a highly inclined (inclination of 74) late-type spiral Sc galaxy, which is the nearest object in our sample at a distance of 6 Mpc (Bottema 1989). The rotation of NGC 6503 has been studied by a number of authors. We use the HI rotation curve taken from Begeman et al. (1991). The observed rotation curve was fit to equation (3), and both the observations and fit (Figure 18) show good agreement with the measurements of Karachentsev & Petit, (1990), and de Vaucouleurs & Caulet(1982). The rotation velocity reaches a maximum value of about 120 km s-1, and remains nearly constant in the outer regions of the disk.
The stellar velocity dispersion in NGC 6503 was studied by Bottema (1989). The orientation of NGC 6503 enables one to measure the transverse components of the velocity dispersion in the disk. Bottema’s measurements yield a value for the radial component of the velocity dispersion at the disk center of 55 10 , and a kinematical scale length of 80′′ - twice as large as the photometric scale length of the disk. The observed line-of-sight velocity dispersion of stellar disk in NGC 6503, together with the exponential fits to the physical velocity dispersion in R-direction are shown in Figure 18.
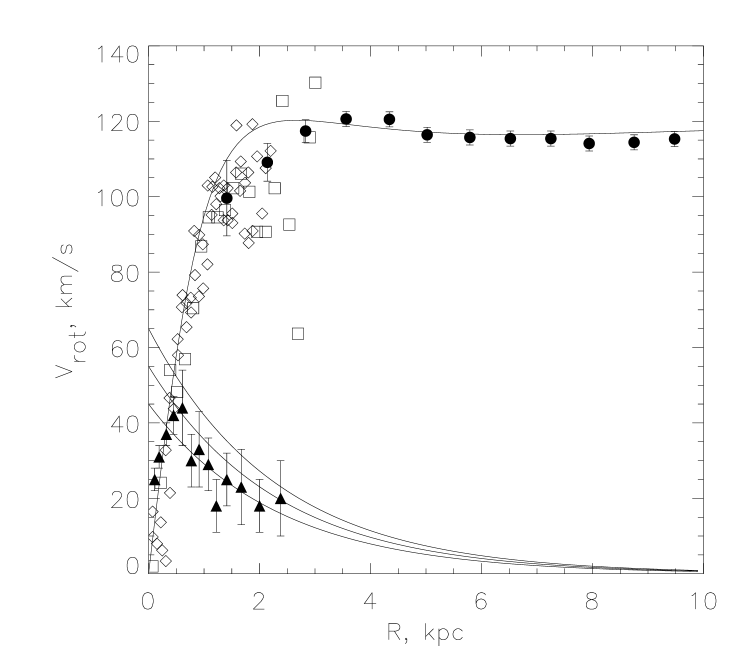
A peculiar feature of NGC 6503 is an abrupt drop of the disk velocity dispersion near its center, which Bottema & Gerritsen (1997) speculate is related to a component that is kinematically distinct from the disk. Another peculiarity is the existence of two exponential scale lengths in the surface brightness distribution of its disk. In the inner regions (), the scale length is about 40′′, while in the outer regions of the disk the scale length is about 80′′ (Bottema 1989).
Using the rotation curve and the velocity dispersion profile along the radius of the disk, we have built a set of equilibrium models for NGC 6503. As in the previous cases, we consider locally stable disks with Toomre Q-parameter Q 1.0. The models, listed in Table 6, are the disks with an exponential surface density distribution that have a scale length of 1.16 kpc (40′′) and a kinematical radial scale length equal to 2.32 kpc (80′′). The radial component of the velocity dispersion at the disk center was taken to be 55 10 , which yields a total mass for the disk of 4 - 7 109 M⊙. To explore the peculiar properties of NGC 6503, we also studied a model that has two exponential scale lengths in the disk density distribution, and a model with a drop of the velocity dispersion near the disk center. Remarkably, all models demonstrate a similar behavior. becoming unstable towards the , and modes which have comparable growth rates, resulting in a multi-armed appearance of spiral pattern.
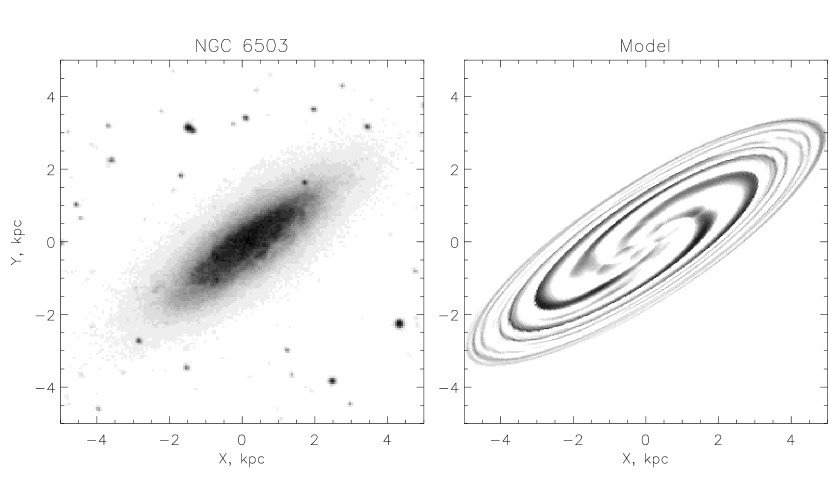
Nonlinear modeling confirms this conclusion. In agreement with the linear analysis, the time dependence of the global Fourier amplitudes presented in Figure 19 shows that the disk is most unstable towards global mode. Later on, harmonics as well as the global models with a higher number of arms reach a comparable amplitude, which results in a multi-armed appearance of the spiral pattern observed in the disk of NGC 6503. The right panel of 20 shows the results of the nonlinear simulations for model ”d”. In this model, a velocity dispersion at the disk center of 55 km/sec was adopted, the ratio of the vertical to the radial velocity dispersions was taken as 0.7, and the vertical scale height of the disk density distribution was taken as 0.17 kpc. The total mass of the disk is then about 5.2 109 M⊙. The surface density contour plot taken at time 109 years reproduces qualitatively well the observed multi-armed morphology of the galaxy.

4 Summary and Discussion
We have studied the applicability of the global modes as an explanation for the spiral structure of disk galaxies. We selected six nearby spiral galaxies with measured axisymmetric background properties for their disks. Using the observed radial distributions for the stellar velocity dispersions and the disk rotation velocities, we constructed equilibrium properties for the galactic disks in each galaxy and implemented two independent theoretical analyses of the spiral structure in the disks. Using linear global modal analysis, we determine the set of unstable global modes existing in the disk of each particular galaxy. We then use 2-D nonlinear hydrodynamical simulations to model the dynamics of the galactic disks seeded initially with noise perturbations which have relative amplitudes on the order of 10-6 – 10-12. The net result of our work is that both kinds of theoretical analyses predict spiral patterns in the disks of the particular galaxies which agree qualitatively with the observed morphological properties of spirals.
We find that the overall morphological properties of the spiral patterns are largely insensitive to the details of the models, such as the thickness of the galactic disks, or the ratio of the velocity dispersions within observational error limits. Massive disks with a high stellar velocity dispersion in their central regions have a tendency to support two-armed spirals. Examples are the galaxies NGC 1566, NGC 488 and NGC 2985. The disk of NGC 628 has somewhat ’intermediate’ properties with the two-armed and three-armed spiral modes having comparable growth rates. The velocity dispersion in the central region of NGC 628 is less than 100 , and its evolution is determined by a tight competition of the two-armed, and three-armed spirals. Two Sc galaxies in our sample, NGC 3938 and NGC 6503, have low-mass disks and low velocity dispersions, which result in a multi-armed spiral structure. This agrees with the conclusion of Evans Read (1998) who found that the three-armed or four-armed spirals occur only in disks with low velocity dispersion.
The theoretical spiral pattern in Sab galaxy NGC 2985, and especially in Sb galaxy NGC 488 is more open when compared to the observed spirals. The reason for this might be in the uncertainties related to the bulge-disk decomposition, and to a contribution of the bulge component to the dynamics of spiral patterns. However, the overall morphology of the spiral patterns in NGC 488 and NGC 2985 is correctly predicted by the global modal approach.
An over-reflection of the spiral density waves, i.e. transmission and larger amplitude reflection at the corotation resonance of the spiral wave trains, is seen by Lin and his collaborators as a physical explanation of the excitation mechanism for the global modes in gravitating disks (Lau et al. 1976). From our numerical simulations, it is hard to depict the radially propagating wave trains that ”over-reflect” at the corotation resonance. Nevetheless, we calculated an amplification factor of spirals based on this picture. Drury (1980) developed an analytical method to calculate the reflection and transmission coefficients for the global modes in an unstable shearing gas sheet. The amplification factor was calculated for , and spiral modes for all six galaxies in our sample. Usually, a dominant spiral mode has the highest amplification factor. The amplification factor for the spiral mode is largest in the disks of the two-armed spiral galaxies NGC 488, NGC 1566 and NGC 2985. In the multi-armed spiral galaxies NGC 3938 and NGC 6503, the amplification factors for , and modes are dominant. This result can be considered as a hint that the amplification at the corotation resonance might indeed be at work in growing spiral modes.
According to Toomre (1981), the essence of the growing modes can be understood in terms of the swing amplification. For a constant disks, the swing amplification is strongest for a dimensionless ‘unwrapped’ wavelength of about 1.5 (Toomre 1981). In this model,
where m is a number of arms, and is a ratio of halo radial force to the unperturbed disk force (Binney & Tremaine 1987). In the low-mass disk, the ratio is large, and the multi-armed spirals are swing-amplified. This is in a qualitative agreement with our results showing that the low-mass disks with low velocity dispersion support multi-armed spiral pattrens. A further study, however, is needed to make a conclusion as to whether the growth of the spiral global modes is explained by a swing amplification mechanism.
What can be concluded from our simulations as to whether the spiral patterns in galaxies are a long-lived or a short-lived phenomenon, regenerated many times during the galactic evolution? The theoretical spiral patterns make typically about ten revolutions in our simulations. Usually, after the nonlinear saturated stage of instability starts, the modes grow to sufficiently large amplitudes, and shocks occur. The shocks dissipate energy and eventually destroy the spiral pattern. At this highly nonlinear stage, the hydrodynamical approximation is inadequate for the description of the collisionless stellar disks. The is one example, the galaxy NGC 1566, in which the nonlinear coupling of the modes stabilizes an exponential growth before the pattern disruption by shocks occurs, and the two-armed spiral pattern exists throughout the nonlinear saturated stage.
A duration of the exponential growth of a spiral pattern until it is disrupted by the nonlinear effects is about one - two Gyr. This gives an upper limit on the number of such regenerations to be about of a few during the galactic evolution. The example of NGC 1566 shows however, that the spiral pattern can exist during a nonlinear saturation phase as well, indicating that the spiral structure in galactic disks can indeed be a long-lived phenomenon.
Further study of the dynamics of collisionless disks is of principal importance in clarifying this question.
Acknowledgements.
The authors thank S.Shore, A. Toomre and J. Kenney for valuable comments, and J. Gerssen and K. Kuijken for providing data on NGC 488 and NGC 2985. The authors thank also T.M. Girard, W.F. van Altena, D. Maitra and R. Quadri for reading the manuscript, which resulted in in mproved presentation. A. Moiseev thanks the Russian Science Support Foundation. This research has made use of the NASA/IPAC Extragalactic Database (NED) which is operated by the Jet Propulsion Laboratory, California Institute of Technology, under contract with the National Aeronautics and Space Administration. Some of the data presented in this paper were obtained from the Multimission Archive at the Space Telescope Science Institute (MAST). STScI is operated by the Association of Universities for Research in Astronomy, Inc., under NASA contract NAS5-26555. Support for MAST for non-HST data is provided by the NASA Office of Space Science via grant NAG5-7584 and by other grants and contracts.References
- (1) Adams, F.C., Ruden, S.P., & Shu, F.H. 1989, ApJ, 347, 959
- (2) Begeman, K., Broelis, A.H., & Sanders, R.H. 1991, MNRAS, 249, 523
- (3) Bertin, G., Lin, C. C., Lowe, S. A., & Thurstans, R. P. 1989a, ApJ, 338, 78
- (4) Bertin, G., Lin, C. C., Lowe, S. A., & Thurstans, R. P. 1989b, ApJ, 338, 104
- (5) Binney, J., & Tremaine, S. 1987, Galactic Dynamics, Princeton University Press, Princeton, New Jersey.
- (6) Bottema, R. 1992, A&A, 257, 69
- (7) Bottema, R. 1989, A&A, 221, 236
- (8) Bottema, R. 1988, A&A, 197, 105
- (9) Bottema, R. 1997, A&A, 328, 517
- (10) Bottema, R., & Gerritsen, J. P. 1997, MNRAS, 290, 585
- (11) Dehnen, W, & Binney, J. 1998, MNRAS, 298, 387
- (12) Drimmel, R., & Spergel, D. 2001, ApJ, 556, 181
- (13) Carollo, C. M., Stiavelli, M., de Zeeuw, P. T., & Mack, J. 1997, AJ, 114, 2366
- (14) de Grijs, R., Peletier, R. F., & van der Kruit, P. C. 1997, A&A, 327, 966
- (15) de Vaucouleurs, G., & Caulet, A. 1982, ApJS, 49, 515
- (16) Drury, L. 1980, MNRAS, 193, 337
- (17) Elmegreen, B. G., & Elmegreen, D. M. 1990, ApJ, 355, 52
- (18) Evans, N. W., Read, J. C. A. 1998, MNRAS 300, 106
- (19) Freeman, K.C. 1970, ApJ, 160, 811
- (20) Fuchs, B. 1997, 328, 43
- (21) Fuchs, B. 2001a, MNRAS, 325, 1637
- (22) Fuchs, B. 2001b, A&A, 368, 107
- (23) Gerssen, J., Kuijken, K., Merrifield, M. R. 1997, MNRAS, 288, 618
- (24) Gerssen, J., Kuijken, K., Merrifield, M. R. 2000, MNRAS, 317, 545
- (25) Goldreich, P., Lynden-Bell, D. 1965, MNRAS, 130, 125
- (26) Grosbol, P. J. 1985, A&AS, 60, 261
- (27) Hunter, C. 1979, ApJ, 227, 73
- (28) Jiménez-Vicente, J., Battaner, E., Rozas, M., et al. 1999, A&A, 342, 417
- (29) Julian, W. H., Toomre, A. 1966, ApJ, 146, 810
- (30) Kamphuis, J., & Briggs, F. 1992, A&A, 253, 335
- (31) Karachentsev, I., & Petit, M. 1990, A&AS, 86, 1
- (32) Kent, S.M. 1985, ApJS, 59, 115
- (33) Kikuchi, N., Korchagin, V., Miyama, S. M. 1997, ApJ, 478, 446
- (34) Knapen, J.H., Stedman, S., Bramich, D.M., Folkes, S.L., & Bradley, T.R. 2004, AA, 426, 1135
- (35) Korchagin, V., Kikuchi, N., Miyama, S. M., et al. 2000, ApJ, 541, 565
- (36) Korchagin, V.I., Girard, T.M., Borkova, T.V., Dinescu, D.I., & van Altena, W.F. 2003, AJ, 126, 2896
- (37) Lacey, C.G. 1984, MNRAS, 208, 687
- (38) Larsen, S. S., Richtler, T. 1999, A&A, 345, 59
- (39) Laughlin, G., Korchagin, V., & Adams, F. 1998, ApJ, 504, 945
- (40) Lin, C. C., Yuan, C., & Shu, F. H. 1969, ApJ, 155, 721
- (41) Marochnik, L.S. 1966, AZh, 43, 91
- (42) Merrifield, M.R. 2001, ASP Conference Series, Vol. 230, 221
- (43) Mishurov, Yu. N., Pavlovskaya, E. D., & Suchkov, A. A. 1979, AZh, 56, 268
- (44) Peletier, R.F., Valentijn, E. A., Moorwood, A. F. M., et al., 1995, A&A, 300, 1
- (45) Persic, M., & Salucci, P. 1995, ApJS, 99, 501
- (46) Peterson, C. J. 1980, AJ, 85, 226
- (47) Puerari, I., Dottori, H. A. 1992, A&AS, 93, 469
- (48) Puerari, I., Block, D.L., Elmegreen, B.G., Frogel, J.A., & Eskridge, P.B. 2000, A&A, 359, 932
- (49) Roberts, W. W., Roberts, M. S., & Shu F. H. 1975, ApJ, 196, 381
- (50) Sandage, A., Bedke, J. 1994, The Carnegie Atlas of Galaxies, Volume 1
- (51) Sellwood, J. A. 2000, Ap&SS, 272, 31
- (52) Sersic, J. L. 1968, Atlas de Galaxias Australes, (Cordoba: Obs. Astron., Univ. Nac. Cordoba)
- (53) Shapiro, K. L., Gerssen, J., & van der Marel R.P. 2003, AJ,
- (54) Sil’chenko, O.K. 1999, Astron. Lett., 25, 140
- (55) Sygnet, J. F., Pellat, R., & Tagger, M. 1987, Phys. Fluids, 30, 1052
- (56) Toomre, A. 1964, ApJ, 139, 1217
- (57) Toomre, A. 1981, The structure and evolution of normal galaxies, (Cabridge: Cambridge Univ. Press), p 111
- (58) Tully, R. B., Verheijen, M. A., Pierce, M. J., et al. 1996, AJ, 112, 2471
- (59) van der Kruit, P. C., Freeman, K. C. 1984, ApJ, 278, 81
- (60) van der Kruit, P. C., Searle, L. 1982, A&A, 110, 61
- (61) Vauterin, P., & Dejonghe, H. 1996, A&A, 313, 465
- (62) Vera-Villamizar, N., Dottori, H., Puerari, I., de Carvalho, R. 2001, ApJ, 547, 187
- (63) Villumsen, J.V. 1985, ApJ, 290, 75
| Model | (, Im) | ||||||
|---|---|---|---|---|---|---|---|
| (km s-1) | (kpc) | () | () | () | |||
| a | 120 | 0.5 | 0.30 | 3.43 | 3.64 | 1.49 | (42.6, 7.9) |
| b | 120 | 0.6 | 0.35 | 2.94 | 3.12 | 1.44 | (49.5, 9.6) |
| c | 120 | 0.7 | 0.45 | 2.29 | 2.43 | 1.58 | (46.2, 4.1) |
| d | 120 | 0.8 | 0.50 | 2.06 | 2.18 | 1.55 | (50.9, 8.8) |
| e | 148 | 0.5 | 0.40 | 3.92 | 4.15 | 1.60 | (32.8, 3.7) |
| f | 148 | 0.6 | 0.45 | 3.48 | 3.70 | 1.51 | (41.3, 7.3) |
| g | 148 | 0.7 | 0.55 | 2.85 | 3.02 | 1.57 | (42.8, 5.4) |
| h | 148 | 0.8 | 0.60 | 2.61 | 2.77 | 1.52 | (48.6, 14.2) |
| i | 176 | 0.5 | 0.45 | 4.93 | 5.22 | 1.50 | (31.1, 4.0) |
| j | 176 | 0.6 | 0.50 | 4.43 | 4.70 | 1.42 | (40.2, 10.0) |
| k | 176 | 0.7 | 0.60 | 3.69 | 3.91 | 1.44 | (42.9, 9.2) |
| l | 176 | 0.8 | 0.75 | 3.02 | 3.20 | 1.47 | (48.9, 12.5) |
| Model | , Im | ||||
|---|---|---|---|---|---|
| (km s-1) | () | () | () | ||
| a | 285 | 2.6 | 10.9 | 1.7 | stable |
| b | 285 | 3.0 | 13.5 | 1.45 | (52.5, 14.7) |
| c | 285 | 3.2 | 14.6 | 1.34 | (57.0, 19.4) |
| d | 285 | 3.5 | 15.9 | 1.23 | (62.2, 25.3) |
| e | 285 | 3.9 | 17.5 | 1.11 | (68.4, 32.8) |
| f | 285 | 4.1 | 18.2 | 1 | |
| g | 253 | 2.3 | 10.2 | 1.7 | stable |
| h | 253 | 2.6 | 11.7 | 1.5 | (55.2, 11.9) |
| i | 253 | 3.0 | 13.5 | 1.3 | (63.4, 19.2) |
| j | 253 | 3.2 | 14.6 | 1.2 | (67.8, 24.4) |
| k | 253 | 3.5 | 15.9 | 1.1 | (74.9, 31.7) |
| l | 253 | 3.8 | 16.9 | 1 | |
| m | 221 | 2.1 | 9.3 | 1.65 | stable |
| n | 221 | 2.4 | 11.0 | 1.5 | (61.8, 12.1) |
| o | 221 | 2.6 | 11.7 | 1.32 | (65.9, 15.4) |
| p | 221 | 2.8 | 12.5 | 1.24 | (70.1, 19.1) |
| q | 221 | 3.0 | 13.5 | 1.15 | (75.0, 23.8) |
| r | 221 | 3.2 | 14.4 | 1 |
| Model | , Im | ||||||
|---|---|---|---|---|---|---|---|
| (km s-1) | (kpc) | () | () | () | |||
| a | 70 | 0.5 | 0.35 | 1.0 | 5.1 | 1.31 | 3 (30.9, 8.6) |
| b | 70 | 0.6 | 0.4 | 0.9 | 4.5 | 1.25 | 3 (35.5, 9.4) ; 4 (36.5, 8.2) |
| c | 70 | 0.7 | 0.45 | 0.8 | 4.0 | 1.2 | 3 (38.5, 9.2) ; 4 (40.1, 8.9) |
| d | 70 | 0.8 | 0.5 | 0.7 | 3.3 | 1.17 | 3 (41.1, 8.5) ; 4 (43.1, 9.2) |
| e | 99 | 0.5 | 0.5 | 1.4 | 7.3 | 1.31 | 2 (21.9, 12.0); 3 (25.8, 9.7) |
| f | 99 | 0.6 | 0.6 | 1.2 | 6.0 | 1.31 | 2 (23.4, 10.1); 3 (28.5, 9.4) |
| g | 99 | 0.7 | 0.7 | 1.0 | 5.2 | 1.32 | 2 (24.2, 7.7); 3 (30.6, 8.8) |
| h | 99 | 0.8 | 0.75 | 0.95 | 4.8 | 1.23 | 3 (34.5, 10.8); 4 (35.4, 9.1) |
| i | 130 | 0.5 | 0.65 | 1.9 | 9.4 | 1.31 | 2 (19.4, 12.6); 3 (21.8, 8.8) |
| j | 130 | 0.6 | 0.7 | 1.7 | 8.8 | 1.17 | 2 (24.2, 18.5); 3 (27.1, 14.9) |
| k | 130 | 0.7 | 0.8 | 1.5 | 7.7 | 1.16 | 2 (26.5, 18.5); 3 (29.9, 16.4) |
| l | 130 | 0.8 | 0.95 | 1.3 | 6.0 | 1.19 | 2 (27.0, 14.9); 3 (31.5, 14.3) |
| Model | , Im | ||||
|---|---|---|---|---|---|
| (km s-1) | () | () | () | ||
| a | 161 | 1.25 | 5.0 | 1.46 | 2(64.6,7.4); 3(98.0,6.0) |
| b | 161 | 1.5 | 6.2 | 1.19 | 2(79.7,15.9); 3(114.2,12.90 |
| c | 161 | 1.75 | 7.2 | 1.02 | 2(93.5,24.5); 3(129.2,20.8) |
| d | 149 | 1.25 | 5.0 | 1.35 | 2(71.3,8.9); 3(110.6,8.2) |
| e | 149 | 1.5 | 6.2 | 1.10 | 2(87.6,17.8); 3(110.6,8.2) |
| f | 149 | 1.62 | 6.7 | 1.02 | 2(55.0,22.3); 3(137.0,21.5) |
| g | 137 | 1.25 | 5.0 | 1.24 | 2(78.7,10.4); 3(124.7,10.4) |
| h | 137 | 1.5 | 6.2 | 1.02 | 2(96.5,19.3) 3(146.3,20.8) |
| Model | , Im | ||||||
|---|---|---|---|---|---|---|---|
| (km s-1) | (kpc) | () | () | () | |||
| a | 30 | 0.6 | 0.125 | 0.51 | 0.97 | 1.13 | 4(53.9, 9.5) |
| b | 30 | 0.7 | 0.135 | 0.48 | 0.90 | 1.05 | 4(56.5, 10.6) |
| c | 35 | 0.6 | 0.135 | 0.65 | 1.23 | 1.1 | 3(53.7, 13.0); 4(48.1, 13.7) |
| d | 35 | 0.7 | 0.16 | 0.55 | 1.04 | 1.0 | 3(51.8, 8.9); 4(62.1, 13.0) |
| e | 40 | 0.6 | 0.15 | 0.76 | 1.44 | 1.0 | 3(53.6, 15.3); 4(51.6, 15.4) |
| f | 40 | 0.7 | 0.175 | 0.65 | 1.24 | 1.0 | 3(55.6, 14.0); 4(56.4, 16.7) |
| g | 30 | 0.5-0.8 | 0.2 | 0.32 | 0.62 | 1.36-1.92 | stable |
| h | 35 | 0.5-0.8 | 0.2 | 0.44 | 0.84 | 1.16-1.6 | stable |
| i | 40 | 0.5-0.6 | 0.2 | 0.57 | 2.74 | 1.25-1.45 | stable |
| j | 40 | 0.7 | 0.2 | 0.57 | 2.74 | 1.16 | 3(51.3, 8.0); 4(55.6, 9.9) |
| k | 40 | 0.8 | 0.2 | 0.57 | 2.74 | 1.02 | 3(54.9, 11.7); 4(53.3, 13.9) |
| l | 40 | 0.8 | 0.25 | 0.46 | 0.88 | 1.27 | stable |
| Model | , Im | ||||
|---|---|---|---|---|---|
| (km s-1) | () | () | () | ||
| a | 45 | 0.46 | 0.39 | 1.3 | stable |
| b | 45 | 0.55 | 0.47 | 1.09 | 3(48.0, 6.8); 4( 44.6, 8.9); 4(54.9, 9.6) |
| c | 55 | 0.6 | 0.5 | 1.25 | stable |
| d | 55 | 0.62 | 0.52 | 1.19 | 3(47.6, 7.4); 4(41.7, 8.2); 4(62.8, 7.0) |
| e | 55 | 0.69 | 0.59 | 1.06 | 3(48.5, 11.8); 4(44.8, 12.5); 4(50.9, 14.0) |
| f | 65 | 0.65 | 0.55 | 1.3 | stable |
| g | 65 | 0.69 | 0.59 | 1.27 | 3(43.1, 8.1); 4(43.6, 8.3); 4(48.9, 9.0) |
| h | 65 | 0.73 | 0.62 | 1.2 | 3 (45.0, 10.2); 4(43.2, 10.3); 4(50.5, 11.0) |
| i | 65 | 0.84 | 0.71 | 1.04 | 3(50.5, 17.1); 4(54.8, 18.4); 4(65.2, 18.8) |