The Millennium Galaxy Catalogue: The nearby supermassive black hole mass function
Abstract
We highlight the correlation between a galaxy’s supermassive black hole mass and the Sérsic-index of the host spheroid or bulge component. From our bulge-disk decompositions of 10 095 galaxies, drawn from the Millennium Galaxy Catalogue, we construct the local () mass function of supermassive black holes. We compare our results to those of McLure & Dunlop (2004) and conclude that the mass density of supermassive black holes may be marginally higher than previously supposed. This increase is predominantly due to the inclusion of low mass and later-type bulges. More details will be presented in a forthcoming paper.
RSAA, Mount Stromlo Observatory, AUSTRALIA
ESO, Garching, GERMANY
1 Introduction
Supermassive black holes (—M⊙) have now been identified through core velocity measurements for nearby systems, see for example the compendium of Ferrarese & Ford [8]. The formation mechanism of these super massive black holes remains uncertain. Silk & Rees [23] advocate formation directly through initial monolithic collapse whereas Croton et al. [2] advocate a gradual build-up through successive mergers. It is also unclear whether central black holes occur within all spheroidal, bulge and possibly nucleated systems. In particular, their existence (or the existence of intermediate-massive black holes), in dwarf systems is currently being pursued with no definitive result as yet, although see [27]. As well as their recent detection we are also now aware of the tight correlation between the black hole mass and the global velocity dispersion () of the bulge or spheroid which they inhabit [7],[10]. From the relation [6] it also follows that there is a correlation between the black hole mass and the bulge-luminosity, albeit possibly non-linear [17].
Here we highlight a third correlation between the concentration of a galaxy bulge or spheroid and the supermassive black hole mass [12]. This correlation is to be expected given the known relation between the luminosity, velocity dispersion and concentrations of nearby spheroid and bulge systems [26], [13]. Which of the three relations (, or ) is the more fundamental is not yet clear. In practical terms the Sérsic index is arguably the easier to measure as it a purely photometric quantity requiring neither kinematic observations () nor absolute photometric calibration ().
2 Concentration and the Sérsic index
The concentration of a galaxy’s light is typically given as the ratio of two radii. For example the SDSS adopt the radius which encompasses 90% of the total flux divided by the radius which encompasses 50% of the total flux, i.e.,
.
Alternate definitions are in common practice which use different ratios (e.g., [1] who use for example). The concentration index can be related analytically to the Sérsic index (see recent review by [15]) of the projected light-profile [13], where the Sérsic intensity model ([21], [22]), is given by:
,
where I(r) is the intensity at radius, r, the central intensity, the scale-length, and the Sérsic index or profile shape parameter. Note that refers to the traditional exponential profile [9] and the traditional de Vaucouleurs profile [3]. A value of represents a Gaussian-shaped profile (see Fig. 1).

3 The SMBH-n correlation
Fig. 2(left) shows the relation while Fig. 2(right) shows the relation for the same systems. The linear fits are by ordinary least squares regression assuming a 20% uncertainty on n. Both distributions show a strong correlation with comparable (linear) Pearson, , and (non-linear) Spearman, , rank-order coefficients. Work is underway to add the remaining dozen or so systems to this plot for which reliable black hole masses and distances are accurately known. Two further issues are worth mentioning. (1) The Sérsic-index measurements are predominantly made in the filter. While this is less susceptible to dust attenuation/distortion (and particularly for the spiral galaxy bulges), near-IR profiles would be more optimal as the Sérsic index can be wavelength dependent (because of dust which is more centrally concentrated than the stars). (2) The sample is not entirely random but reflects those systems sufficiently nearby such that black hole mass constraints can be obtained. As we live in a specific region of the Universe (a loose group) this may bias our sample in some unforeseeable way. However, as the loose group environment appears to be the most common [5] any bias is likely to be small and subtle. The best linear fit to our data is:
| (1) |
This relation can be used to construct the SMBH mass function for any sample of galaxies for which the Sérsic-index has been measured. As measuring the Sérsic-index is much easier than the (bulge) velocity dispersion, which can be particularly problematic to measure for late-type systems due to disk/bulge contributions, one might expect the mass function derived via this method to be more robust.

4 The MGC and bulge-disk decomposition
The Millennium Galaxy Catalogue (MGC, [16], [4]) has been discussed in two earlier talks at this meting (see Allen and Liske these proceedings). It constitutes a 37.5 sq degree imaging survey along the Northern Spring equatorial strip with redshift information for % of the galaxies for mag. The sample has a median redshift of and bulge-disk decomposition using GIM2D [24] has now been completed for all 10 095 systems (Allen et al. these proceedings). The survey has been used to constrain estimates of the nearby luminosity function [16] as well as measure the joint luminosity-surface brightness distribution [4]. Plans are afoot to expand the MGC program with additional data from VST and data from UKIRT/VISTA. The redshift survey will be extended to mag with AAT/AA and eventually to mag with Gemini/WFMOS.
5 The MGC-SMBH mass function
To construct the SMBH mass function we need to combine the relation shown in Eqn. 1 with the luminosity function of galaxy bulges (see Liske et al., these proceedings). Our approach is to assign a black hole mass to each galaxy (based on the Sérsic-index) and then adopt a weight for each galaxy dependent on the space-density of galaxies of that luminosity divided by the number of galaxies contributing to that calculation, i.e.,
| (2) |
Having established a list of weights, , and masses, one can then simply sum the product of these distributions, thus:
| (3) |
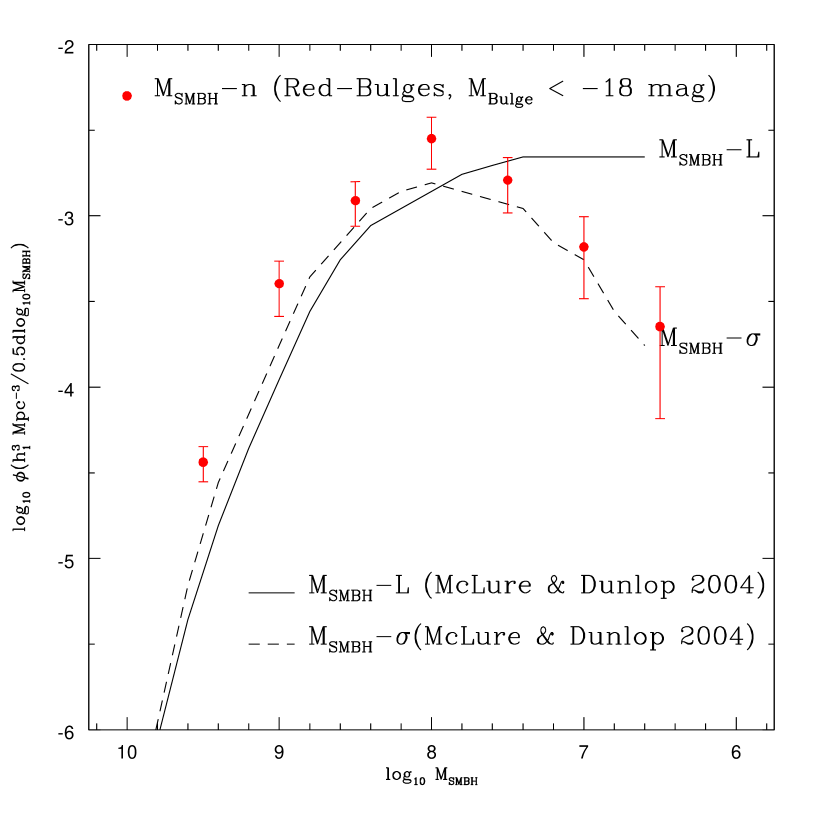
The result, shown in Fig. 3, includes genuine bulges but excludes pseudo-bulges (distinguished by their blue colours, see Liske et al. these proceedings). Also shown are recent estimates by [19] based on (dashed line) and (solid line) estimates for a sample of galaxies drawn from the Sloan Digital Sky Survey. The integral of this value leads to the total density of SMBHs which we tentatively find to be MMpc-3. This is somewhat higher than the McLure & Dunlop values most likely due to our inclusion of later-type bulges.
6 Conclusions
We have highlighted the correlation between the mass of the super massive black hole and the Sérsic index (i.e., the relation). This is first presented in [12] and followed up in [14]. The Sérsic index of spheroids and bulges is straightforward to measure and we have now done so for 10 095 galaxies drawn from the Millennium Galaxy Catalogue. Using the relation combined with our recent luminosity function estimate [4] we have now constructed the nearby mass function of super massive black holes. The shape of the distribution closely follows that found by [19] albeit with a slightly higher normalisation. We ascribe this to our method including all bulges whereas [19] exclusively focused on spheroids and early-type spiral systems. The result presented here will be presented in a more robust fashion in the forthcoming paper by Graham et al., in preparation.
Acknowledgements. The Millennium Galaxy Catalogue consists of imaging data from the Isaac Newton Telescope and spectroscopic data from the Anglo Australian Telescope, the ANU 2.3m, the ESO New Technology Telescope, the Telescopio Nazionale Galileo, and the Gemini Telescope. The survey has been supported through grants from the Particle Physics and Astronomy Research Council (UK) and the Australian Research Council (AUS). The data and data products are publicly available from http://www.eso.org/jliske/mgc/ or on request from J. Liske or S.P. Driver.
References
- [1] Bershady M.A., Jangren A., Conselice C.J., 2000, AJ, 119, 2645
- [2] Croton D., et al., 2005, MNRAS, in press (astro-ph/0508046)
- [3] de Vaucouleurs G., 1948, AnAp, 11, 247
- [4] Driver S.P., et al., 2005, MNRAS, 360, 590
- [5] Eke V.R., et al., 2005, MNRAS, 362, 1233
- [6] Faber S.M., Jackson R.E., 1976, ApJ, 204, 668
- [7] Ferrarese L., Merritt D., 2000, ApJL, 539, 9
- [8] Ferrarese L., Ford H., 2004, SSRv, 116, 523
- [9] Freeman K.C., 1970, ApJ, 160, 811
- [10] Gebhardt K., et al., 2000, ApJL, 539, 13
- [11] Ghez A.M., et al., 2003, ApJ, 586, L127
- [12] Graham A.W., Erwin P., Caon N., Trujillo I., 2001, ApJL, 563, 11
- [13] Graham A., Trujillo I., Caon N., 2001, AJ, 122, 1707
- [14] Graham A.W., et al., 2003, in Galaxy Evolution: Theory and Observations, RevMex AA (SC), eds., V.Avila-Reese, C.Firmani, C.S.Frenk, & C.Allen, vol. 17, 196-197
- [15] Graham A.W., Driver S.P., 2005, PASA, 22, 118
- [16] Liske J., et al., 2003, MNRAS, 344, 307
- [17] Matkovic A., Guzmán R., 2005, 362, 289
- [18] Maciejewski W., Binney J., 2001, MNRAS, 323, 831
- [19] McLure R.J., Dunlop J., 2004, MNRAS, 352, 1390
- [20] Merritt D., Ferrarese L., 2001, MNRAS, 320, L30
- [21] Sérsic J.,-L., 1963, BAAA, 6, 41
- [22] Sérsic J.,-L., 1968, Atlas de Galaxias Australes (Cordoba: Observatorio Astronomico)
- [23] Silk J., Rees M.J., 1998, A&A, 331, 1
- [24] Simard L., et al., 1999, ApJ, 519, 563
- [25] Tremaine S., et al. 2002, ApJ, 574, 740
- [26] Trujillo I., Graham A.W., Caon N., 2001, MNRAS, 326, 869
- [27] Valluri M., Ferrarese L., Merritt D., Joseph C.L., 2005, in press (astro-ph/0502493)
- [28]