Extinctions at 7m and 15m from the ISOGAL survey
The extinction laws at 7m and 15m are derived for more than 120 sightlines in the inner Galactic plane based on the ISOGAL survey data and the near-infrared data from DENIS and 2MASS. The tracers are the ISOGAL point sources with [7]-[15]0.4 which are RGB tip stars or early AGB stars with moderate mass loss. They have well-defined intrinsic color indices (J-Ks)0, (Ks-[7])0 and (Ks-[15])0. By a linear fitting of the observed color indices Ks-[7] and Ks-[15] to the observed J-Ks, we obtain the ratio between the E(Ks-[7]) and E(Ks-[15]) color excesses and E(J-Ks). We infer the selective extinctions at 7 and 15m in terms of the near-infrared extinction in the Ks band. The distribution of the derived extinctions around 7 micron (A7) is well represented by a Gaussian function, with the peak at about 0.47A and ranging from 0.33 to 0.55A (using the near-infrared extinctions of Rieke & Lebovsky 1985). There is some evidence that A7/AKs may vary significantly depending on the line of sight. The derived selective extinction at 15m suffers uncertainty mainly from the dispersion in the intrinsic color index (Ks-[15])0 which is affected by dust emission from mass-losing AGB stars. The peak value of A15 is around 0.40A.
Key Words.:
stars: AGB and post-AGB –stars: late-type – stars: mass loss – ISM: extinction – Infrared: stars1 Introduction
In the mid-infrared wavelength range, the interstellar extinction is basically composed of two components [see e.g. Draine, (1989)]. One is the continuum extinction decreasing with wavelength which can be attributed to graphite or PAH carbonaceous dust grains; the other relates to the spectral features around 10m and 18m due to silicate dust grains. The extinction around 7m is rather controversial, partly due to the fact that this wavelength is where the decreasing continuum extinction meets the rising silicate extinction peak. Before ISO (Infrared Space Observatory) was launched, there were several measurements of near-infrared and mid-infrared extinctions which could be used to derive that at 7m. Rieke & Lebofsky, (1985) observed o Sco and a number of stars in the Galactic center and derived the extinction law in the 1-13m range; Whittet, (1988) reobserved o Sco; Landini et al., (1984) observed hydrogen recombination lines from the obscured HII region G333.6-0.2. Draine, (1989) concluded that the available observational evidence was consistent with the power law A out to m (which means the extinction at 7m is about 0.13AK) and that the various extinction curves from different observations appear to be essentially universal for wavelengths m.
After the launch of ISO, new determinations were made of the extinction around 7m. Using ISO observations of hydrogen recombination lines, Lutz et al., (1996) and Lutz, (1999) found that the extinction toward Sgr A∗ does not decline with increasing in the 4-8m region, and obtained an extinction of about 0.45AK at 6.8m. However, from their studies using H2 rovibrational lines in the Orion molecular cloud outflow, Rosenthal et al., (2000) found that the extinction continues to decline with increasing to a minimum at about 6.5m, and the extinction at 7m is about 0.15AK, though their lower value may be attributed to the relatively modest extinction of the field they analyzed, AKs being only 1 mag. Moreover, by comparing the intensity of infrared dark clouds and their neighboring emission and assuming a simple radiative transfer model, Hennebelle et al., (2001) derived an average opacity radio of 7m to 15m of 0.70.1. The later two results from Rosenthal et al., (2000) and Hennebelle et al., (2001) are consistent with the result by Draine, (1989). The issues of whether the discrepancy between the results from Lutz, (1999) and from Rosenthal et al., (2000) or Hennebelle et al., (2001) is real or not and whether it could result from dust properties that depend on the line of sight need more investigation.
With data available from numerous lines of sight in the Galactic disk, the ISOGAL and GLIMPSE (Benjamin et al., 2003; Churchwell et al., 2004) projects provide an opportunity to study the dependence of the extinction on the interstellar dust environments.
The ISOGAL project is a survey of 263 fields, covering about 16 square degree area in total, in the Galactic plane. It made use of the ISOCAM camera aboard the ISO space telescope at 7m and 15m (Omont et al., 2003). Furthermore, most of the ISOGAL fields in the southern hemisphere were also observed by the DENIS project (Epchtein et al., 1999), in the IJKS bands. The ISOGAL data were systematically merged with DENIS in a five-wavelength catalog (Schuller et al., 2003). In the meantime, another ground-based near-infrared sky survey project, 2MASS, published data covering almost the whole sky, including the ISOGAL sky area. In combination with the DENIS and the 2MASS data, ISOGAL has great potential for studying the extinctions at 7 and 15m in the Galactic plane.
By combining J-Ks and Ks-[7] colors obtained from DENIS and ISOGAL (Omont et al., 2003; Schuller et al., 2003), we (Jiang et al., 2003) derived the selective extinction at 7 and 15m along the line of sight towards an ISOGAL field at l=18.3 and b=-0.35, obtaining A7 0.4AKs. Although this result suffers from some uncertainty, it is more consistent with Lutz et al., (1996) than with Rosenthal et al., (2000).
The most recent result concerning the mid-infrared extinction is from Spitzer. The GLIMPSE program observed a large part of the Galactic disk in four bands between 3.6 and 8m (Indebetouw et al., 2005). Indebetouw et al., (2005) found, along two lines of sight, that the extinction across the 3–8m wavelength range is flat, which agrees with Lutz, (1999), as well as ourselves (Jiang et al., 2003).
Given that the wide areas covered by ISOGAL and, more systematically, by GLIMPSE, include various sightlines (and thus various extinction environments) one can check whether the mid-IR extinction varies. The present paper aims at checking the extinction at 7 and 15m. We have used in principle the same method as in Jiang et al., (2003) to determine the extinction law at 7 and 15m from the ISOGAL fields. Since the ISOGAL fields are within the Galactic plane and lie mostly in the inner disk, this work mainly relates to the central parts of the Galactic plane.
2 Database
2.1 The ISOGAL PSC data
This work is based on the ISOGAL-DENIS Point Source Catalog Version 1.0 (Schuller et al., 2003) which includes more than 100,000 point sources detected at 7m and/or 15m in the ISOGAL survey. In addition to the standard data reduction by the CIA package (Ott et al., 1997) of the ISOCAM images, the point sources are extracted by a dedicated PSF fitting procedure. Because most of the ISOGAL survey areas are near the Galactic plane () and have high source density, the source extraction is confusion limited and disturbed by strong background radiation. The photometric error is usually better than 0.2mag and rises above this value at the ISOGAL sensitivity limit of about 10mJy. The ISOGAL PSC catalog consists of three parts. The first part includes 163 fields observed at both 7m and 15m, with fields denoted by “FC”. The second part includes 43 fields observed only at 7m, denoted by “FA”. The third part includes 57 fields observed only at 15m, denoted by “FB”.
Unfortunately, the ISOGAL observations did not use the same filters through all the fields: towards about 75% of them the broad-band filters LW2 and LW3 were used, while towards the other 25%, the LW5, LW6 and LW9 narrow-band filters were used (Schuller et al., 2003). The reference wavelengths of the LW2 and LW3 filters are 6.7m with a bandwidth of 3.5m and 14.3m with a bandwidth of 6.0m, respectively. The LW5, LW6 and LW9 filters have reference wavelengths at 6.8m, 7.7m and 14.9m, with bandwidths of 0.5m, 1.5m and 2.0m, respectively (Blommaert et al., 2003). Thus, what we call “7m” or “15m” is an approximation and should not be confused with the precise central wavelengths of the bands. Detailed qualitative information on the ISOGAL filters, including the reference wavelengths, bandwidths, zero point magnitudes and flux densities, and total observed area, can be found in Table 1 of Schuller et al., (2003).
2.2 The ISOGAL-DENIS PSC data
The nominal position error is about 0.5″ in the DENIS survey, while it is several arc seconds in the ISOGAL survey. Cross-identification with DENIS has thus improved significantly the positional accuracy of the ISOGAL point sources. The final position accuracy of the ISOGAL-DENIS PSC is normally about 1 arc second. To deal with the confusion problem, the Ks limiting magnitude was cut to give a source density of 72000/deg2 for the ISOGAL 3″pfov [pixel field-of-view] observations or 18000/deg2 for the ISOGAL 6″pfov observations. The details of the ISOGAL-DENIS catalog are described in Schuller et al., (2003). Although there are over 100,000 sources in the ISOGAL-DENIS PSC, only data of high quality are used in the present work. We chose only sources whose association flags are 4 or 5, implying that the cross identifications are reliable. When there are two sources within the search radius, the closest DENIS source is associated with the ISOGAL source, and the association flag is usually reduced by 1 (from 5 as the highest quality). Such cases are mostly dropped from the following analysis. In addition, a constraint was also applied to the photometric quality of the DENIS PSC sources. The correlation factors in both J and K bands were required to be larger than 0.85. Since DENIS surveyed only the southern sky, it did not cover all the ISOGAL fields. The final number of retained associated sources is 50724 distributed in 220 fields, among which are 8552 sources in 42 FA fields (7m only), 7107 sources in 56 FB fields (15m only) and 35065 sources in 122 FC fields (both 7 and 15m).
2.3 The ISOGAL-2MASS PSC data
The Two-Micron All Sky Survey, (2MASS, Skrutskie et al., (1997)) is similar to DENIS in that it is also a ground-based near-infrared survey. However, 2MASS differs from DENIS, mainly in that it covers the whole sky including all the ISOGAL fields. In addition, 2MASS observed in the JHKs bands, i.e. including the H band but not the I as in DENIS. The depth of the 2MASS photometry is slightly greater than that of the DENIS photometry; nominally the limiting magnitude for point sources is Ks14.3mag compared to 14 mag in DENIS. As the field of view per pixel is similar, the positional accuracy of the 2MASS PSC is of the same order as that of DENIS.
The 2MASS PSC database was released in 2003 (Cutri et al., 2003), after the ISOGAL-DENIS PSC. The cross-identification procedure was the same as for the ISOGAL-DENIS case, described in Schuller et al., (2003). There are three major steps. First, we determined the offsets of every ISOGAL field according to the positions provided by the 2MASS PSC. As with all the southern ISOGAL fields, this correction was accomplished by cross-identification with the DENIS PSC. As the 2MASS astrometric accuracy is comparable to that of DENIS (both have a nominal error of 0.5″), this would not have been any significant improvement to the positional accuracy. Consequently, this step is applied only to the 42 northern fields which were beyond the DENIS coverage. The offsets of these ISOGAL fields to the 2MASS PSC sources range as high as 4 to 5 arcseconds though usually they are less than 3″, similar to the values of the ISOGAL field offsets to the DENIS PSC sources, as expected. After removing the offsets, the positional accuracy of sources in the northern ISOGAL fields is about 1.5″. The second step is to search for the 2MASS counterpart of each ISOGAL point source. The search radius is 1.8″ or 3.5″ for sources in the ISOGAL fields with pfov of 3″ and 6″ respectively. If there is more than one 2MASS source within the search radius, no 2MASS source is assigned to the ISOGAL source (although the closest one was taken to be the ISOGAL-DENIS cross-identification). Also rejected are the sources whose positional differences between ISOGAL and 2MASS are bigger than 3, where means the rms ISOGAL-2MASS position difference in the corresponding field (after field offset correction). The third step is to try to avoid the confusion problem which was met with in the cross-identification with the DENIS sources. It is likely to be more serious because of the slightly higher sensitivity of 2MASS. The 2MASS source density is limited to 72000/deg2 or 18000/deg2 for the ISOGAL fields with pfov 3″or 6″respectively, which corresponds to a formal random association probability of 5%, implying that the number of spurious associations should be smaller than 1% (Schuller et al., 2003). This step is accomplished by setting the limiting magnitudes in the Ks band above the 2MASS limit (which varies from field to field and ranges from about 12 to 14 mag). The constraints on the association radii and confusion limits are similar to good association quality flags (4 or 5) in the ISOGAL-DENIS PSC. In addition to these steps, which are similar to those involved in the ISOGAL-DENIS association process, the 2MASS PSC sources are required to have reliable photometric results by only accepting photometry quality flag “AAA” in the JHKs bands, which means 10 in all bands. The read flags in all three bands were also required to be good (i.e. “Rflag” being 1, 2 or 3), which indicates best quality detection, photometry and astrometry (Cutri et al., 2003). Although these two criteria may be redundant in some sense, they are consistent and guarantee the quality of data. Under these constraints, the resultant ISOGAL-2MASS PSC contains 50653 sources distributed in all the 263 fields. These sources are composed of 8112 in 43 FA fields, 6623 in 57 FB fields and 35918 sources in 163 FC fields; or 39017 7m sources in 205 fields and 23359 15m sources in 218 fields. Compared to the ISOGAL-DENIS PSC sources, the number of fields is increased by 43 thanks to the 2MASS coverage of the northern ISOGAL fields. On the other hand, the total numbers of associated sources are comparable, which means that there are fewer sources on average in each field. This decrease in average density of sources in the ISOGAL-2MASS catalog can be attributed to the stricter constraint on photometric quality for the 2MASS PSC sources. This ISOGAL-2MASS PSC catalog is available via the VizieR Service at the Centre de Données Astronomiques de Strasbourg (CDS, http://vizier.u-strasbg.fr/viz-bin/VizieR/).
3 Method
3.1 Assumptions
We use the method described in detail by Jiang et al., (2003) to derive the extinction values. In the following sections, we adopt the following symbol convention: magnitudes in the J,Ks, bands and at 7 and 15m are denoted by J, Ks, [7] and [15] respectively; intrinsic color indexes by C; observed color indexes by C; the color excess of the observed to the intrinsic color C by E(); the extinction by Aλ. The method is based on two assumptions. The first assumption is that the group comprising RGB-tip and early AGB stars have approximately constant intrinsic color indexes C, C, C. The second is that the ratio of color excess E(Ks-[7]) to E(J-Ks),i.e. kE(Ks-[7])/E(J-Ks), is constant in one field. Then the extinction at 7m can be calculated by a linear fitting of the observed color indexes CKs7 to CJKs, i.e.
| (1) |
| (2) |
The same formula can be applied to the 15m case.
3.2 Selection of sources
Two types of sources are to be excluded because their intrinsic colors differ from our standard red giant sources: i) dusty young stellar objects and AGB stars with thick circumstellar envelopes, and ii) foreground early-type stars. The former are distinguished by their color index C which is usually larger than 0.4. Thanks to the small extinction at both 7 and 15m, the observed color index C715 may be used as a good approximation to the intrinsic one C. Felli et al., (2002) calculated the influence of the circumstellar matter on C and found that the sources having this color index greater than 0.4 may have thick circumstellar matter and therefore redder intrinsic C and C. However, selection by color is applicable only to the sources in the “FC” fields which were observed at both 7m and 15m. It is not suited to the sources in the “FA” or “FB” fields observed at only one wavelength since no color index C715 can be derived. Most foreground early-type stars can be excluded simply by dropping the sources with C1.2.
Some fields lie in directions with small extinction, as shown by their small E) values. From the analysis of the extinction law at 7m and 15m by Jiang et al., (2003), A7 is about 0.18E and A15 is about 0.16E. Thus, an extinction of the order of E)= 1 mag results in A 0.18 mag, comparable to the photometric error. In order to be able to obtain significant extinction in these mid-infrared bands, only the fields with much greater near-infrared extinctions are targeted. Only sources with large values of the color excess E are chosen so that their extinction at mid-infrared wavelengths will be significant. This will be further clarified in the next section.
In summary, a source to be selected should have: good photometry quality both in the ISOGAL mid-infrared and DENIS or 2MASS near-infrared bands, good near-infrared-mid-infrared association flags, and a moderate mass loss rate with C0.4. In addition, for a field to be qualified, there must be enough sources which suffer significant and detectable extinction in the mid-infrared bands.
3.3 Fitting Procedure
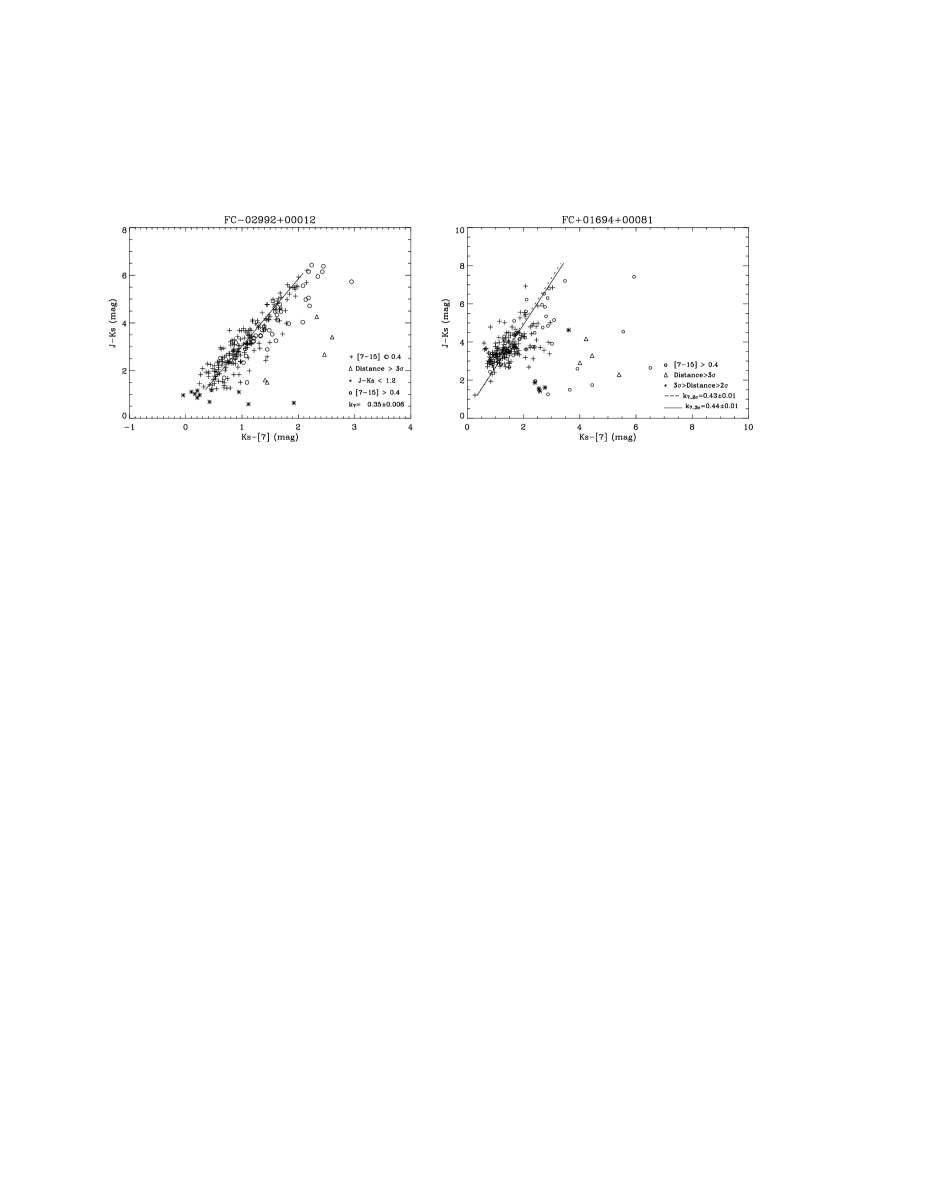
Fitting is done in two steps. First, we make a preliminary robust fitting to all the points which satisfied the previous criteria. In comparison with normal least-square linear fitting, the robust fitting method, which minimizes the absolute deviation, is less sensitive to small number of large outliers and more appropriate for our cases which usually have fewer sources with large color indexes. This fitting distinguishes the sources with large deviation, i.e. deviation larger than 3 from the fitted line. These sources were rejected because they have little probability of obeying the linear relation from the statistical point of view; on the other hand, most of them have relatively large CKs7, which indicates the likelihood of extinction arising from circumstellar dust envelopes. The linear fitting was carried out both ways, one fitting CKs7 (as y) to CJKs (as x) and the other fitting CJKs (as y) to CKs7 (as x); a source deviating from either fitting larger than 3 was rejected. We also tested 2 as the critical deviation for rejection and found the results were little changed. As an example, the right panel in Fig. 2 shows the sources with deviation between 2 and 3 as well as the results by fitting sources with both criteria. It can be seen that the results are very close to each other.
After the rejection of the sources with large deviations, 55 of the 7m fields (and 94 of the 15m fields) were discarded using the following two criteria in combination with the preceding selection of sources: a field must have (1) at least 30 sources remaining and (2) values of EJKs spanning more than 2 magnitudes, i.e. the maximum CJKs should be larger than at least 3.2, since the minimum of CJKs is set at 1.2 mag which agrees with the choice of RGB tip or early AGB stars (see succeeding paragraphs for explanation). The first condition is required for the results to be statistically meaningful. The second condition means that the extinction at 7 and 15m is large enough to be detectable. If we adopt our previous result that A, then EJKs must be , i.e. Amag, and A, just about twice the ISOGAL photometry rms accuracy at 7m.
These conditions retain about 73% of the 7m fields and 57% of the 15m fields. The resulting set of data covers 151 fields (including 35 FA and 116 FC fields) suitable for the 7m determination and 126 fields (including 34 FB and 82 FC fields) for the 15m determination, based on the ISOGAL-2MASS PSC. For the ISOGAL-DENIS PSC, the retained data cover 139 fields (36 FA plus 103 FC fields) with 7m photometry, and 116 fields (42 FB plus 74 FC fields) with 15m photometry.
Two examples showing rejected sources are shown in Fig. 2. In this figure, the left panel shows the sources from the field FC-02992+00012, which represents a good case with small error in k7; the right panel shows the sources from the field FC+01694+00081, which represents a mediocre case with relatively large error in k7.
In principle, both the slope and the intercept, thus the color excess ratio, can be derived from the fitting. However, we choose to fix the intrinsic color index C or C. There are two reasons for doing this. First, the intrinsic color indexes C and C of RGB tip stars or early AGB stars have small scatter, with a dispersion of about 0.2mag comparable to the photometric uncertainty (Jiang et al., 2003). Second, for many fields, when C and C are not fixed, the fitting leads to unrealistic values of C and C because of the lack of good quality low extinction sources. The adopted values of C and C are 0.35 and 0.40 respectively. The choice is based on the calculation of a 4000 K blackbody radiation, which gives a value in good agreement with the observations in the ISOGAL field FC01863+00035 with particularly good quality data (Jiang et al., 2003). In addition, C is also fixed to be 1.2 mag, since the observations to the fields in Baade’s window by Glass et al., (1999) and the modelling by Bertelli et al., (1994) both showed that this index of such late-M type stars is 1.20.1. Therefore, the fitted line is forced to pass through the point [0.35,1.2] or [0.40,1.2] in the KS-[7] vs. J-KS or KS-[15] vs. J-KS diagram, respectively. Only the slope of the fitted line, k7 or k15, is derived during the fitting. Even with the previously described restrictions, the fitting results still appeared poor in some cases, which may be attributed to some restriction not being appropriate. For example, C is fixed, which is not really true, since C is likely to be slightly different from case to case. The last selection is based only on fitting error, without relation to any physical meaning. The final sample requires a relative error of k7 less than 5 percent, i.e. , which takes into account the error induced in the fitting procedure. This restriction excluded 22 fields. For the 15m case, the relative error of k15 is constrained to be 10% in order to retain sufficient data, as 6 fields are excluded. Thus results with small fitting errors are derived for 129 fields and 120 fields, around 7 and 15m respectively.
From k7, the ratio of the color excess E(Ks-[7]) to E(J-Ks) is derived. To obtain the extinction A7, one more step is needed as can be seen from equation (2) in Section 3.1. The value of A7 depends not only on the slope k7, but also on the near-infrared extinction values, AJ and AKs. The influence of near-infrared extinction values was discussed in Jiang et al., (2003). Generally, the extinction law in the near-infrared is accepted as universal with no variation from sightline to sightline (Draine, 1989). Nevertheless, the measurements of the near-infrared extinctions differ a little from group to group. The values given by Glass et al., (1999) and van der Hulst, (1946) are in good agreement, while the values given by Rieke & Lebofsky, (1985) (R&L) are slightly higher. Jiang et al., (2003) adopted the former while Lutz, (1999) and Indebetouw et al., (2005) adopted the later. The average values of A7 expressed in AKs are 0.34 when using the values by Glass et al., (1999) and van der Hulst, (1946), while being 0.46 when using the values by Rieke & Lebofsky, (1985). For reason of consistency, we would prefer to use the Glass figures. However, this group of values give rise to some negative A7 (7m) values, which is obviously unreasonable, and may mean the Glass values underestimate the near-infrared extinctions. So instead of the previous choice, made by by Jiang et al., (2003), the near-infrared values by R&L are used. Although the extinctions at 7m relative to AV depend somewhat on the near-infrared extinctions, the value normalized to the extinction in the Ks band is less dependent on it. Therefore, we express the extinction at 7m in terms of the extinction in the Ks band. In Table 1, the results from different near-infrared extinction values are shown in detail.
| Band | |||
|---|---|---|---|
| vdH11footnotemark: 1 | ISG22footnotemark: 2 | R & L33footnotemark: 3 | |
| J | 2.816 | 2.876 | 2.509 |
| KS | 1 | 1 | 1 |
| 7 | 0.37 | 0.35 | 0.47 |
| 1544footnotemark: 4 | 0.30 | 0.28 | 0.40 |
Values for J and KS derived
from van de Hulst (1946) curve
22footnotemark: 2 Values for J and KS derived from
Glass (1999) (update of van de Hulst’s values)
33footnotemark: 3 Values for J and KS derived
by Rieke & Lebofsky (1989) for stars towards the Galactic center
44footnotemark: 4 The average is derived only from the LW3 fields.
See Section 4.3 for reference.
4 Results and Discussions
4.1 Extinctions at 7m
For the 115 of all the selected fields observed by both DENIS and 2MASS, we have attested that the values derived for A from the two sets of near-infrared data are consistent. They display the same average value with an rms difference equal to 0.04. Only two or three fields displayed anomalous differences for A and these arise from a problem with the DENIS data. Thus, the two sets of data yield practically identical results. However, since 2MASS completely covers the ISOGAL-DENIS fields and includes some northern ISOGAL fields not included by DENIS, the results derived from the ISOGAL-2MASS PSC represent the entire sample and only they are considered hereafter.
From the above choices of the intrinsic color indexes C and C as having the values 0.35 and 0.40 respectively, C is inferred to be 0.05. This corresponds to the case of stars with very little dust. However, the criterion C was set to exclude the effect of circumstellar dust on the brightness at 7m and 15m, on the color indexes CKs7 or CKs15, and thus on the result. The critical value of C715 affects the A7 result only slightly, while A15 changes a little more. When the critical value is changed from the present 0.4 to 0.6, the average of A7 is decreased by only 0.01, and the average of A15 is decreased by 0.08; when it is changed from 0.4 to 0.2, the average of A7 is increased by 0.004, and the average of A15 is increased by 0.09. Such tendencies are expected: radiation by circumstellar dust increases the 7m and particularly the 15m fluxes, which imitates a decrease in the corresponding extinctions. Thus, including more of the sources with circumstellar dust envelopes would underestimate the extinction. As the result on A7 is little affected, the value chosen appears to be small enough to exclude the effect of dusty envelopes. From the fact that A15 is affected when the critical value is changed, it can be seen that this criterion cannot completely remove the influence of dust shells. However, if this critical value is moved towards the blue, the number of sources and fields would decrease significantly and thus lower the statistical significance of the results. Therefore, the value of 0.4 is kept for both bands accordingly.
The extinction values A7 are displayed in Table LABEL:tabext7 [the full table is given for the selected 129 fields in the electronic version at CDS (http://vizier.u-strasbg.fr/viz-bin/VizieR]. From left to right, the table includes the ISOGAL field name, filter (“2” stands for “LW2” and so on), the number of sources included in the final fitting, the slope k7, the 1-sigma error of k7, and the extinction value at 7m relative to A. There are 106, 16 and 7 fields with the filters LW2, LW6, and LW5, respectively.
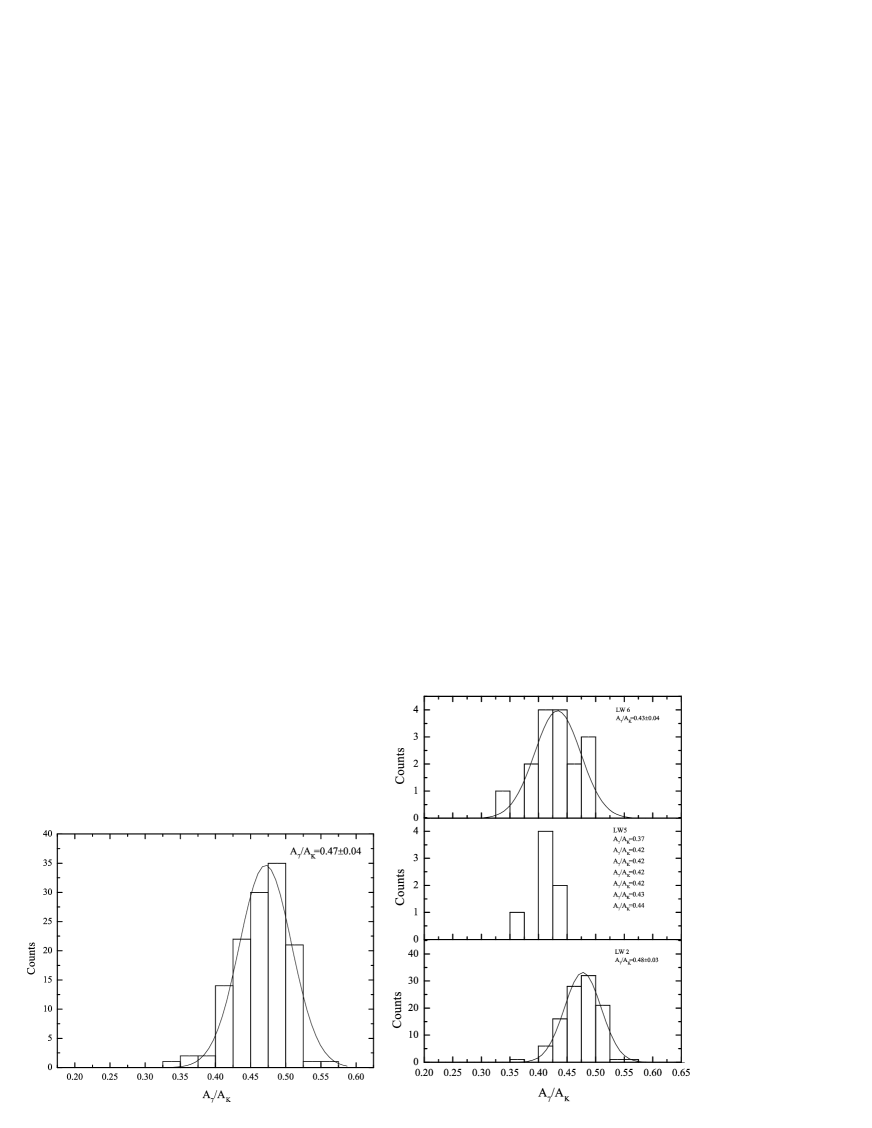
From Table LABEL:tabext7 and Fig. 3, it can be seen that A7/AKs has a distribution which can be well approximated by a Gaussian function, with the central value of 0.47AKs and a FWHM of about 0.07AKs. The minimum and maximum are 0.33AKs to 0.55AKs respectively. Such variation includes the differences in filter wavelength ranges, statistical “noise” in determining k7, systematic errors and the possible variation of A7/AKs along various lines of sight. We will try to disentangle these various contributions in the two following sections.
4.1.1 The central value of A7
The average value of the distribution of A7 (c.f. Fig.3) we refer to as the central value is 0.47AKs. This value is very consistent with that of Lutz et al., (1996) – an extinction of 0.45AKs at 6.8m. It also agrees well with the value 0.48AKs at both 5.7m and 7.8m, derived for the sightline using the GLIMPSE data by Indebetouw et al., (2005).

As we mentioned in the Introduction, the ISOGAL observation used three different filters centered at about 7m, viz. LW2, LW5 and LW6. To see if the extinction around 7m varies with wavelength, we have first determined the mean values of extinction in the three bands. They are 0.48, 0.42 and 0.43AKs for LW2, LW5 and LW6, respectively. The standard deviations of A7 in these three cases are 0.016, 0.020 and 0.019, significantly smaller than the variation ranges of A7 derived for the corresponding filters. The results are plotted in Fig. 4, and compared with the values based on Spitzer/GLIMPSE data by Indebetouw et al., (2005) and ISO data by Lutz, (1999). It is seen that our results are in good agreement with others.
4.1.2 Variation of A7
In order to discuss whether the spread in the values of A7/AKs exceeds that due to the data noise, and whether it provides evidence for extinction variations along differing lines of sight, we first focus on the LW2 data which are by far the most complete and homogeneous, with the best quality. The filters LW6 and LW5 were used only in the most difficult and crowded fields to reduce the effects of saturation by strong sources which are particularly numerous in star forming regions. The distribution of the values obtained with LW2 for A7/AKs is reasonably well fitted by a Gaussian distribution with a central value of 0.48 and an r.m.s. of 0.03 (see Fig.3).
Table LABEL:tabext7 gives the value of the r.m.s. of the slope k7 from the linear fitting of the relative reddening J-Ks/Ks-[7] (Fig. 2). The r.m.s. values include mainly the noise appropriate to the various magnitudes, but also other kinds of variations such as uncertainty in the intrinsic colors, source variability, extinction variation along a given line of sight, etc. For all these 7m fields, the average of is 0.011, while k7 ranges from 0.30 to 0.44, with an unweighted average of 0.355 (weighted average 0.352) and standard deviation 0.025. Such a value (0.025) appears significantly, albeit somewhat marginally, larger than the r.m.s. 0.011 of k7. There is thus some evidence that A7/AKs may vary significantly, depending on the line of sight.
The range [0.37AKs, 0.55AKs] (or even 0.33AKs if one includes LW6 fields) of A7 from our analysis covers that obtained by Indebetouw et al., (2005) from 0.37 at the sightline to 0.48 at the sightline at 7.8m. The value of 0.40AKs around 7m from Lutz, (1999) is also inside this range.
It has been known for long time that the selective extinction in the visual and ultraviolet range varies from one sightline to another, depending on the interstellar environment through which the starlight passes. The representative parameter R changes from values as low as 2.1 (toward very diffuse interstellar clouds) to values as large as 5.6-5.8 (toward very dense interstellar clouds). Such variation has been explained by different size distributions among the grains, i.e. the larger RV distribution has significantly fewer small grains than the smaller RV distribution, which is expected since generally there is relatively less extinction at short wavelengths (provided by small grains) for larger values of RV.
However, in the near-infrared, the available observations are consistent with a uniform extinction law at wavelengths shortward of 3.5m. Cardelli et al., (1989) concluded that the shape of extinction law for 0.7 was independent of RV within the errors of measurements. It is further inferred from the constancy of the near-infrared extinction law that the size distribution of the largest particles are almost the same in all directions (Mathis, 1990). Following this opinion, one would initially expect no variation of the extinction law in mid-infrared, since the mid-infrared extinction must be attributed to larger grains. However, with the grain models which have a size distribution of log-normal form (Weingartner & Draine, 2001) rather than classical power law form, Drain, (2003) (Figure 4) showed that the extinction law in mid-infrared could be much more dependent on RV even though the law in near-infrared is rather independent of RV. Similar to the situation at UV and visual wavelengths, the larger RV value results in larger extinction in the 2.5-8m range. At the wavelength 7m of our interest, the extinction changes by a factor of about two when RV varies from 3.1 to 5.5. Thus in principle, the variation of the selective extinction around 7m is understandable, considering the variation in the dust grain size distribution. On the observational side, Indebetouw et al., (2005) found slight but significant differences in the wavelength dependence of the mid-infrared extinction from two regions. One possible explanation for this discrepancy between the near-infrared constancy and the mid-infrared variation of the extinction law is that the extinction at 7m is already affected by the silicate 9.7m feature. While the continuum extinction (attributed to the graphite grains, which are the only source of extinction in the near-infrared wavelength range) does not vary from sightline to sightline, the silicate feature extinction may change in different environments. It is well accepted that there is variation in A. Studies of the 9.7m feature yielded A = 9 towards the Galactic center direction (Roche & Aitken, 1985) and about 18.5 toward WC stars (see e.g. van der Hucht et al., (1996)). In addition, within the Taurus molecular cloud, this ratio varies substantially (Whittet, 1988). Such variations in strength of the 9.7m feature and its profile would surely affect the selective extinction in mid-infrared. Nevertheless, the wavelength limit of our 7m filters remains less than 8.5m and is thus only at the edge of the silicate 9.7m feature, where the relative extinction caused by silicate to the peak (Aλ/Apeak) is below 0.1(Draine, 1989). The influence of the silicate dust on the 7m extinction should therefore not be very significant. This may be the reason why the variation of the 7m extinction is not very large.
In order to look for further evidence that the variation of the 7m extinction law is caused by variable silicate extinction, one could try to compare the extinctions deduced for the different filters used in the ISOGAL observation. Because the silicate feature centers at 9.7m and starts from about 7.5m, a small part of the LW2 filter and a major part of the LW6 filter’s bandwidths overlap the silicate feature, while the narrow-band filter LW5 is completely outside it. In the right panel of Fig. 3, the distributions of A7 in three filters are shown.
However, it is not certain that such a comparison is relevant because the number of LW6 and LW5 observations is relatively small, with data of poorer quality, and they cover atypical regions of the sky such as the Galactic Center neighborhood and star forming regions. There is no obvious difference between the LW5 and LW6 values; however, the number of LW5 values is too small to infer any real conclusion. The values of A7 from the LW2 and LW6 data both have approximately Gaussian distributions with similar widths. The most distant point in the A7 distribution of the LW6 observations is from the field FC+01694+00081. From Fig. 2 it can be seen that the fitting for the extinction is of relatively poor quality. Indeed this field is located in the direction of the extremely young open cluster NGC 6611 (Belikov et al., 1999), which may be the reason for the large scatter in the J-Ks/Ks-[7] plot and thus the poor quality of the fit. The difference between the LW2 and LW6 groups is apparent in the central values of the distributions. The LW6 group values are centered at 0.43AKs and the LW2 group values center at 0.48AKs, i.e. the extinction in the LW2 band is slightly larger than that in the LW6 band. However, it seems very difficult when explaining the origin of such a difference, if real, to disentangle a possible wavelength effect from the fact that the LW6 observations are towards very special regions.
4.2 Correlation with locations in the Galactic plane
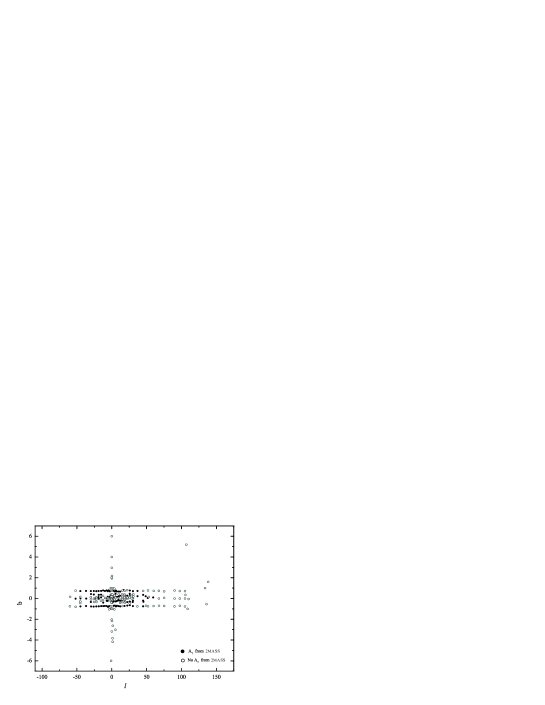
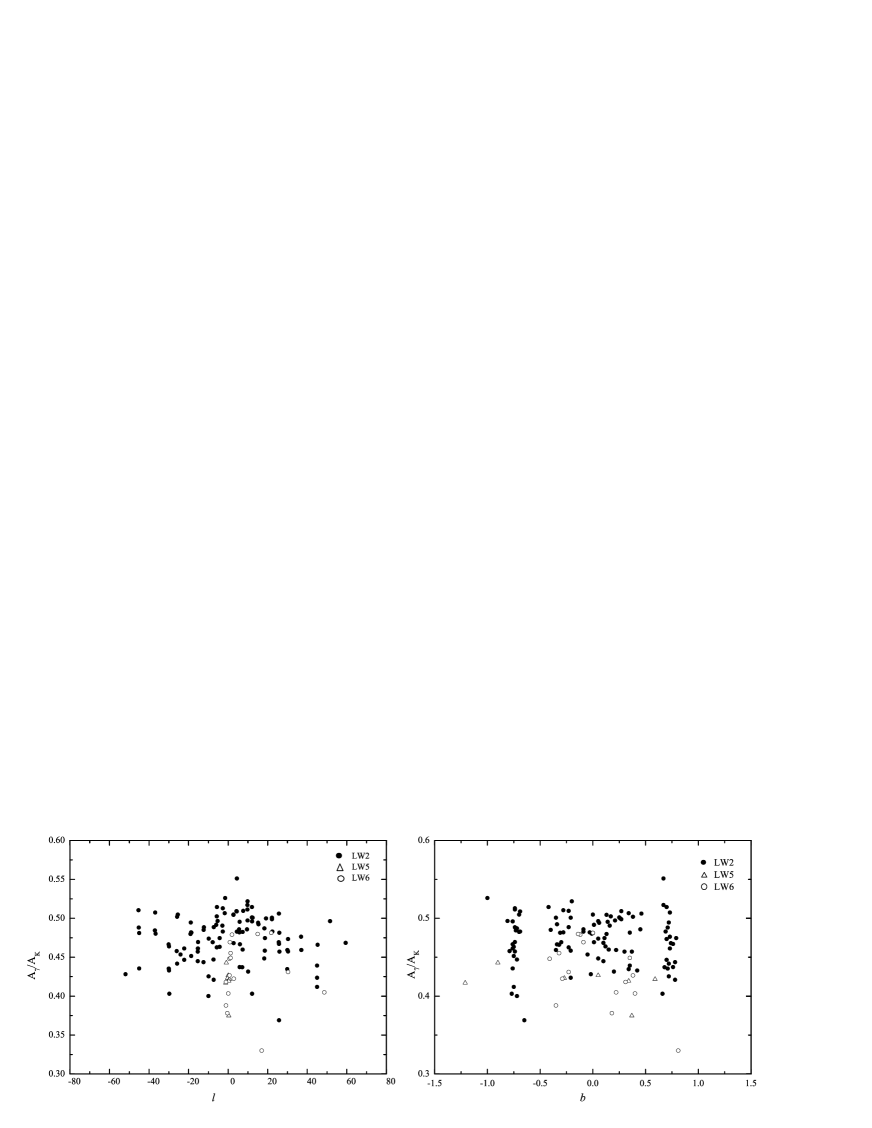
Shown in Fig. 5 are the distributions of A7 with Galactic latitude and longitude. Because the ISOGAL project targeted fields in the Galactic plane, the latitude range is small, and the distance from the midplane is always less than 1°. There is no systematic change of A7 with latitude seen in this latitude range.
The longitude range of the fields we have retained covers about 60°to +60°. There is no clear evidence that the extinction changes systematically with longitude within this large range. The measurements in the bulge direction are abundant and the results look rather scattered. The random variations of A7 may arise partly from “noisy” data. However, they are not incompatible with moderate local variations of the extinction caused by patchy distribution of the interstellar medium on small scales.
4.3 Extinctions at 15m
Different from the 7m extinction, the 15m extinction is probably dominated by the combined effect of spectral features of silicate dust with a minor contribution from continuum extinction. If the continuum extinction followed the power law A, it would amount to 0.04AKs at 15m. However, the silicate spectral features can bring about much larger extinction. For example, according to the analytic formula of Rosenthal et al., (2000), the extinctions at 15m caused by the 9.7m and 18m features are and respectively. If further the spectral response of the ISOCAM filter is taken into account, the convolution of the spectral transmission profile of the LW3 and LW9 filters with Rosenthal’s formula yields 0.44AKs and 0.39AKs respectively. Thus the 15m extinction is mainly contributed by the silicate spectral feature extinction, with the 18m feature being the major contributor. In addition, because of the variation of the silicate features in different environments, the 15m extinction law is expected to vary as well.
Because the flux at 15m is more affected by circumstellar dust than at 7m, excluding the sources with relatively thick circumstellar envelopes becomes more important. For this reason, only the FC fields observed at both 7 and 15m with [7]-[15]0.4 are chosen. Using this constraint, most of the sources with thick circumstellar envelopes are expected to be rejected. We adopted an intrinsic color index C of 0.40, because a 4000 K (typical for a red giant star) blackbody radiation has this value and it is also the result deduced from the previously studied ISOGAL field with good quality data by Jiang et al., (2003).
The final results on the 15m extinction derived from the FC fields are shown in Table LABEL:tabext15 [the full table is given for the selected 76 fields in the electronic version at CDS (http://vizier.u-strasbg.fr/viz-bin/VizieR] and displayed as a histogram in Figure 6. Among the 76 FC fields for measuring A15 that remain, 69 were observed with the LW3 filter and 7 with the LW9 filter. For the 69 LW3 fields (i.e. observed with the LW3 filter), the average value of A15 is 0.40 AKs with a standard deviation of 0.07. This is remarkably consistent with the expected values from the superposition of the continuum extinction and the silicate spectral extinction as analyzed in the beginning of this section. This result is also in agreement with the value 0.41AKs from Jiang et al., (2003) for one line of sight. As =0.037, and A15 ranges from 0.19AKs to 0.54AKs, which is larger than 3, it is possible to attribute part of the range to the field-to-field differences. This is consistent with the expectation that the silicate feature varies with the interstellar environment. However, the distribution of A15 is asymmetrical (see Figure 6); most of the results are within 3. Taking into account the much larger rms of A15, the reality of the variation of A15 must be proved more rigorously. For the LW9 fields, the small number of fields makes the statistics less meaningful. Nevertheless, the average value of A15 for them is 0.14AKs with a standard deviation of 0.09. Shown in Fig. 6 are the distributions of A15 for the LW3, LW9 fields separately and together. As can be seen in Fig. 4, the value for the LW9 fields is clearly smaller than for the LW3 fields and significantly smaller than the theoretical expectation. The difference in A15 between LW9 and LW3, as well as the difference between LW9 and the value from Rosenthal’s analytic formula, is larger than the uncertainty of the fitting error. It may be concluded from the former that the extinction decreases from 14.3m (the reference wavelength of LW3) to 14.9m (the reference wavelength of LW9) and, from the latter, that Rosenthal’s expression overestimates the extinction around this waveband. But we should be cautious about the extinction result at LW9, because: (1) The LW9 fields are relatively peculiar regions with generally strong star forming activity so that the extinction may differ from diffuse interstellar regions. As Rosenthal’s analysis is towards an area with an AKs of only one magnitude, the difference may be attributable to the different environment. Further observations of some diffuse regions are needed. (2) The radiation from the circumstellar dust is strong around 15m, and its effect can not be purged from our selection of the color index, as discussed in Section 4.1.

5 Summary
The ISOGAL project surveyed about 20 square degrees in the Galactic plane and detected numerous evolved stars with similar intrinsic infrared colors. Based on the point sources in the ISOGAL PSC catalog, we have built a cross-identified catalog between the ISOGAL and the 2MASS PSCs similar to the ISOGAL-DENIS catalog of Schuller et al. (2003). It includes about 60,000 sources. After selection from the mid-infrared and near-infrared colors and photometry quality flags, the extinctions around 7 and 15m were derived towards about 129 fields. The central value of the 7m extinction is about 0.47AKs with a width of about 0.07A (using the near-infrared extinctions of Rieke & Lebofsky, (1985)). The average extinction shows some variation in the small range of wavelength defined by the LW2, LW5 and LW6 filters, with the value from the LW2 filter slightly larger than from the LW5 and LW6 filters. In addition, there is a possibility that A7 varies along different lines of sight, falling within the range of [0.33, 0.55]AKs, with the mean fitting error for any particular field being about 0.02. The values from H recombination lines toward the Galactic Center found by Lutz et al., (1996) fall within the range of our results, as does the recent result from the Spitzer GLIMPSE data at (Indebetouw et al., 2005).
The extinction at 15m was found to be about 0.4AKs based on the data from fields observed both at 7 and 15m. Although this result suffers relatively large uncertainty due to scatter in the intrinsic color C, it is in reasonable agreement with theoretical expectation.
Acknowledgements.
This paper made use of data products from the Two Micron All Sky Survey, which is a joint project of the University of Massachusetts and the Infrared Processing and Analysis Center/California Institute of Technology, funded by the National Aeronautics and Space Administration and the National Science Foundation. This paper also made use of data products from the DEep Near-Infrared Survey (DENIS) of the Southern Sky. The DENIS project is supported, in France by the Institut National des Sciences de l’Univers, the Education Ministry and the Centre National de la Recherche Scientifique, in Germany by the State of Baden-Wrtemberg, in Spain by DGICYT, in Italy by the Consiglio Nazionale delle Ricerche, in Austria by the Fonds zur Frderung der Wissenschaftlichen Forschung and the Bundesministerium fr Wissenschaft und Forschung. We thank the whole ISOGAL team. We also express our gratitude to Dr. Ian Glass for his careful reading of the manuscript and useful suggestions. This research is in part supported by the NKBRSF G19990754 Fund and the NSFC Project 10473003 of China.References
- Belikov et al., (1999) Belikov, A., Kharchenko, N., Piskunov, A. & Schilbach, E. 1999, A&AS 134, 525
- Benjamin et al., (2003) Benjamin, R., Churchwell, E., Babler, B., et al., 2003, PASP 115, 953
- Bertelli et al., (1994) Bertelli, G., Bressan, A., Chiosi, C., Fagotto, F. & Nasi, E. 1994, A&AS 106, 275
- Blommaert et al., (2003) Blommaert, J., Siebenmorgen, R., Coulais, A., Metcalfe, L., Miville-Deschenes, M., Okumura, K., Ott, S., Pollock, A., Sauvage, M. & Starck, J. 2003, ESA SP 1262, Vol.II, p.14
- Bronfman et al., (1989) Bronfman, L., Alvarez, H., Cohen, R.S. & Thaddeus P. 1989, ApJS 71, 481
- Cardelli et al., (1989) Cardelli, J., Clayton, G. & Mathis, J. 1989, ApJ 345, 245
- Churchwell et al., (2004) Churchwell, E., Whitney, B., Babler, B., Indebetouw, R., Meade, M., Watson, C., Wolff, M., Wolfire, M. & Bania, T., et al. 2004, ApJS 154, 322
- Combes, (1991) Combes, F. 1991, ARA&A 29, 195
- Cutri et al., (2003) Cutri, C., Skrutskie, M. & van Dyk, S. 2003, available online at http://www.ipac.caltech.edu/2mass/
- Dame et al., (1987) Dame, T., Ungerechts, R., Cohen, R., De Geus, J., et al. 1987, ApJ 322, 706
- Draine & Lee, (1984) Draine, B., & Lee, H. 1984, ApJ 285, 89
- Draine, (1989) Draine, B. 1989, in Infrared Spectroscopy in Astronomy, ed. B.H. Kaldeich (Paris, ESA), 93
- Drain, (2003) Draine, B. 2003, ARA&A 41, 241
- Epchtein et al., (1994) Epchtein, N., de Batz, B., Copet, E., et al. 1994, Ap&SS 217, 3
- Epchtein et al., (1997) Epchtein, N., De Batz, B., Capoani, L., et al. 1997, Messenger 87, 27
- Epchtein et al., (1999) Epchtein, N., Deul, E., Derriere, S., Borsenberger, J., Egret, D., Simon, G., Alard, C., Balâzs, L., de Batz, B., Cioni, M., et al. 1999, A&A 349, 236
- Felli et al., (2002) Felli, M., Testi, L., Schuller, F., & Omont, A. 2002, A&A, 392, 971
- Glass, (1999) Glass, I. 1999, Handbook of Infrared Astronomy, Cambridge, Univ. Press
- Glass et al., (1999) Glass, I., Ganesh, S., Alard, C., Blommaert, J., Gilmore, G., Lloyd Evans, T., Omont, A., Schultheis, M., Simon, G. 1999, MNRAS 308, 127
- Hennebelle et al., (2001) Hennebelle, P., Pérault, M., Teyssier, D., Ganesh, S. 2001, AA, 365, 598
- Indebetouw et al., (2005) Indebetouw, R., Mathis, J. S., Babler, B. L., et al., 2005, ApJ 619, 931
- Jiang et al., (2003) Jiang, B.W., Omont, A., Ganesh, S., Simon, G., Schuller, F. 2003, AA, 400, 903
- Landini et al., (1984) Landini, M., Natta, A., Oliva, E., Salinari, P., Moorwood, A. 1984, A&A 134, 384
- Lutz et al., (1996) Lutz, D., Feuchtgruber, H., Genzel, R., Kunze, D. et al. 1996, AA, 315, L269
- Lutz, (1999) Lutz, D. 1999, ESA SP-427: The Universe as Seen By ISO, 623
- Mathis, (1990) Mathis, J. 1990, ARA&A 28, 37
- Neckel & Klare, (1980) Neckel, Th., Klare, G. 1980, A&AS 42, 251
- Omont et al., (1999) Omont, A., Ganesh, S., Alard, C., et al. 1999, A&A 348, 755
- Omont et al., (2003) Omont, A., Gilmore, G., Alard, C., et al. 2003, AA, 403, 975
- Ott et al., (1997) Ott, S., Abergel, A., Altieri, B., et al. 1997, Design and Implementation of CIA, the ISOCAM Interactive Analysis System, in ASP Conf. Ser. 125, ed. Hunt G. & Payne H., 34
- Pérault et al., (1996) Pérault, M., Omont, A., Simon, G., et al. 1996, A&A 315, L165
- Price et al., (2001) Price, S., Egan, M., Carey, S., Mizuno, D., Kuchar, T. 2001, AJ 121, 2819
- Rieke & Lebofsky, (1985) Rieke, G., & Lebofsky, M. 1985, ApJ, 288, 618
- Roche & Aitken, (1985) Roche, P., & Aitken, D. 1985, MNRAS, 215, 425
- Rosenthal et al., (2000) Rosenthal, D., Bertoldi, F., Drapatz, S. 2000 A&A 356, 705
- Schuller et al., (2003) Schuller, F., Ganesh, S., Messineo, M., et al. 2003, AA, 403, 955
- Skrutskie et al., (1997) Skrutskie, M., Schneider, S., Stiening, R., et al. 1997, in The Impact of Large Scale Near-IR Sky Surveys, eds. F.Garzon, N.Epchtein, A.Omont,B.Burton, & P.Persi (Netherlands:Kluwer), 187
- van der Hucht et al., (1996) van der Hucht, K., Morris, P., Williams, P., et al. 1996, AA, 315, L193
- van der Hulst, (1946) van der Hulst, H.C. 1946, Rech. Astron. Obs. Utrecht, 11, 1
- van Loon et al., (2003) van Loon, J., Gilmore, G., Omont, A., Blommaert, J., Glass, I., Messineo, M., Schuller, F., Schultheis, M., Yamamura, I., Zhao, H.S. 2003, MNRAS, 338, 857
- Wainscoat et al., (1992) Wainscoat, R., Cohen, M., Volk, K., Walker, H., Schwartz, D.,1992, ApJSS 83, 146
- Weingartner & Draine, (2001) Weingartner, J. & Draine B.T. 2001, AA, 548, 296
- Whittet, (1988) Whittet, D., 1988, in Dust in the Universe, eds. Bailey, M. & Williams, D., p.25
| Field Name | Filter | Number | k7 | A7 | |
| FA+00580+00076 | 2 | 155 | 0.37 | 0.012 | 0.44 |
| FA+00712+00068 | 2 | 80 | 0.37 | 0.010 | 0.44 |
| FA+0073700070 | 2 | 287 | 0.34 | 0.009 | 0.48 |
| Field Name | Filter | Number | k15 | A15 | |
| FC01904+00013 | 3 | 58 | 0.41 | 0.022 | 0.38 |
| FC+0044000009 | 3 | 36 | 0.41 | 0.028 | 0.38 |
| FC+01514+00075 | 3 | 51 | 0.40 | 0.037 | 0.40 |