Spitzer 70m and 160m Observations of the Extragalactic First Look Survey
Abstract
We present Spitzer 70m and 160m observations of the Spitzer extragalactic First Look Survey (xFLS). The data reduction techniques and the methods for producing co-added mosaics and source catalogs are discussed. Currently, 26% of the 70m sample and 49% of the 160m-selected sources have redshifts. The majority of sources with redshifts are star-forming galaxies at , while about 5% have infrared colors consistent with AGN. The observed infrared colors agree with the spectral energy distribution (SEDs) of local galaxies previously determined from IRAS and ISO data. The average 160m/70m color temperature for the dust is K, and the average 70m/24m spectral index is . The observed infrared to radio correlation varies with redshift as expected out to based on the SEDs of local galaxies. The xFLS number counts at 70m and 160m are consistent within uncertainties with the models of galaxy evolution, but there are indications that the current models may require slight modifications. Deeper 70m observations are needed to constrain the models, and redshifts for the faint sources are required to measure the evolution of the infrared luminosity function.
Subject headings:
galaxies: evolution — galaxies: starburst — infrared: galaxies1. Introduction
One of the first science observations carried out with the Spitzer Space Telescope (Werner et al. 2004) was the non-proprietary extragalactic First Look Survey (xFLS) which was designed to characterize the infrared sky at previously unexplored sensitivities. The IRAS mission first uncovered the presence of infrared luminous galaxies in the local universe (Neugebauer et al. 1984; Soifer et al. 1987), and the ISO infrared (Elbaz et al. 1999, 2002; Rodighiero et al. 2005) and ground-based submillimeter and millimeter observations (Blain et al. 2002 and references therein) have highlighted the importance that infrared luminous galaxies have on the general understanding of galaxy evolution. Since the cosmic infrared background (CIB) peaks in the far-infrared (FIR) (Hauser & Dwek 2001), studying the properties of galaxies that are bright in the FIR is crucial for constraining models of galaxy evolution.
In this paper, we present 70m and 160m observations of the xFLS field using the Multiband Imaging Photometer for Spitzer (MIPS, Rieke et al. 2004). The xFLS is a 4 deg2 survey. The SWIRE Spitzer survey (Londsdale et al. 2004) covers a wider area (49 deg2) to similar depths, and deeper observations covering smaller areas are being taken by the MIPS Instrument Team as part of the Guaranteed Time Observers (GTO) program (e.g., Dole et al. 2004a) and other groups. Although the xFLS is not unique in terms of depth or area coverage, the field has a large number () of spectroscopic redshifts (P. Choi et al. 2005, in preparation; F. Marleau et al. 2005, in preparation), ancillary radio (Condon et al. 2003), and optical imaging data (Fadda et al. 2004) that permit detailed multi-wavelength studies over a relatively large area. In this paper, we measure the source counts and use the available redshifts to constrain the rest-frame spectral energy distributions (SEDs) and derive the average infrared properties for the xFLS 70m and 160m populations. A cosmology of H, , and is assumed throughout this paper.
2. Observations
The xFLS survey covers a 4 deg2 region (, ) within the northern continuous viewing zone of Spitzer111The extragalactic FLS data can be retrieved from the Spitzer Science Center at http://ssc.spitzer.caltech.edu/fls/. Inside the xFLS main field a smaller verification strip of 0.25 deg2 centered at , was observed with an integration time of 4 times that of the main survey to characterize the completeness and source reliability of the main survey. In total, 27.7 hours of xFLS observations were taken in 2003 December with the MIPS instrument. An additional 16.8 hours of observations within the xFLS main field were taken in 2005 May to characterize the performance of the 70m array at warmer telescope temperatures ( K). These observations produced useful data at 70m, but the 160m data were not usable. Figure 1 shows the layout of the observations.
All of the MIPS observations were taken using the medium scan-rate mapping mode (4.2 s data collection events [DCEs]). The main-survey data were taken with adjacent 2 deg scan legs that were offset in the cross-scan direction by (nearly the full field of view of the arrays). The main-survey was covered twice to identify potential asteroids and to increase the redundancy of the data set. Unfortunately, half of the MIPS-70 array was rendered useless after launch due to a cable failure outside the instrument (Rieke et al. 2004). Therefore, at 70m each position of the main survey was covered by only one scan leg. Since the data were not scheduled exactly as originally planned, slight rotations between the 8 astronomical observation requests (AORs) yielded small gaps with zero coverage in the south-west corner of the main-survey 70m map.
The verification strip was observed using 4 AORs with 0.5 deg scan legs at the medium scan rate. Each AOR covered the 0.5 deg0.5 deg field using cross-scan steps of (slightly less than half an array field of view). The warm test data taken in 2005 May were centered on the 70m main-field. These data consisted of 6 AORs with 1.75 deg scan legs. Cross-scan steps of were used to map the 1.75 deg1.75 deg field once. Table 1 shows the average integration times, sensitivities, and area coverage for the 70m and 160m observations.
3. Data Reduction
3.1. BCD Pipeline Processing
The raw 70m and 160m (MIPS-Germanium [Ge]) data were downloaded from the Spitzer Science Center (SSC) archive and were reduced using the offline Ge Reprocessing Tools (GeRT), available from the public SSC website. The GeRT uses an offline version of the SSC pipeline to produce the basic calibrated data products (BCDs), following the algorithms derived by the MIPS Instrument Team and the MIPS Instrument Support Team (Gordon et al. 2005). The processing was done using the latest software (SSC pipeline version S12) to take advantage of improvements not currently available for the online xFLS data products (made with pipeline version S11).
BCD processing has two main steps: (1) calculation of the slope of the data ramp, and (2) calibration of the slope image. For the xFLS MIPS-Ge data, the raw 4.2 s data ramps are comprised of 32 non-destructive reads per pixel (one DCE). After correcting for the electronic nonlinearity, cosmic ray events and other discontinuities are identified in the data ramps. The SSC pipeline identifies discontinuities using a maximum likelihood technique (Hesselroth et al. 2000). Linear slopes are calculated for the ramp segments between discontinuities and checked for consistency. The slopes from the segments are combined based on the empirical errors estimated from the scatter of the data within the ramp segments. Average slopes for each pixel are calculated to produce an uncalibrated slope image.
The second step of BCD processing is the calibration of the slope image. The calibration of MIPS-Ge data is based on frequent measurements of internal stimulator flashes (stims) which are used to track the responsivity of the detectors as a function of time. For the xFLS medium scan-rate data, the stim flashes are observed every 25 DCEs (118 s). The stim flash signal is measured by subtracting the previous “background” DCE from the stim frame which is taken at the same position on the sky. For each AOR, a stim response function () is calculated from interpolating between the stim minus background measurements.
After the determination of the stim response as a function of time (), the BCD data are calibrated using the following equation:
| (1) |
where U(t) is the uncalibrated slope image, DARK is the dark calibration file, and IC is the illumination correction calibration file which corrects for the combined illumination pattern from the telescope and the stim flash signal. The DARK and IC calibration files are stable and are generated by combining data from several different campaigns to improve the signal-to-noise. The flux conversion factor () converts the instrument units into physical surface brightness units of MJy sr-1 and is derived from observations of standard calibrators (Sec. 3.4).
3.2. BCD Filtering
Before the 70m bias level was lowered in 2004 March, the 70m data showed significant data artifacts. Examples and discussion of MIPS-Ge artifacts are shown in the MIPS Data Handbook222http://ssc.spitzer.caltech.edu/mips/dh/. The two main artifacts impacting the xFLS data are the stim flash latents and the variations of the slow response as a function of time. The 160m data are affected by these issues to a lesser degree due to the faster time constants of the 160m stressed-Germanium detectors. For point sources, the stim latent and slow response residuals are additive effects. The filtering of the 160m data is straight-forward. We used the filtered BCDs products, which remove a running median per pixel as a function of time by subtracting the median value for the surrounding DCEs closest in time (ignoring the current DCE, stim DCEs, and bad data). This high-pass time median filter removes data artifacts as well as the extended cirrus emission. To remove the stim latent artifacts at 160m, we simply ignored the first DCE after the stim flash since the stim latents decay away within one DCE.
The filtering process for the 70m data is slightly more complicated. The time median filter by itself does not remove all of the data artifacts. Stim latents remain for many DCEs and are correlated by column. Since the scan map direction is nearly along the columns of the array (along the y-axis), the column artifacts are amplified. We remove the column residuals by subtracting the median of the values along each column for every BCD. The combination of the high-pass time median filter per pixel and the column median filter removes the bulk of the data artifacts at 70m.
The resultant rms is lower for narrow high-pass median filter widths ( DCEs), but narrow filter windows can yield significant negative side-lobes around bright sources. In addition, column filtering does not maintain point source calibration for the brightest sources ( Jy). To avoid significant negative side-lobes and to preserve calibration, the filtering of the MIPS-Ge data was done in two passes. The data from the first filtering pass were co-added, and sources were extracted (Sec. 3.3) to find the location of the bright sources. The source positions within the original BCDs were masked and new filtering corrections were calculated in the second pass, ignoring the pixels containing sources. This second-pass filtering technique minimizes the data artifacts while preserving point-source calibration.
Different filtering methods were tested and optimized using the GeRT. At 70m, we applied column filtering followed by a high-pass time median filter with a width of 12 DCEs to yield the deepest image. The final sensitivity of the filtered 70m image was improved by more than a factor of two in comparison to data with no filtering. Filtering has less of an impact at 160m, but is useful for deep observations of faint point sources. We adopted a high-pass time median filter width of 12 DCEs for the 160m data using the second-pass filtering technique as done for 70m.
3.3. Data Coaddition and Source Extraction
The filtered BCDs were coadded using the SSC mosaicing and source extraction software (MOPEX) (Makovoz & Marleau 2005). The data were combined ignoring bad data flagged in the BCD mask files (bmask) and the bad pixels defined by the static pixel mask (pmask). Using the redundancy of the MIPS data, additional spurious data values were removed via outlier rejection. The remaining data were corrected for array distortions and projected onto a sky grid with square pixels that were more than 2 times smaller than the original pixels. The output mosaic pixels are at 70m and at 160m. The data were averaged using weights proportional to the fractional area subtended by the original pixels as projected onto the output pixel grid. Since the calibration of the main, verification, and the warm 70m data sets are consistent within measurement errors, all data were combined to yield the deepest images.
Sources were extracted from the final images using MOPEX. The MOPEX software uses a Point-source Response Function (PRF) image to optimize source detection and point source fitting. A PRF calibration image was made for each MIPS band by coadding isolated bright point sources within the xFLS field. A point source probability (PSP) image was made from non-linear matched filtering of the input image with the PRF. The PSP image represents the probability of having a point source above the noise at each pixel. The PSP image was multiplied by the input image to yield the filtered image used for source detection. The filtered image enhances the presence of point sources in the mosaic while smoothing out noise features that do not match the input PRF, providing a more robust image for source detection. After source detection, the original images were fitted with the PRF image via minimization to extract source positions and flux densities. Regions containing multiple peaks were de-blended. For extended sources and/or close blends, not well fitted by the PRF, large aperture measurements were used to derive the total flux density for the source.
The noise across the images is non-uniform. For optimal source detection and extraction, an accurate representation of the uncertainties is needed. The MOPEX uncertainty image based on the input BCD pipeline uncertainties is useful for identifying the relative uncertainties across the image, but the pipeline errors typically underestimate the absolute uncertainty level for low background regions. The median level of the MOPEX uncertainty image was scaled to match the average empirical noise in the mosaics. By using a properly scaled uncertainty image, we find an average for the fitted point sources of , suggesting that the uncertainty image is self-consistent with the average point source errors in the data.
Several tests were done to validate the photometric results from MOPEX. No calibration differences were found for different sub-sets of the data. We also compared the photometry done with the MOPEX software with that from the program StarFinder (Diolaiti et al. 2000). Both programs use an empirical PRF to fit source flux density. The results from MOPEX and StarFinder agree to better than 5% for bright point sources ( mJy at 70m and 200 mJy at 160m) and better than 10% rms down to the limits of the catalog, consistent with the uncertainties in the data. For faint sources detected in the MIPS-Ge bands, PRF fitting techniques yield more reliable results than aperture measurements. By comparing results between the verification data and the main survey, we find a consistency of % for PRF matching techniques and a dispersion for aperture measurements of larger than % at faint flux density levels.
3.4. Calibration
The absolute calibration is derived using observations of stars at 70m and observations of asteroids and well-studied luminous infrared galaxies at 160m. The data were processed assuming flux conversion factors of 634 MJy sr-1 per MIPS-70 data unit and 42 MJy sr-1 per MIPS-160 data unit. The flux densities in the source catalogs were multiplied by the correction factors of 1.16 and 1.17 for the MIPS-70 and MIPS-160 bands respectively, which includes the color corrections associated with a constant SED and updated calibration conversion factors based on the latest measurements. Additional color corrections for sources with non-constant SEDs are negligible since the color corrections are similar for the range of SEDs appropriate for galaxies; , where – 3. For flux density ranges of 50 mJy – 2 Jy, the absolute calibration uncertainty is estimated to be about 15% and 25% for the 70m and 160m bands respectively. No corrections have been made for possible flux nonlinearities, which may be significant for sources brighter than this nominal flux density range. Observers are recommended to check the latest information on MIPS calibration at the SSC web site.
We confirmed that the absolute 70m flux density scale for the xFLS data is consistent with previous measurements made by IRAS to within 10%. For comparison with IRAS, we interpolated between the flux densities in IRAS-60 and IRAS-100 bands (Beichman et al. 1988) to the effective wavelength of the MIPS-70 band (71.4m)333The effective wavelengths of the MIPS-24, 70, and 160 bands are 23.7m, 71.4m, and 155.9m, respectively. Throughout this paper, the flux densities for the MIPS-bands are defined as S24 Sν(23.7m), S70 Sν(71.4m), and S160 Sν(155.9m). applying the appropriate color corrections. For the five brightest sources in the field detected by IRAS, we derive a flux density ratio of Spitzer/IRAS at 71.4m. The calibration at 160m is more uncertain given that xFLS sources have not been observed previously at wavelengths longer than 100m. Simple SED model fits to the data indicate that the calibration at 160m is consistent with IRAS to within 30%.
3.5. Mosaics and Catalogs
The MIPS-Ge mosaics and catalogs are available online at the SSC website. For both of the MIPS-70 and 160m bands, we provide coadded mosaics of the entire xFLS data sets along with the corresponding coverage maps and uncertainty images. The mosaics are from the filtered products and have been background subtracted. The absolute level of the uncertainty image has been scaled to match the empirical noise within the mosaics. The coverage map represents the effective number of input BCDs for each pixel of the mosaic after outlier rejection. There are regions within the 70m and 160m mosaics with zero coverage. The 70m image has gaps in the south-west corner of the mosaic due to non-overlapping AORs. The 160m mosaics have a regular pattern of low coverage due to the unusable block of five detectors and the low redundancy of these observations.
Point-source catalogs were made for sources with S/N at each wavelength to insure high reliability. Sources near the edges or within regions of very low coverage were deleted from the public catalogs to avoid potentially spurious sources. In total, 687 70m sources (Table 2) and 207 160m sources (Table 3) are cataloged. The 70m and 160m catalogs are independent. The catalogs can be combined together or with xFLS data at other wavelengths, depending on the specific application. The average point source rms () is 2.8 mJy and 20 mJy for the 70m warm+main data and 160m main-survey data, respectively. For the deeper verification regions, the point source rms is 1.6 mJy at 70m and 10 mJy at 160m.
The images were examined visually to validate source detection and to determine the appropriate method for deriving the flux densities on a source by source basis. About 98% of the derived flux densities are based on PRF fitting (Sec. 3.3). The remaining sources mostly consist of bright extended galaxies and/or close blends that are not well fitted by the PRF. In these cases, large aperture measurements were made to derive the total flux densities. For bright extended sources that have one or more neighboring point sources within the aperture, the flux density of the bright galaxy was derived by subtracting the PRF measurement(s) of the faint point source(s) from the total aperture measurement.
Table 2&3 show the format for an example portion of the xFLS MIPS 70m and 160m catalogs published in the online edition of the Journal. The average radial positional errors are and () for the S/N MIPS-70 and 160m sources respectively. No systematic differences are found for the 70m source coordinates () in comparison to the more accurate 24m positions. For consistency with the 24m and 70m data, we correct the 160m positions by to compensate for the systematic positional offset measured for the 160m sources (a known issue for pre-S12 versions of the pointing pipeline). The flux densities have been color corrected assuming a constant SED. The tabulated flux density errors include the absolute flux density uncertainties of 15% and 25% at 70m and 160m, respectively.
3.6. Reliability and Completeness
The verification data were used to test the reliability of the source detection and extraction techniques. For a high level of reliability at , it is important that the uncertainty image accurately reflects the small-scale spatial variations in the noise across the images. Using the uncertainties based on the BCDs, properly scaled to represent the average empirical noise in the data (Sec. 3.3), we obtained good results. Based on the deeper verification data, we do not find spurious sources with S/N in the main survey within the verification field. Sources detected at S/N are 80-85% reliable, and detections at the S/N level are only 50-60% reliable. Based on these results, we adopted a S/N cut for deriving the source counts in Sec. 4.1. A more conservative S/N criterion was adopted for the public catalogs (Sec. 3.5).
At 70m the completeness and source counts were measured within the overlapping region of the warm and main fields (Fig. 1), while the entire main-field xFLS area was used at 160m. Both empirical completeness estimates based on the verification data and simulated completeness measurements were made. The simulations of completeness were carried out by adding point sources with different flux densities into the mosaics at random locations, and then extracting sources using the same techniques adopted for the source catalogs. The simulations and empirical methods for estimating completeness gave consistent results. Using the adopted S/N criterion, the completeness level falls rapidly below 60% for S70 mJy (Fig. 2) and S160 mJy (Fig. 3). Similar completeness simulations were done for the deeper verification field, and we find 60% completeness levels of approximately 9 mJy and 60 mJy at 70m and 160m, respectively.
4. Results and Discussion
4.1. Source Counts
The source counts are derived for the main xFLS and verification fields based on S/N catalogs corrected for completeness. At 70m we use the 3.3 deg2 region containing both the main and warm survey data. The 160m counts are based on the entire 4.5 deg2 area of the main survey. Figures 4&5 show the differential source counts () at 70m and 160m respectively. Over the entire observed range of flux density, both the 70m and 160m counts increase at super-Euclidean rates with decreasing flux density.
In total 845 sources at 70m were detected ( at S70 mJy) within the mainwarm field area and 186 sources were detected (S70 mJy) within the verification field (Table 4). In comparison at 160m, 227 sources were detected in the main-field (S160 mJy) and 45 sources (S160 mJy) were found in the verification field (Table 5). The source counts are consistent between the main and verification data for the overlapping range of flux densities. The xFLS counts are also consistent within errors with the previous MIPS-Ge counts published by Dole et al. (2004a). The error bars for the source counts include the Poisson noise, the completeness errors, and the absolute flux density calibration uncertainty. The data were binned such that the errors are not dominated by Poisson statistics, except for the highest flux density bins. In the lowest flux density bins, the errors on completeness dominate the uncertainties.
Dole et al. (2004a) found a difference in the 70m counts between the CDF-S and Marano observations, which they attributed to field variations. The measured 70m xFLS counts are within the range of values previously measured, and closer to the CDF-S counts at faint flux densities. The xFLS-Ge counts are also consistent within uncertainties with the evolutionary models of Lagache et al. (2004), which were updated to match the Spitzer 24m counts. However, the xFLS data points are systematically slightly lower than the predictions from current models. Counts from the wide-area SWIRE survey would be needed to check for possible field variations and to test whether the models require slight modifications.
Although the xFLS 70m counts are at fainter levels than those previously published (Dole et al. 2004a), they are not yet deep enough to measure the location of the expected turn over of the differential counts (Fig. 4). The flux density at which the differential counts turn over provides important constraints on evolutionary models (Lagache et al. 2004; Chary & Elbaz 2001; King & Rowan-Robinson 2003; Xu et al. 2001), as shown by the 24m data (Marleau et al. 2004; Papovich et al. 2004; Chary et al. 2004). At 160m Spitzer is not expected to measure the turn over in the counts (Fig. 5), since the 160m data are expected to be limited by confusion below 40 mJy (Dole et al. 2004b). The differential counts at 70m are expected to turn over at around 10 mJy (Lagache et al. 2004), which is well above the confusion limit, suggesting that deeper 70m counts would provide useful constraints for galaxy evolution models.
4.2. Infrared Colors
For high reliability, the source counts were derived using a S/N criterion for the individual bands. However, it is possible to maintain a high level of reliability at lower S/N by using the MIPS-24m and/or radio data of the field. For studying the infrared colors, we used S/N source lists to increase the number of sources detected at high-redshift in the MIPS-Ge bands. The 70m source list was bandmerged with the 24m catalog (D. Fadda et al., in preparation). At S/N, 1779 xFLS-70 sources have counterparts at 24m within . The different resolutions of the 24m, 70m, and 160m data sets (, , and , respectively) complicate the identification of the counterparts in the MIPS bands. Out of the 1779 70m sources, 9% have multiple candidate 24m counterparts. To avoid potential spurious matches, we only used sources with one-to-one matches for studying the infrared colors. The xFLS-160 source list was matched to the 70m data set using a positional matching radius of . The resulting matched MIPS-160+70 source list was matched to the MIPS-70+24 source list. We find 301 160m sources with one-to-one matches between all three MIPS-bands.
Out of the 1618 xFLS-70 sources with one 24m positional match, 427 currently have redshifts. Approximately 57% of these sources come from the NOAO WIYN-Hydra radio-selected redshift survey (F. Marleau et al. in preparation), 16% of the redshifts are from the Keck-DEIMOS 24m-selected sample (P. Choi et al., in preparation), and the remaining 27% of redshifts are from the SLOAN survey (Strauss et al. 2002). The largest redshift to date is for a quasar at . For the 160m-selected sources with detections in all three MIPS-bands, about half (146) have known redshifts. Although the redshift survey of xFLS-Ge sources is not nearly complete (only 26% of the 70m sources and 49% of the 160m sources currently have redshifts), there are a sufficient number of sources to study the general trends in the infrared colors as a function of redshift for the sample.
We adopt two sets of SED models for studying the infrared colors. The first set of SED models is based on a simple modified blackbody (Blain, Barnard, & Chapman 2003). The SED is expressed as , where is the blackbody function for a dust temperature , and is the dust emissivity. In the mid-IR, we substitute a power-law of the form , smoothly matching at longer wavelengths (Blain et al. 2003). For this simple SED model, there are three free parameters: , , and . The S160/S70 ratio constrains , while the S70/S24 ratio measures . The dust emissivity index is not very well constrained by the Spitzer data alone. For simplicity, we adopt a constant value of which is consistent with the results for low-redshift IRAS galaxies (Dunne et al. 2000).
The second set of SED models uses a physically more realistic approach by assuming a power-law distribution of dust masses as a function of radiation field intensity (Dale et al. 2001). The dust mass () as a function of the radiation field () is given by (Dale et al. 2001; Dale & Helou 2002)444We use to represent the “” parameter of Dale et al. (2001).. Quiescent, cirrus-like dust regions are expected to have , while environments near active Hii regions are expected to be approximated by . For a mixture of active and quiescent regions, the average effective of star-forming galaxies should be between .
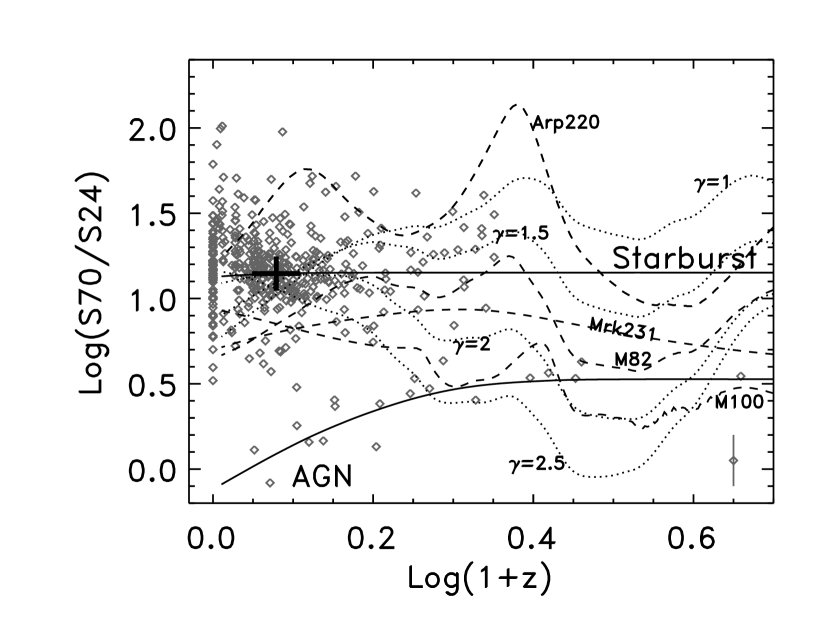
Figure 6 shows the observed 70m/24m flux density ratio (S70/S24) plotted as a function of redshift with several predictions based on the SEDs of local galaxies. The majority of the xFLS sources have S70/S24 ratios within the range of values between the extreme ultraluminous starburst of Arp 200 and the more typical starburst M82. At moderate and high redshifts, infrared-cool ultraluminous infrared galaxies (ULIRGs, ), e.g., Arp 220, are expected to have the highest S70/S24 ratios, while warm-infrared ULIRGs, e.g., Mrk 231, and AGN dominated sources are expected to have lower S70/S24 ratios. Spiral galaxies without a strong infrared excess in their SED (e.g., M100) show decreasing S70/S24 ratios as a function of redshift; however, these galaxies are not detected at high redshifts () in the xFLS-Ge survey. In general, the S70/S24 ratio can be used to help distinguish between AGN-dominated sources from star-forming galaxies, except in cases for which strong polycyclic aromatic hydrocarbon (PAH) emission features are redshifted into the 24m band (e.g., M82 at in Fig. 6) and for AGN with strong silicate absorption features (e.g., Spoon et al. 2004) at .
For the xFLS sample currently with redshifts, only 5% show low S70/S24 ratios consistent with AGN SEDs. The AGN population is fitted with K and (Fig. 6), which is consistent with the IRAS observations of Seyfert galaxies (Miley, Neugebauer, & Soifer 1985). The majority of the xFLS sample with redshifts are starbursts at . Figure 6 shows a large concentration of sources at . The S70/S24 ratios based on the SEDs of quiescent and active galaxies (Dale & Helou 2002) intersect at , which may contribute to this concentration of data points. For the galaxies with , the average observed infrared color is S70/S24. In comparison with the IRAS population (Soifer et al. 1989; Sanders et al. 2003), the IRAS-60/IRAS-25 ratios correspond to a predicted ratio of S70/S24, consistent with the measured xFLS infrared colors. For the simple SED model, the average S70/S24 ratio corresponds to an infrared index of . Using SEDs of Dale & Helou (2002), values of give the best agreement with the average S70/S24 ratios.
Although the majority of the 70m sources do not have redshifts, the distribution of the S70/S24 ratios is the same for galaxies with and without redshifts (Fig. 7). The average mid-IR spectral index is . For a simple power-law representation of the mid-IR SED, the modeled S70/S24 ratio is constant with redshift (e.g., Starburst solid line in Fig. 6). However, galaxies are expected to show significant variations in the S70/S24 ratio as strong PAH emission and mid-IR absorption features (e.g., Armus et al. 2004) are redshifted through the 24m band (as seen for Arp 220 in Fig. 6).
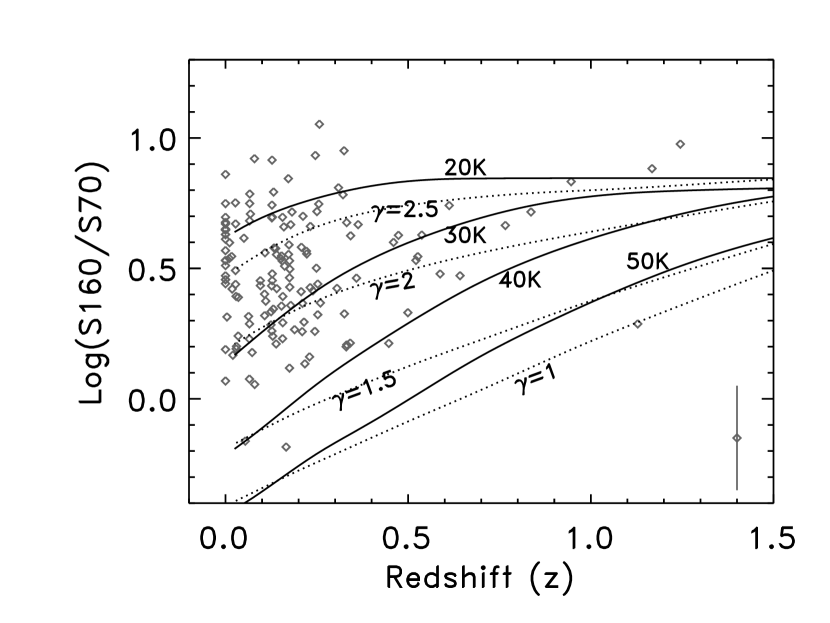
Using simple modified blackbody SEDs, we calculate S160/S70 as a function of redshift and dust temperature for a constant value of (Fig. 8). The average 160m/70m color temperature for the dust temperature is 305 K. This temperature is slightly lower than the average temperature of K (Dunne et al. 2000) and –40 K (Soifer et al. 1989) derived for IRAS galaxies, but the longer wavelength 160m band is more sensitive to regions with cooler dust temperatures than those observed by IRAS. The blackbody temperature of 30 K derived here agrees well with the long-wavelength ISO observations of infrared-bright spiral galaxies (Bendo et al. 2003). Bendo et al. (2003) found that K provided the best fit to the ISO data for 1–2, consistent with the results in Figure 8. In the context of the SED models of Dale & Helou (2002), values of –2.5 provide the best agreement with the observed S160/S70 ratios.
The distribution of the S160/S70 ratios is measurably different for sources with and without redshifts (Fig. 9). Unlike the S70/S24 ratio which is on average roughly constant with redshift, the S160/S70 ratio is expected to increase with redshift (Fig. 8). Figure 9 shows an excess of 160m sources without redshifts having high S160/S70 ratios (Log[S160/S70]). These results may suggest that the excess sources are at high redshift () and that the current redshift sample of 160m sources may be biased toward lower redshifts.
4.3. Infrared Luminosity
For the 70m selected sources, we can estimate the average infrared luminosity for the xFLS population. The rest-frame wavelength of the MIPS-70 band corresponds to 60m at a redshift of . The FIR luminosity (42.5–122.5m) can be derived from the rest-frame 60m and 100m flux densities (Helou, Soifer, & Rowan-Robinson 1985). By using the SED associated with the average model parameters of K and for the xFLS sources, we estimate a rest-frame S100/S60 ratio of 2.3. This is consistent with the values of S100/S60 observed for the bulk of the IRAS galaxies (Sanders et al. 2003). Based on the rest-frame S100/S60 ratio, the corresponding FIR flux is FIR(W m (S70/Jy) for the observed S70 flux density at . For galaxies at , the average value of S70 is 33 mJy. This corresponds to a FIR luminosity of (FIR). Using the models of Dale et al. (2001) and the estimated S100/S60 ratio, the total infrared luminosity (3–1100m) (TIR)(FIR). Hence, the average total infrared luminosity of the 70m-selected xFLS galaxies at is about (TIR).
Although the redshift survey for the 70m-selected sources is not currently complete, the infrared luminosity function can be estimated at low redshift for bright flux densities. At S70 mJy, 72% (65/90) of sources have redshifts. The majority of sources without redshifts are suspected to be at high redshift given that the observed redshift distribution declines significantly at and the models predict that the majority of sources at these flux density levels are at . Based on the models of Lagache et al. (2004), about 40–45% of galaxies with S70 mJy are predicted to be at . Assuming % completeness at (i.e., assume all sources with S70 mJy currently without redshifts are at ), we find 64% (58/90) of galaxies with S70 mJy and . If the current xFLS redshift surveys are not complete at (with S70 mJy), then the models would be even more discrepant with the observations. Hence, the models may under predict the percentage of low redshift 70m sources at bright flux densities. There are two potential caveats on this result. First, a small percentage (%) of 70m sources do not have 24m counterparts, and these sources are likely to be at high redshift (e.g., at where the silicate absorption feature is redshifted into the 24m band). However, there is only one 70m source without a 24m counterpart with S70 mJy, so this population, by itself, cannot account for the apparent discrepancy with the models. The second caveat is that we have thrown out 9% of the 70m sources with multiple possible 24m matches (Sec. 4.2). The 70m sources with multiple candidate 24m counterparts tend to be brighter on average and typically have low redshifts. In fact, we find only one such source with and with S70 mJy (1/70 with redshifts). Additional redshift surveys are needed to confirm the findings here which suggest that the current models slightly over predict the percentage of bright 70m sources (S70 mJy) at high-redshift () and their contribution to the total CIB.
To estimate the infrared luminosity function, we use the sample of 58 galaxies with S70 mJy and . We adopt the method following the calculation of the IRAS m) luminosity function (Soifer et al. 1987). For each source, the maximum volume () at which the source would be included in the sample is computed, using as an upper bound for the survey. The 70m flux density is converted to a rest-frame 60m flux density using a power-law interpolation between the observed 24m and 70m measurements. The calculated xFLS 60m luminosity function () shown in Figure 10 represents the space density of galaxies per Mpc3 per magnitude in luminosity. Even though the current xFLS sample is a factor of 100 deeper in flux density than the IRAS 60m bright galaxy sample (Soifer et al. 1987; Sanders et al. 2003), the xFLS sample does not yet probe the high luminosity end of the luminosity function (Log(m), given the low redshift range (median redshift of only ) and small area of the current sample. The derived xFLS luminosity function agrees well with the IRAS 60m luminosity function (Soifer et al. 1987). Below Log(m, (Soifer et al. 1987), while at higher luminosities (Sanders et al. 2003). Additional redshifts for the faint S7010 mJy sources are needed to constrain the evolution of the luminosity function out to .
4.4. Infrared to Radio Correlation
In the local universe, galaxies over a wide range of luminosity and Hubble types follow the empirical IR/radio correlation (Helou et al. 1985; Condon 1992). Observations of ISO sources (Gruppioni et al. 2003) indicate that the mid-IR to radio relationship holds out to , and the data for the SCUBA sources suggest that the FIR to radio relationship may be applicable even at –3 (e.g., Chapman et al. 2005). With Spitzer we can measure the IR/radio relationship out to by direct observations near the peak of the SED, instead of estimating the IR luminosity from the shorter mid-IR or longer sub-mm wavelengths. Appleton et al. (2004) presented the first estimate of the IR/radio relationship based on Spitzer data. Their results were based on the early analysis of the xFLS data. Here we present updated results using more sensitive 70m data.
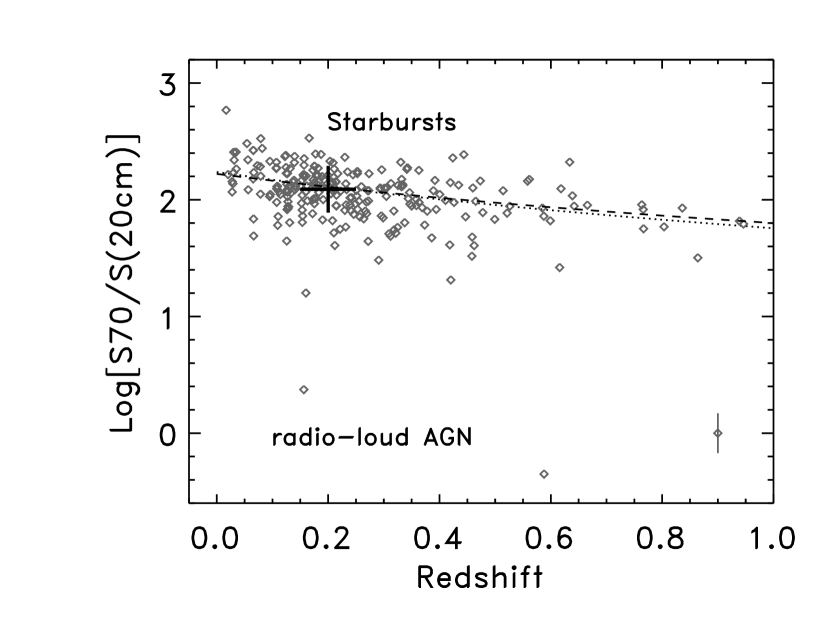
The sample of 427 xFLS-70 sources with redshifts and with only one candidate 24m counterpart (Sec. 4.2) was matched to the radio catalog (Condon et al. 2003). Within , 325 of these xFLS-70 sources (76%) have radio counterparts. Figure 11 shows the observed S70/S(20 cm) ratio as a function of redshift for the matched galaxies.
At low redshift, the FIR to radio -parameter is defined as (Helou et al. 1985). Based on the typical SED of the xFLS sample of galaxies (Sec. 4.2), the corresponding predicted parameter for the 70m to radio flux density ratio is at . We measure an average value of for xFLS galaxies at . By comparison, Appleton et al. (2004) derived a similar value of , but unlike the previous results we observe the expected decrease of observed as a function of redshift (Fig. 11). Based on the SEDs of local galaxies, we expect the observed parameter to decrease with redshift since the average IR spectral index is significantly steeper than the radio spectral index. Assuming an IR spectral index of based on the observed average ratio of S70/S24 and the typical non-thermal radio spectral index of (, Condon et al. 1992), we expect . From a least-squares fit to the data, we estimate . Hence, the observed for the xFLS galaxies follows the expected trend out to at least (Fig. 11).
5. Conclusions
The Spitzer 70m and 160m observations of the xFLS are presented. For the deeper verification field data, we measure number counts down to 8 mJy and 50 mJy () in the 70m and 160m bands, respectively. The observed xFLS counts are consistent with previous measurements (Dole et al. 2004a) and are consistent within the uncertainties with the evolutionary models (Lagache et al. 2004). Based on the models of Lagache et al. (2004), approximately 35% of the CIB is resolved at 70m and 15% is resolved at 160m at the depth of the verification data. The observed fraction of low redshift galaxies at bright 70m flux densities is larger than model predictions and the total counts appear slightly systematically lower. These results may suggest the models overestimate the contribution of high-redshift galaxies at bright 70m flux densities to the total CIB. Deeper 70m observations are needed for measuring the expected turn over in the differential source counts to provide better constraints on the evolutionary models.
The observed xFLS infrared colors S70/S24 and S160/S70 are consistent with the results from the IRAS and ISO missions. Modeled SED fits suggest an average 160m/70m color temperature for the dust of K, for the 160m-selected sample of galaxies. This temperature is consistent with ISO observations of spirals (Bendo et al. 2003). The average S70/S24 ratio implies an infrared spectral index of , which agrees with expectations from the average IRAS S60/S24 ratio (Soifer et al. 1989; Sanders et al. 2003). The observed 70m infrared to radio correlation of the xFLS sources also agrees well with the FIR-to-radio correlation found for local star-forming galaxies (Helou et al. 1985; Condon et al. 1992). We observe a trend of decreasing S70/S(20 cm) as a function of redshift consistent with expectations based on the SEDs of local galaxies.
Given the lack of sufficient redshift measurements for the high-redshift faint xFLS-Ge sources, we can only derive an infrared luminosity function at low redshift for only the brightest 70m galaxies. With these data, we calculate a rest-frame 60m luminosity function for the xFLS that agrees well with the IRAS luminosity function (Soifer et al. 1987). In the future, it may be possible to measure the evolution of the luminosity function out to moderate redshifts with the xFLS data when additional redshift surveys of faint 70m sources become available.
We thank all of our colleagues associated with the Spitzer mission who have made these observations possible. This work is based on observations made with the Spitzer Space Telescope, which is operated by the Jet Propulsion Laboratory, California Institute of Technology under NASA contract 1407.
References
- (1)
- (2) Appleton, P. N., et al. 2004, ApJS, 154, 147
- (3)
- (4) Armus, L., et al. 2004, ApJS, 154, 178
- (5)
- (6) Beichman, C. A., Neugebauer, G., Habing, H. J., Clegg, P. E., & Chester, T. J. 1988, Infrared Astronomical Satellite (IRAS) Catalogs and Atlases. Volume 1: Explanatory Supplement (Washington, DC: US Government Printing Office)
- (7)
- (8) Bendo, G. J., et al. 2003, AJ, 125, 2361
- (9)
- (10) Blain, A. W., Barnard, V. E., & Chapman, S. C. 2003, MNRAS, 338, 733
- (11)
- (12) Blain, A. W., Smail, I., Ivison, R. J., Kneib, J.-P., & Frayer, D. T. 2002, Physics Reports, 369, 111
- (13)
- (14) Chapman, S. C., Blain, A. W., Smail, I., & Ivison, R. J. 2005, ApJ, 622, 772
- (15)
- (16) Chary, R., et al. 2004, ApJS, 154, 80
- (17)
- (18) Chary, R., & Elbaz, D. 2001, ApJ, 556, 562
- (19)
- (20) Condon, J. J. 1992, ARA&A, 30, 575
- (21)
- (22) Condon, J. J., Cotton, W. E., Yin, Q. F., Shupe, D. L., Storrie-Lombardi, L. J., Helou, G., Soifer, B. T., & Werner, M. W. 2003, AJ, 125, 2411
- (23)
- (24) Dale, D. A., & Helou, G. 2002, ApJ, 576, 159
- (25)
- (26) Dale, D. A., Helou, G., Contursi, A., Silbermann, N. A., & Kolhatkar, S. 2001, ApJ, 549, 215
- (27)
- (28) Diolaiti, E., Bendinelli, O., Bonaccini, D., Close, L., Currie, D., & Parmeggiani, G. 2000, A&AS, 147, 335
- (29)
- (30) Dole, H., et al. 2004a, ApJS, 154, 87
- (31)
- (32) Dole, H., et al. 2004b, ApJS, 154, 93
- (33)
- (34) Dunne, L., Eales, S., Edmunds, M., Ivison, R., Alexander, P., & Clements, D. L. 2000, MNRAS, 315, 115
- (35)
- (36) Elbaz, D., Cesarsky, C. J., Chanial, P., Aussel, H., Franceschini, A., Fadda, D., & Chary, R. R. 2002, A&A 384, 848
- (37)
- (38) Elbaz, D. et al. 1999, A&A, 351, L37
- (39)
- (40) Fadda, D., Jannuzi, B. T., Ford, A., & Storrie-Lombardi, L., J. 2004, AJ, 128, 1
- (41)
- (42) Gordon, K. D., et al. 2005, PASP, 117, 503
- (43)
- (44) Gruppioni, C., Pozzi, F., Zamorani, G., Ciliegi, P., Lari, C., Calabrese, E., La Franca, F., & Matute, I. 2003, MNRAS, 341, L1
- (45)
- (46) Hauser, M. G., & Dwek, E. 2001, ARA&A, 39, 249
- (47)
- (48) Helou, G., Soifer, B. T., & Rowan-Robinson, M. 1985, ApJ, 298, L7
- (49)
- (50) Hesselroth, T., Ha, E. C., Pesenson, M., Kelly, D. M., Rivlis, G., & Engelbracht, C. W. 2000, Spaceborne Infrared Remote Sensing VIII, SPIE Conference Proceedings, 4131, 26
- (51)
- (52) King, A. J., & Rowan-Robinson, M. 2003, MNRAS, 339, 260
- (53)
- (54) Lagache, G., et al. 2004, ApJS, 154, 112
- (55)
- (56) Lonsdale, C. J., et al. 2004, ApJS, 154, 54
- (57)
- (58) Lortet, M.-C., Borde, S., & Ochsenbein, F. 1994, A&AS, 107 193
- (59)
- (60) Makovoz, D., & Marleau, F. R. 2005, PASP, in press
- (61)
- (62) Marleau, F. R., et al. 2004, ApJS, 154, 66
- (63)
- (64) Miley, G. K., Neugebauer, G., & Soifer, G. T. 1985, ApJ, 293, L11
- (65)
- (66) Neugebauer, G., et al. 1984, ApJ, 278, L1
- (67)
- (68) Papovich, C., et al. 2004, ApJS, 154, 70
- (69)
- (70) Rieke, G. H., et al. 2004, ApJS, 154, 25
- (71)
- (72) Rodighiero, G., Fadda, D., Franceschini, A., & Lari, C. 2005, MNRAS, 357, 449
- (73)
- (74) Sanders, D. B., Mazzarella, J. M., Kim, D.-C., Surace, J. A., & Soifer, B. T. 2003, AJ, 126, 1607
- (75)
- (76) Soifer, B. T., Boehmer, G., Neugebauer, G., & Sanders, D. B. 1989, AJ, 98, 766
- (77)
- (78) Soifer, B. T., Sanders, D. B., Madore, B. F., Neugebauer, G., Danielson, G. E., Elias, J. H., Lonsdale, C. J., & Rice, W. L. 1987, ApJ, 320, 238
- (79)
- (80) Spoon, H. W. W., et al. 2004, ApJS, 154, 184
- (81)
- (82) Strauss, M. A., et al. 2002, AJ, 124, 1810
- (83)
- (84) Werner, M. W., et al. 2004, ApJS, 154, 1
- (85)
- (86) Xu, C., Lonsdale, C. J., Shupe, D. L., O’Linger, J., & Masci, F. 2001, ApJ, 562, 179
- (87)


| (s) | (mJy) | Area | ||||
|---|---|---|---|---|---|---|
| Field | 70m | 160m | 70m | 160m | (deg2) | |
| Main | 42 | 8 | 19 | 100 | 4.5 | |
| Verification | 252 | 42 | 8 | 50 | 0.35 | |
| Warm+Main | 84 | 14 | 3.3 | |||
Note. — The integration time () is the average integration time for the field. The approximate average noise levels are for point sources and do not include the absolute flux density calibration uncertainties.
| Source Name | (J2000) | (J2000) | Error | S70 | Flag |
|---|---|---|---|---|---|
| (deg) | (deg) | (arcsec) | (mJy) | ||
| (1) | (2) | (3) | (4) | (5) | (6) |
| FLS70 J172723.3+601626 | 261.84712 | 60.27414 | 1.9 | 81.412.9 | prf |
| FLS70 J172716.2+600051 | 261.81791 | 60.01433 | 1.6 | 1610.1244.6 | a120m |
| FLS70 J172709.5+600141 | 261.78960 | 60.02815 | 2.1 | 77.312.7 | prf |
| FLS70 J172704.7+593736 | 261.76978 | 59.62680 | 2.0 | 62.19.9 | prf |
| FLS70 J172651.1+601851 | 261.71329 | 60.31419 | 3.3 | 34.77.0 | prf |
Note. — The entire xFLS 70m catalog () is presented in the electronic edition of the Astronomical Journal. A portion of Table 2 is shown here for guidance regarding the form and content of the catalog. Column (1) gives the source name following the IAU designations (Lortet, Borde, & Ochsenbein 1994). Column (2) and column (3) are the right ascension () and declination () J2000.0 source positions in decimal degrees. Column (4) provides the radial positional uncertainty in arcsec (). Column (5) gives the flux density measurement in mJy. The flux density errors include the uncertainties of the absolute flux density scale. Column (6) provides a flag for the flux density measurement method. A flag of “prf” indicates that the source was fitted by the PRF, while a flag starting with an “a” indicates that an aperture measurement was used (for cases of extended sources and/or close blends). The number following the “a” gives the aperture diameter in arcsec; e.g., a120 implies an aperture diameter of . Sources with aperture flags ending with a “m” represent bright galaxies not well fitted by the PRF and with nearby companions; in these cases, the flux density of the bright galaxy was derived by subtracting the PRF measurement(s) of the nearby faint point source(s) from the total aperture flux density.
| Source Name | (J2000) | (J2000) | Error | S160 | Flag |
|---|---|---|---|---|---|
| (deg) | (deg) | (arcsec) | (mJy) | ||
| (1) | (2) | (3) | (4) | (5) | (6) |
| FLS160 J172902.1+600523 | 262.25801 | 60.08859 | 3.4 | 294.876.0 | prf |
| FLS160 J172855.5+600026 | 262.23039 | 60.00619 | 7.4 | 154.444.2 | prf |
| FLS160 J172851.3+600821 | 262.21295 | 60.13807 | 3.8 | 293.776.4 | prf |
| FLS160 J172826.5+600539 | 262.10963 | 60.09320 | 3.0 | 1211.0310.5 | a192 |
| FLS160 J172817.7+600100 | 262.07271 | 60.01573 | 5.9 | 188.450.97 | prf |
Note. — The entire xFLS 160m catalog () is presented in the electronic edition of the Astronomical Journal. A portion of Table 3 is shown here for guidance regarding the form and content of the catalog. Column headers are the same as described in Table 2.
| Average Sν | Slow | Shigh | Number | Completeness | |
|---|---|---|---|---|---|
| (mJy) | (mJy) | (mJy) | (gal sr-1 Jy1.5) | ||
| 8.1 | 7 | 9 | 46 | 0.500.15 | 25561030 |
| 10.6 | 9 | 13 | 61 | 0.800.08 | 2073 575 |
| 16.5 | 13 | 20 | 40 | 1.00.05 | 1866 522 |
| 24.5 | 20 | 30 | 21 | 1.00.03 | 1847 582 |
| 46.0 | 30 | 70 | 18 | 1.00.03 | 1912 626 |
| 13.9 | 12 | 16 | 230 | 0.600.15 | 2172744 |
| 18.4 | 16 | 22 | 230 | 0.900.08 | 1883453 |
| 26.7 | 22 | 34 | 200 | 1.000.05 | 1931466 |
| 40.3 | 34 | 50 | 89 | 1.000.03 | 1800451 |
| 61.2 | 50 | 80 | 54 | 1.000.03 | 1660439 |
| 110.9 | 80 | 140 | 25 | 1.000.03 | 1698514 |
| 227.9 | 140 | 440 | 17 | 1.000.03 | 1398464 |
Note. — The first five entries are the 70m counts for the verification field, while the remaining entries are for the warm+main 70m survey. The uncertainties for the differential counts () include the Poisson noise, the completeness uncertainty, and the absolute flux density calibration uncertainty of 15%. The counts are based on the source lists, corrected for completeness.
| Average Sν | Slow | Shigh | Number | Completeness | |
|---|---|---|---|---|---|
| (mJy) | (mJy) | (mJy) | (gal sr-1 Jy1.5) | ||
| 68.0 | 56.4 | 77.0 | 17 | 0.550.15 | 17156 8978 |
| 85.9 | 77.0 | 97.5 | 15 | 0.850.08 | 17541 8155 |
| 116.4 | 97.5 | 138.6 | 13 | 0.970.05 | 14231 6678 |
| 101.8 | 92.4 | 112.9 | 60 | 0.550.15 | 12682 6104 |
| 124.0 | 112.9 | 133.4 | 45 | 0.650.1 | 13170 5688 |
| 152.8 | 133.4 | 174.5 | 44 | 0.800.08 | 8825 3674 |
| 211.7 | 174.5 | 256.6 | 43 | 0.920.05 | 8472 3460 |
| 320.7 | 256.6 | 420.8 | 25 | 1.00.05 | 6399 2738 |
| 679.0 | 420.8 | 882.6 | 10 | 1.00.05 | 5935 2926 |
Note. — The first three entries are the 160m counts for the verification field, while the remaining entries are for the main 160m survey. The uncertainties for the differential counts () include the Poisson noise, the completeness uncertainty, and the absolute flux density calibration uncertainty of 25%. The counts are based on the source lists, corrected for completeness.