Black Hole Mass of the Ultraluminous X-ray source M82 X–1
Abstract
We report the first clear evidence for the simultaneous presence of a low frequency break and a QPO in the fluctuation power spectrum of a well known ultraluminous X-ray source (ULX) in M82 using long XMM-Newton observations. The break occurs at a frequency of . The QPO has a centroid at , a coherence and an amplitude (rms) of in the band. The power spectrum is approximately flat below the break frequency and then falls off above the break frequency as a power law with the QPO superimposed. This form of the power spectrum is characteristic of the Galactic X-ray binaries (XRBs) in their high or intermediate states. M82 X-1 was likely in an intermediate state during the observation. The EPIC PN spectrum is well described by a model comprising an absorbed power-law () and an iron line at with a width and an equivalent width of . Using the well established correlations between the power and energy spectral parameters for XRBs, we estimate a black hole mass for M 82 X-1 in the range of including systematic errors that arise due to the uncertainty in the calibration of the photon spectral index versus QPO frequency relation.
Subject headings:
accretion, accretion disks — stars: individual (M82 X-1) — X-rays: stars1. Introduction
Ultra-luminous X-ray sources (ULXs) are extra-nuclear point X-ray sources with luminosities exceeding . These objects were first discovered with Einstein observations (reviewed by Fabbiano 1989). The nature of ULXs continues to be an enigma, since their adopted isotropic high energy output surpasses the Eddington limit of even the most massive stellar mass black holes (BHs), sometimes by large factors. Several models have been proposed to explain the high luminosities of ULXs. The most popular is the “intermediate mass black hole (IMBH)” with mass (e.g., Colbert & Mushotzky 1999, hereafter CM99) bridging the gap between stellar mass BHs in XRBs and super-massive BHs in active galactic nuclei 111In CM99 the BH mass was evaluated using the best-fit parameters of the XSPEC BMC model (see Shrader & Titarchuk 1999 for details). Other popular models include XRBs with anisotropic emission (King et al. 2001), beamed XRBs with relativistic jets directly pointing towards us i. e., scaled down versions of blazars (Mirabel & Rodriguez 1999), and XRBs with super-Eddington accretion rates (Begelman 2002). Several observations suggest that ULXs may be similar or scaled up versions of XRBs. Discovery of orbital modulations from several ULXs (Bauer et al. 2001; Sugiho et al. 2001) implies their binary nature. Recent Chandra and XMM-Newton observations of ULXs show soft X-ray excess emission which has been interpreted as the emission from accretion disks with temperatures in the range (see Shrader & Titarchuk 2003 and review by Miller & Colbert 2003 and references therein). Observations of spectral transitions between low/hard and high/soft states in two ULXs in IC 342 (Kubota et al. 2001) further demonstrate their similarity with the XRBs. The recent observation of a break at a frequency of in the power density spectrum (PDS) of the ULX in NGC 5408 suggests a BH mass of (Soria et al. 2004).
The enigmatic nature of ULXs can be understood by determining their BH masses. The most reliable method is to measure the mass function through the secondary mass and orbital parameters such as velocities, period, orbit size etc., which can be measured only if the secondary is optically identified. There are two cases of optical identification (Kuntz et al. 2005; Liu et al. 2004); however, the orbital parameters of any ULX binary system are yet to be measured. Good progress can still be made by establishing a direct physical connection between ULXs and XRBs. This can be done by comparing the characteristic time scales such as those associated with the low frequency quasi-periodic oscillations (QPOs). However, this comparison is ambiguous without the information about a low frequency break, the shape of the PDS and energy spectrum.
M82 X-1 is one of the brightest ULX (CXO M82 J095550.2+694047, source 7 in Matsumoto et al. 2001) that is well suited for a determination of the shape of the PDS. Chandra High Resolution Camera observations showed that the source is unresolved and off-nuclear (Matsumoto et al. 2001). The ULX has no optically bright counterpart (Kaaret et al. 2001): there is a likely IR counterpart which is a super star cluster (Kaaret et al. 2004). Recently, Strohmayer & Mushotzky (2003), hereafter SM03, discovered a QPO in M82 X-1 at a frequency of based on a XMM-Newton observation. They also found QPOs in the frequency range in the RXTE data. Fiorito & Titarchuk (2004), hereafter FT04 apply a new method to determine the BH mass of M82 X-1. The method uses the spectral index-QPO low-frequency correlation that has been recently established in BH XRBs GRS 1915+105, XTE J1550-564, 4U 1630-47, and others (Titarchuk & Fiorito 2004, hereafter TF04) . Using scaling arguments and the correlation derived from Galactic BHs, they conclude that M82 X-1 is an intermediate mass BH of order 1000 M⊙. We revisit the BH mass estimate in M82 X-1 using new data on the power spectrum and energy spectra.
2. Observation, Data Reduction & Analysis
M82 was observed using XMM-Newton on 2001 May 5 for and again on 2004 April 21 for . The first observation led to the discovery of a QPO from the ULX (SM03). Here we consider the EPIC data from the second observation only. The EPIC PN and MOS cameras were operated in the full frame mode using the medium filter. We used the SAS version 6.1 and the most recent calibration data base to process and filter the event data. Examination of the background rate above showed that the observation is completely swamped by the particle background after an elapsed time of and this latter period was therefore excluded from the rest of the analysis.
In the central regions of M82, Chandra images revealed diffuse emission and several point sources, M82 X-1 being the brightest among them (Matsumoto et al. 2001). The diffuse emission is evident in the EPIC images but the point sources are not resolved. Following SM03, we extracted PN and MOS events using a circular region around the bright point source whose position is consistent with the Chandra position of M82 X-1. Above , the diffuse emission contributes only to the point source inside the circular region. At the faintest flux level of M82 X-1, nearby point sources contribute to the X-ray emission in the region (Matsumoto et al. 2001; SM03).
2.1. The power spectrum
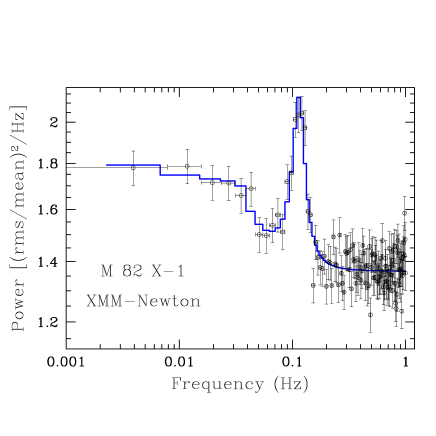
For temporal analysis, we combined the PN and MOS data and used the continuous exposure of during which both the PN and MOS cameras operated simultaneously. We calculated a power density spectrum (PDS) using the background corrected PN+MOS light curves sampled at . Figure 1 (left) shows the PDS of M82 X-1 rebinned by a factor of yielding a frequency resolution of . The PDS continuum is approximately flat at low frequencies below and then falls off approximately following a power law up to where the white noise arising from the poisson errors starts to dominate the PDS. There is a prominent QPO with its peak frequency near .
We fitted the PDS with two models: () a broad Lorentzian for the continuum and a narrow Lorentzian for the QPO, and () a broken power law (BPL) for the continuum and a Lorentzian (L) for the QPO. We also used a constant to account for the poisson noise. Both models provided statistically acceptable fits, giving a minimum of for 121 degrees of freedom (dof) and for 120 dof for the double Lorentzian and BPLL models, respectively. The errors on the best-fit PDS model parameters, quoted below, are at a level. The double Lorentzian model resulted in a QPO centroid frequency , a width , an amplitude and the broad Lorentzian centroid , a width and an amplitude . The BPLL model resulted in a QPO centroid frequency , a width , an amplitude , and broken power-law indices of below the break frequency and above the break frequency, and an amplitude at a reference frequency of . The total integrated power () and the QPO power expressed as are and , respectively. The use of a broken power law is an improvement ( for two additional parameters) over a simple power law at a statistical significance level of based on the maximum likelihood ratio test. Thus the break in the continuum of the power spectrum is real. The best-fit BPLL model is shown in Fig. 1(left) as a thick line.
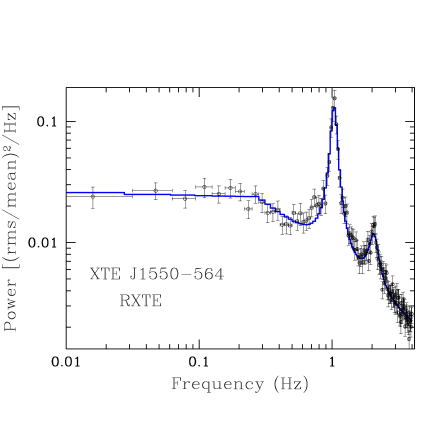
For comparison we have also calculated the PDS of an XRB XTE J1550-564 using the RXTE observation of 10 September 1998. XTE J1550-564 shows a large range in its low frequency QPO centroid (; Sobczak et al. 2000a). Our choice of the particular RXTE observation relies on the fact that XTE J1550-564 showed a power-law (PL) photon index of on 10 September 1999 (Sobczak et al. 2000b), which is very similar to the photon index of M82 X-1 (see below). Fig. 1(right) shows the PDS of XTE J1550-564 calculated from the PCA light curve sampled at which was obtained from the RXTE public data archive. We used a model comprising a broken PL and two Lorentzians to fit the PDS. This model resulted in a statistically acceptable fit (minimum for 118 dof). The broken PL has best-fit parameters: below the break frequency , above the break and an amplitude at a reference frequency of . The two QPOs have centroid frequencies and , widths and and amplitudes and for the fundamental and first harmonic, respectively. The total integrated power () and the QPO (fundamental) power expressed as are and , respectively.
2.2. The energy spectrum
We extracted PN and MOS spectra using a circular region centered at the position of M82 X-1. We also extracted PN and MOS background spectra using nearby circular regions free of sources. We created appropriate response files using the SAS tasks rmfgen and arfgen. The spectra were grouped to a minimum of counts per spectral channel and analyzed with XSPEC 11.3. The errors on the best-fit spectral parameters are quoted at a confidence level. An absorbed power law (PL) model fitted to the PN data showed strong soft excess emission below due to the presence of the diffuse soft X-ray emission in the source extraction region. We ignored the data below and performed the spectral fitting of the PN and MOS data separately. A simple PL model poorly describes both the PN and MOS data. We show the ratio of the PN data and the best-fitting absorbed PL model in Figure 2(a). A prominent iron K line at is evident. Addition of a Gaussian line (GL) to the PL model improved the fit significantly ( for three additional parameters) and resulted in a good fit (minimum for 944 dof. The Gaussian line has a centroid energy , a width , a line flux and an equivalent width of . The best-fit photon index is and the the absorption column is . The observed flux is and the corresponding luminosity is assuming a distance of (Sakai & Madore 1999). In Figure 2b, we show the best-fit PLGL model to the EPIC PN data. The PLGL model fitted to the MOS data resulted in slightly flatter PL (), an absorption column and a weaker iron line, .
3. Discussion
Based on long XMM-Newton observations, we show clear evidence for the simultaneous presence of a low frequency break at and a QPO with centroid frequency in the power spectrum of M82 X-1. The QPO frequency is similar to that found from the RXTE observation of 1997 July 21, while it is about a factor of two larger than that found in the first XMM-Newton observation of 2001 May and an RXTE observation of 1997 February 24 (SM03). Thus the QPO frequency of M82 X-1 is variable.
The M82 X-1 PDS is flat below the break frequency and then falls off above the break as a power law with a prominent QPO on top of it. This form of the PDS is characteristic of XRBs in their high/soft state or intermediate state (e.g., McClintock & Remillard 2003; see also Fig. 1 for a comparison). PDSs of many BH XRBs display low frequency QPOs in the frequency range of (Remillard et al. 2002). The QPO frequency is strongly correlated with the break frequency (Wijnands & van der Klis 1999). The break frequency is always lower than the QPO frequency by at least a factor of three (see, Wijnands & van der Klis 1999). M82 X-1 follows this correlation as its QPO frequency is about a factor three larger than the break frequency. Thus the PDS of the ULX is very similar to the XRB PDSs in their high/soft or transition state.
Since the characteristic time scales of accretion powered sources scale with BH mass, the similarity of the PDSs of M82 X-1 and XRBs provides the opportunity to determine the ratio of their BH masses. However, as stated above, the XRBs show a large range in their low frequency QPO and break frequencies. Therefore, the frequency scaling factor between any two power spectra of two XRBs will lead to an incorrect determination of the ratio of their BH masses. Fortunately, the PDS features (break and QPO frequencies) are well correlated with the energy spectral parameters. The low frequency QPOs are related to the flux of the PL energy spectral component. The variable frequency QPOs in XTE J1550-564 and GRO J1655-40 appear only when the PL contributes more than of the flux (Sobczak et al. 2000a and references therein). GRS 1915+105 also shows similar behavior (Muno et al. 1999). The PL index is well correlated with the centroid of the low frequency QPOs in GRS 1915+105 (Vignarca et al. 2003) and XTE J1550+564 (Sobczak et al. 2000a, 2000b). The photon index increases with the QPO frequency until it saturates. The frequency scaling factor between the low frequency QPOs of two XRBs with similar PL photon indices can be used to determine the ratio of their BH masses (TF04; FT04). Thus it is crucial to determine the shape of X-ray spectrum and detect both the QPO and the low frequency break in order to make sure that the detected QPO lies at a low frequency, but above the break frequency, and on top of a PDS power-law continuum.
The long XMM-Newton observation of M82 X-1 has yielded all 3 pieces of information required to determine its BH mass. The photon index of the PL is as determined from the high signal-to-noise PN data. XRBs show a range of PL photon indices from in their low/hard state to in their high/soft state. Thus M82 X-1 is likely in a state intermediate between the high and low states. Sobczak et al. (2000a) studied the spectral behavior of XTE J1550-564 during its 1998–1999 outburst using 209 pointed observations with RXTE. They used a model consisting of a multicolor disk blackbody and a PL to fit the spectra and found that the spectra gradually steepen from to for XTE J1550-564. The low frequency QPO is also found to vary from . At a PL photon index of (), XTE J1550-564 shows a low frequency QPO at () (Sobczak et al. 2000a; 2000b). Noting that the BH mass scales inversely in proportion to the QPO frequency and the BH mass of XTE J1550-564 is about (Titarchuk & Shrader 2002, Shrader & Titarchuk 2003), we can determine the BH mass of the M82 X-1 as (ULX) (XTE J1550-564)/(ULX) (XTE J1550-564) . Another XRB GRS 1915+105 shows a low frequency QPO with its centroid at () when its PL photon index is () (Vignarca et al. 2003). Noting that that the BH mass of GRS 1915+105 is estimated dynamically from the IR spectroscopic observation of its companion star (Greiner et al. 2001), the BH mass for M82 X-1 is (ULX) . Thus, scaling the mass of M 82 X-1 from the relation calibrated by the dynamical masses of several galactic BHs, we find (ULX) .
The QPO frequencies and photon indices for M82 X-1, XTE J1550-564 and GRS 1915+105 correspond to a region of steep dependence in the relation (see FT04). It is therefore likely that the uncertainty in the calibration of the relation may introduce an additional factor of two uncertainty in the determination of the BH mass of M 82 X-1. Thus the true BH mass of M 82 X-1 is most likely in the range of . This is at least a factor of lower than the previous estimate by FT04, which can be explained by the lower values of the QPO frequencies for M82 X-1 in our paper compared with those in FT04. The above estimate of the BH mass is based on the assumption that M 82 X-1 also follows the relation found for XRBs. XMM-Newton and RXTE observations of M 82 X-1 have revealed that the QPO frequency is variable (SM03). The photon index is also variable (FT04) but appears to be inconsistent with the relation for XRBs. However, there may be systematic errors in the photon indices measured with XMM-Newton and RXTE due to contamination from nearby sources, as indicated by large apparent changes in the effective absorption column. Chandra ACIS observations of M 82 X-1 were used to suggest an effective column in the range (SM03), while XMM-Newton and RXTE observations have been used to suggest large columns in the range (see Section 3.2, FT04). Both XMM-Newton and RXTE observations suffer from contamination by nearby sources. A small contribution from nearby sources may significantly alter the spectral shape of the ULX and a varying contribution may lead to the observed changes in the absorption column. Thus, based on the currently available X-ray data on M 82 X-1, it is neither possible to prove nor rule out the relation similar to that found for XRBs.
M82 X-1 is one of the brightest ULXs. During the second XMM-Newton observation, its luminosity was (SM03), while it was a factor of brighter in the first XMM-Newton observation. Based on the first XMM-Newton observation, SM03 quoted a bolometric luminosity of , equivalent to the Eddington luminosity for a BH mass in the range of . Given the uncertainty in the contamination by nearby X-ray sources, our estimated BH mass of M82 X-1 is marginally consistent with the observed luminosity and the Eddington ratio.
References
- Colbert & Mushotzky (1999) Colbert, E. J. M. & Mushotzky, R. F. 1999, ApJ, 519, 89 (CM99)
- Fabbiano (1989) Fabbiano, G. 1989, ARA&A, 27, 87
- Fiorito & Titarchuk (2004) Fiorito, R., & Titarchuk, L. 2004, ApJ, 614, L113 (FT04)
- Greiner et al. (2001) Greiner, J., Cuby, J. G., & McCaughrean, M. J. 2001, Nature, 414, 522
- Liu et al. (2004) Liu, J.-F., Bregman, J. N., & Seitzer, P. 2004, ApJ, 602, 249
- Kaaret et al. (2001) Kaaret, P., et al., 2001, MNRAS, 321, L29
- Kaaret et al. (2004) Kaaret, P., Alonso-Herrero, A., Gallagher, J. S., Fabbiano, G., Zezas, A., & Rieke, M. J. 2004, MNRAS, 348, L28
- Kuntz et al. (2005) Kuntz, K. D., et al. 2005, ApJ, 620, L31
- Markwardt et al. (1999) Markwardt, C. B., Swank, J. H., & Taam, R. E. 1999, ApJ, 513, L37
- Matsumoto et al. (2001) Matsumoto, H., et al., 2001, ApJ, 547, L25
- McClintock & Remillard (2003) McClintock, J. E., & Remillard, R. A. 2003, ArXiv Astrophysics e-prints, arXiv:astro-ph/0306213
- Miller & Colbert (2003) Miller, M. C. & Colbert, E. J. M 2003, ArXiv Astrophysics e-prints, 8402
- Remillard et al. (2002) Remillard, R., Muno, M., McClintock, J. E., & Orosz, J. 2002, New Views on Microquasars, 49
- Sakai & Madore (1999) Sakai, S., & Madore, B. F. 1999, ApJ, 526, 599
- Shrader & Titarchuk (2003) Shrader, C.R. & Titarchuk, L. 2003, ApJ, 598, 168
- Shrader & Titarchuk (1999) Shrader, C.R. & Titarchuk, L. 1999, ApJ, 521, L121
- Sobczak et al. (2000a) Sobczak, G. J., et al., 2000a, ApJ, 531, 537
- Sobczak et al. (2000b) Sobczak, G. J., et al., 2000b, ApJ, 544, 993
- Soria et al. (2004) Soria, R., Motch, C., Read, A. M., & Stevens, I. R. 2004, A&A, 423, 955
- Strohmayer & Mushotzky (2003) Strohmayer, T. E., & Mushotzky, R. F. 2003, ApJ, 586, L61 (SM03)
- Titarchuk & Fiorito (2004) Titarchuk, L., & Fiorito, R. 2004, ApJ, 612, 988 (TF04)
- Vignarca et al. (2003) Vignarca, F., Migliari, S., Belloni, T., Psaltis, D., & van der Klis, M. 2003, A&A, 397, 729