A “Combination Nova” Outburst in Z Andromedae: Nuclear Shell Burning Triggered by a Disk Instability
Abstract
We describe observational evidence for a new kind of interacting-binary-star outburst that involves both an accretion instability and an increase in thermonuclear shell burning on the surface of an accreting white dwarf. We refer to this new type of eruption as a combination nova. In late 2000, the prototypical symbiotic star Z Andromedae brightened by roughly two magnitudes in the optical. We observed the outburst in the radio with the VLA and MERLIN, in the optical both photometrically and spectroscopically, in the far ultraviolet with , and in the X-rays with both and . The two-year-long event had three distinct stages. During the first stage, the optical rise closely resembled an earlier, small outburst that was caused by an accretion-disk instability. In the second stage, the hot component ejected an optically thick shell of material. In the third stage, the shell cleared to reveal a white dwarf whose luminosity remained on the order of for approximately one year. The eruption was thus too energetic to have been powered by accretion alone. We propose that the initial burst of accretion was large enough to trigger enhanced nuclear burning on the surface of the white dwarf and the ejection of an optically thick shell of material. This outburst therefore combined elements of both a dwarf nova and a classical nova. Our results have implications for the long-standing problem of producing shell flashes with short recurrence times on low-mass white dwarfs in symbiotic stars.
Subject headings:
binaries: symbiotic—novae, cataclysmic variables—stars: dwarf novae—stars: individual (Z Andromedae)—stars: winds, outflows—X-rays: binaries1. Introduction
1.1. Symbiotic-Star Outbursts
Symbiotic stars are interacting binaries in which material is transferred from an evolved red-giant star to a more compact, hot star, usually a white dwarf (WD; see, e.g., Kenyon, 1986; Corradi, Mikołajewska, & Mahoney, 2003, and references therein). In most symbiotics, the red giant under-fills its Roche lobe, and the mass transfer proceeds via gravitational capture of the red giant’s wind. An accretion disk may or may not form (depending primarily on the relative velocity of the red-giant wind and the accreting white dwarf; Livio, 1988). Radiation from the accreting WD partially ionizes the nebula formed by the red-giant wind, and this ionized nebula gives rise to optical through far ultraviolet (FUV) emission lines (Kenyon, 1986; Mürset et al., 1991; Espey et al., 1996; Espey & McCandliss, 2003; Nussbaumer, 2003).
The hot components in symbiotic stars typically have luminosities of around (Mürset et al., 1991). To produce such a high luminosity by accretion onto the WD alone, the accretion rate would need to be . But it is difficult for the WD to accrete from the red-giant wind at this rate since red giants in symbiotics typically lose mass at (Seaquist & Taylor, 1990). In addition, is well above the accretion rate needed to produce quasi-steady thermonuclear shell burning (Paczyński & Żytkow, 1978; Sion, Acierno, & Tomczyk, 1979; Paczyński & Rudak, 1980; Iben, 1982; Sion & Starrfield, 1986; Sion & Ready, 1992; Sion & Starrfield, 1994). Sokoloski et al. (2001) found that stochastic optical flickering from an accretion disk, like that seen in cataclysmic variable stars, is undetectable in the vast majority symbiotics – probably because it is hidden by nuclear-shell-burning light that has been reprocessed into the optical by the nebula. In fact, the inferred luminosities of are easily produced by the nuclear burning of hydrogen-rich material at the rate of a few times . Accretion onto the WD in a typical symbiotic can supply fuel at this rate (Iijima, 2002). Thus, some level of quasi-steady nuclear shell burning on the surface of the WD appears to be a common feature of symbiotic systems.
Symbiotic stars also experience several different types of outbursts. The most common type of outburst, termed a classical symbiotic outburst, recurs roughly every decade or so and has optical amplitudes of several mag (Kenyon, 1986). The nature of these eruptions is not yet known. Their peak luminosities appear to be too high for them to be disk instabilities like those of dwarf novae (Kenyon, 1986; Mikołajewska et al., 1995). They also recur too frequently to be nova-like thermonuclear runaways those in RS Oph and T CrB (Iben, 1982; Fujimoto, 1982; Kenyon & Truran, 1983; Starrfield, Sparks, & Truran, 1985; Livio, Prialnik, & Regev, 1989; Mikołajewska et al., 1995) or even weak shell flashes (Sion, Acierno, & Tomczyk, 1979). The fundamental difficulty is that most symbiotics contain low-mass WDs. Short recurrence times can only be produced for thermonuclear runaways on WDs whose masses are very close to the Chandrasekhar limit. For example, Sion, Acierno, & Tomczyk (1979) found that even a 1.2- WD accreting at required more than 600 yr between shell flashes. Thus, some additional physics must be involved in classical symbiotic outbursts. Since the mass loss during classical symbiotic outbursts can take the form of a collimated jet (e.g., Kellogg, Pedelty, & Lyon, 2001; Crocker et al., 2001; Brocksopp et al., 2004), the nature of these outbursts is also linked to the issue of jet formation.
Classical symbiotic-star optical outbursts are tied to changes in the hot component of the binary. They can therefore be the optical brightening of either the accretion disk, the white dwarf, or both (Kenyon & Webbink, 1984). An accretion disk brightens when mass transfer through the disk increases, either because more material is being fed to the disk or because of an accretion-disk instability. The white dwarf can brighten in the optical due to either a decrease in effective temperature at constant bolometric luminosity, which shifts the WD spectral energy distribution to lower energies, or an increase in the nuclear burning rate on the white-dwarf surface. A factor that complicates this picture slightly is the nebula, which reprocesses high-energy photons into the optical, where most outbursts are primarily observed. Symbiotic stars can therefore also brighten in the optical due to an increase in reprocessed high-energy photons (see Nussbaumer & Vogel, 1989, for a model of the reprocessing).
Existing models for classical symbiotic outbursts include expansion of the WD photosphere at constant bolometric luminosity due to the accretion rate rising above the maximum value for steady burning (Tutukov & Yungelson, 1976; Iben, 1982), a thermal pulse or shell flash (Kenyon & Truran, 1983), or a dwarf-nova-like accretion-disk instability (Duschl, 1986a, b; Mikołajewska et al., 2002). The photospheric-expansion model has shown promise for supersoft X-ray sources, where it explains the inverse relationship between optical and X-ray fluxes seen in some objects (e.g., RX J0513-69; Southwell et al., 1996), which arises from changes in the location of the peak of the black-body spectral energy distribution. Both the thermal-pulse and accretion-disk-instability models are related to phenomena that occur in cataclysmic variables (CVs) — runaway nuclear burning in classical or recurrent novae, and accretion-disk limit cycles in dwarf novae.
1.2. Z Andromedae
Z Andromedae (Z And) is the prototype for the class of symbiotic stars (Kenyon, 1986; Mikołajewska et al., 1988; Corradi, Mikołajewska, & Mahoney, 2003). It has an orbital period of 759 d (Formiggini & Leibowitz, 1994; Mikołajewska & Kenyon, 1996), orbital inclination and orientation angles of and respectively (Schmid & Schild, 1997), and a WD mass of (Schmid & Schild, 1997, for a total system mass of between 1.3 and 2.3 ). Distance estimates for Z And range from 0.6 kpc to 2.19 kpc, with an average value of kpc (see Kenny, 1995, and references therein).
Zandstra-method estimates of the quiescent WD luminosity give (Mürset et al., 1991), where is the WD (hot component) luminosity. It is therefore very likely that some degree of nuclear shell burning is taking place on the WD surface. Z And is also the only symbiotic star for which coherent optical oscillations at the WD spin period of 28 minutes convincingly indicate the presence of a strongly magnetic WD (Sokoloski & Bildsten, 1999). It was the first binary known to contain a WD with both a strong magnetic field and quasi-steady nuclear shell burning. Finally, Z And is one of a small ( 10, but growing) number of symbiotic systems known to produce collimated outflows in the form of non-relativistic jets (Brocksopp et al., 2004).
The long-term light curve of Z And shows many examples of classical symbiotic outbursts (see Kenyon, 1986, p. 4) and demonstrates the non-uniformity of this poorly defined type of eruption. The outbursts sometimes come in pairs (as in 1984 and 1986), or in a series of eruptions with decreasing maximum brightnesses separated in time by slightly less than the orbital period (Kenyon & Webbink, 1984; Formiggini & Leibowitz, 1994). In addition to having different sizes, the outbusts in Z And also have different shapes, with some having a steeper rise than decline (as in 1997 and comparable to dwarf-nova light curves), others having a rise that occurs at roughly the same pace as the decay (such as in 1984), and still others having more complex shapes. In the 2000–2002 event, the size of the outburst ( mag) was typical for the system, too large to be a simple disk instability, and much smaller than outbursts of the symbiotic recurrent novae. It was instead closer to the 3 mag of a typical symbiotic (slow) nova, as in AG Peg (Kenyon, Proga, & Keyes, 2001).
Fernández-Castro et al. (1995) demonstrated the value of multi-wavelength observations of classical symbiotic outbursts with their study of the 1984–1986 pair of outbursts of Z And. They found that a shell of material was ejected during each of these two outbursts, and that the overall behavior of the UV lines and radio fluxes was consistent with an accretion-rate fluctuation pushing the system over the maximum accretion rate for quasi-steady nuclear burning. Sokoloski & Bildsten (1999), however, detected a 28-minute oscillation from magnetic hot spots on the WD surface throughout the small outburst in 1997 and concluded that the WD surface was not hidden by a shell ejection during that event. They suggested that it could instead have been due to an accretion-disk instability.
To further investigate the nature and cause of classical symbiotic-star outbursts, we obtained multi-wavelength data, including observations with the , , and satellites, the VLA and MERLIN radio interferometers, and ground-based optical spectroscopy and photometry, during the recent 2000–2003 activity phase of Z And. We describe these observations and results in §2. In §3, we use the data to estimate the effective-temperature and luminosity evolution of the WD, and to investigate the ejection of a shell of material associated with the activity in 2000–2001. The WD temperatures and luminosities help us determine that the 1997 outburst was due to an accretion-disk instability similar to those of dwarf novae, and that the 2000–2002 event was due to both an accretion-disk instability and an increase in the rate of shell burning on the WD. In §4, we propose a combination nova model for the 2000–2002 outburst of Z And where the 2000-2003 activity period was triggered by an accretion-disk instability, but then primarily powered by the resulting increase in nuclear burning on the surface of the white dwarf. We summarize our findings in §5. UT dates are used throughout this paper.
2. Observations and Results
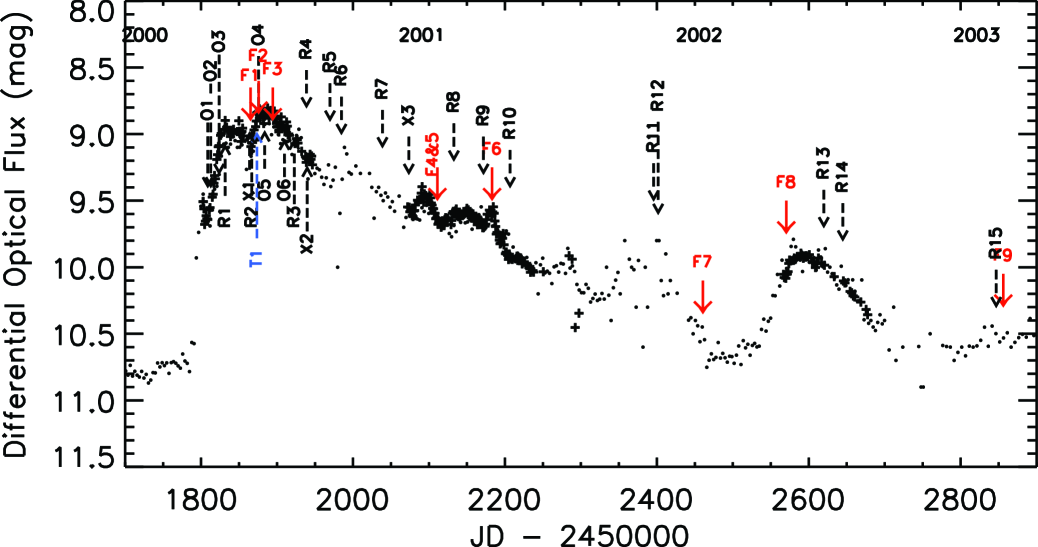
Although the hot components (e.g., white-dwarf plus accretion disk) in symbiotic stars emit most of their energy in the FUV, they also radiate significantly at radio through X-ray wavelengths. Important diagnostics are found in each of these observational regimes. To make progress on the long-standing problem of the fundamental nature and cause of classical symbiotic-star outbursts, we observed the 2000–2002 outburst of Z And in the radio, optical, FUV, and X-rays. A summary of the timing and coverage of our data is shown in Fig. 1. We provide a listing of the observations in Tables 1–6.
2.1. Nightly Monitoring
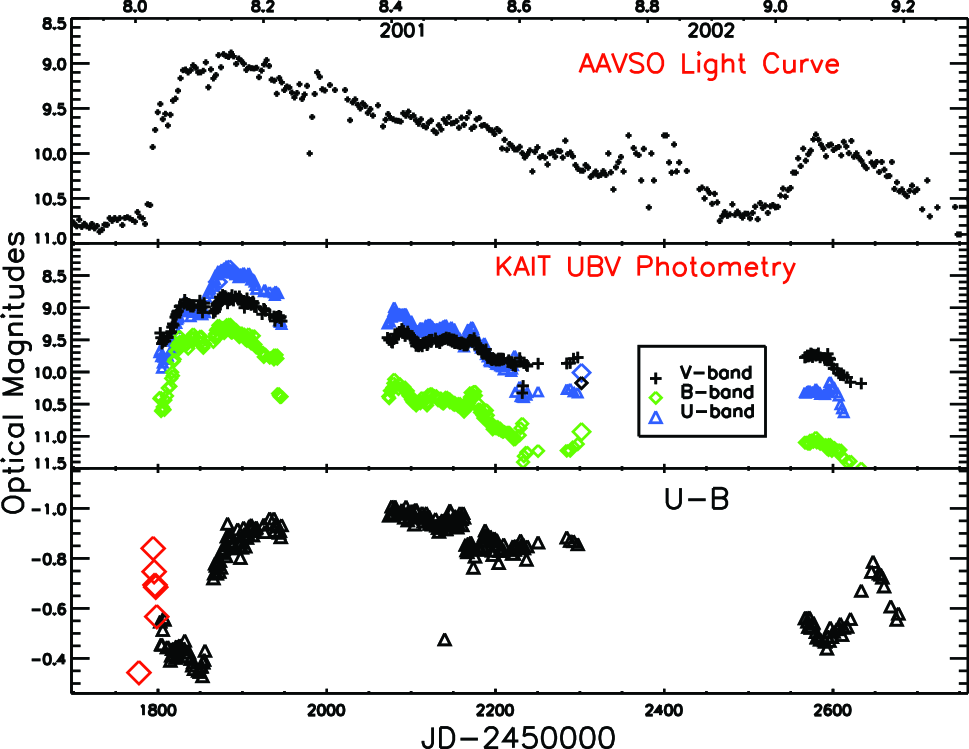
observations were taken nightly starting on JD 2451802 (2000 September 14) with the 0.76-m Katzman Automatic Imaging Telescope (KAIT; Li et al., 2000; Filippenko et al., 2001; Filippenko, 2005) at UCO/Lick Observatory on Mt. Hamilton near San Jose, CA. Z And is observable with KAIT from about mid-year through January, so the KAIT light curves are divided into three portions from the latter parts of 2000, 2001, and 2002 (see Fig. 2). With integration times ranging from 45 to 60 s for the band, 15 to 20 s for the band, and 5 to 10 s for the band, we typically obtained signal-to-noise ratios (S/N) of greater than 100 for differential photometry with respect to two comparison stars in the field of Z And. The KAIT light curves plotted in Fig. 2 have been converted from the KAIT filter system to the standard Johnson system and normalized using the absolute photometry of Tomov et al. (2003) and Skopal et al. (2002). We list the results of the photometric monitoring in Table 1.
The high quality of the KAIT light curves immediately reveals that the rise to optical maximum in 2000 had three distinct bursts, separated by two plateau periods. The first, second, and third optical rises took approximately 2.5, 2.5–3, and slightly more than 3 weeks, respectively, and the two plateaus lasted for about 1 week and then about 1 month respectively. Fig. 3 is a close-up view of the first 150 days of the 2000–2002 outburst, which clearly shows the three stages.
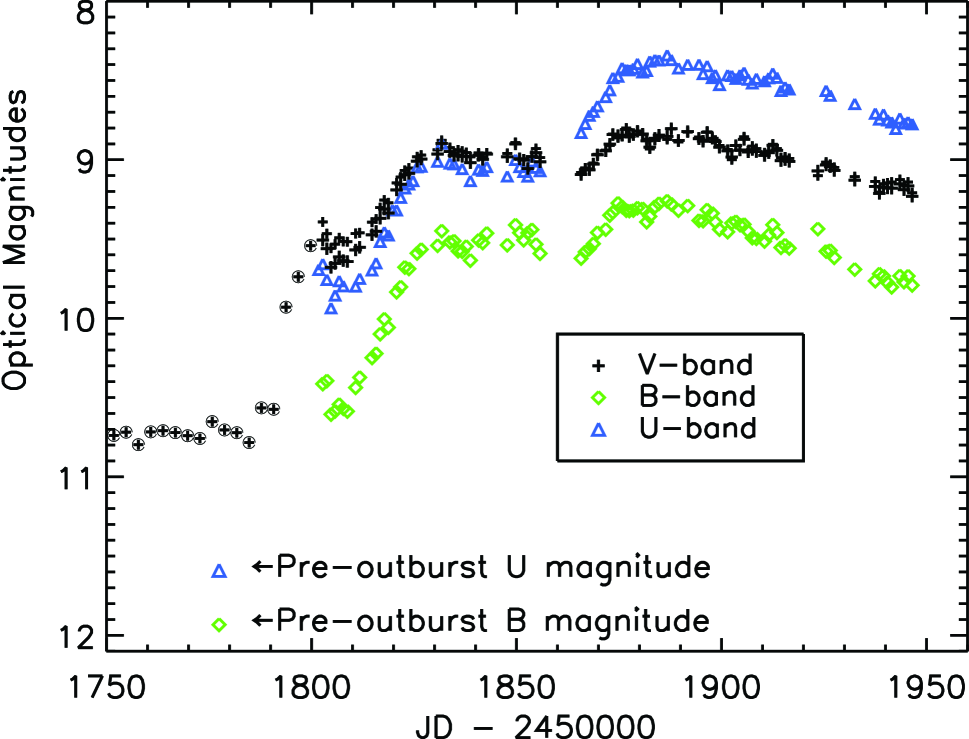
Combined with photometry from the American Association of Variable Star Observers (AAVSO) and Skopal et al. (2002) taken just before the beginning of the 2000–2002 outburst, the KAIT data show that the initial color evolution of the system also had three distinct stages (bottom panel of Fig. 2, and Fig. 3). During the first rise, the system became much bluer in both and . During the second rise, it became bluer still in , but maintained an approximately constant color. On the final rise to optical maximum, the color again became significantly bluer, suggesting a large increase in the temperature and UV luminosity of the hot component, whereas the color changed very little.
The optical decline was marked by 0.2–0.3 mag variations with no clear pattern. The color remained quite blue and fairly constant for roughly the first 300 days of the decline, and then began to redden. The color reddened more gradually throughout the entire decline. There was a small rebrightening around JD 2452600 (at the end of 2002), where the color initially reddened slightly, and then became more blue. However, the color never became as blue as when the optical flux was at a similar level during the main outburst. The peak of the rebrightening occured approximately 700 days after the main outburst peak. The time between the two peaks was thus slightly shorter than the orbital period of 759 d (Formiggini & Leibowitz, 1994; Mikołajewska & Kenyon, 1996), and similar to that of oscillations during the decline of previous large outbursts (e.g., Kenyon & Webbink, 1984).
2.2. Optical Spectroscopy
P. Berlind, M. Calkins, and several other observers acquired low-resolution optical spectra of Z And with FAST (Fabricant et al., 1998), a high-throughput slit spectrograph mounted at the Fred L. Whipple Observatory 1.5-m telescope on Mount Hopkins, Arizona. They used a 300 g mm-1 grating blazed at 4750 Å, a 3″-wide slit, and a thinned Loral 512 2688 pixel CCD. These spectra cover 3800–7500 Å at a resolution of 6 Å. Starting in 1994, we obtained over 800 spectra of Z And, with over 350 during the 2000–2002 outburst. Several additional spectra were obtained by R. Hynes near the optical peak with the 4-m William Herschel Telescope (WHT). We list the dates of selected optical spectroscopic observations taken near the beginning of the 2000–2002 outburst in Table 2.
We reduced the spectra with IRAF. After trimming the CCD frames at each end of the slit, we corrected for the bias level, flat-fielded each frame, applied an illumination correction, and derived a full wavelength solution from calibration lamps acquired immediately after each exposure. The wavelength solution for each frame has a probable error of 0.5 Å or better. To construct final 1-D spectra, we extracted object and sky spectra using the optimal extraction algorithm APEXTRACT within IRAF. Most of the resulting spectra have S/N 30 per pixel.
Optical spectra of Z And, the prototypical symbiotic star, generally have strong high-ionization emission lines superimposed on a red-giant absorption spectrum. Our spectra show two types of long-term variations. During quiescence, high-ionization lines, such as [Fe VII] and the Raman-scattered O VI lines at 6830 Å and 7088 Å, are roughly constant with orbital phase. Lower-ionization lines, including the H I Balmer lines, decrease significantly in intensity near phase 0.5, when the red giant lies in front of the hot component and obscures part of the nebula.
During outburst, all of the lines react to the changing luminosity of the hot component as well as the orbital geometry. In the 1997 outburst, the high-ionization lines increased in intensity relative to the continuum, suggesting an increase in the effective temperature of the hot component. The relative intensities of these lines faded during a portion of the 2000 outburst, implying a decline in the effective temperature of the hot component (see §3.1.1). Although we do not have high-resolution spectra from the 1997 outburst, the WHT spectra taken near optical maximum in late 2000 (December 2 and 3) show P-Cygni profiles for the He I lines, consistent with spectra acquired during previous major outbursts (e.g., Swings & Struve, 1970). At around the same time, FUV spectra also show such profiles (see §2.3). In Fig. 4, we show two example spectra — one from quiescence, and one near the peak of the 2000 outburst — both taken just after orbital phase zero. We list the equivalent widths of 12 lines in 826 spectra taken between 1994 September 13 and 2003 December 29 in Table 3, which is available electronically.

2.3. Far Ultraviolet
Nine observations of Z And (plus one short “safety snap”) were performed between 2000 November 16 and 2003 August 4 with the Far Ultraviolet Spectroscopic Explorer () satellite; see Table 4. The spectrographic instrument and on-orbit performance are described by Moos et al. (2000) and Sahnow et al. (2000). The spectral format consists of eight channels fed by four co-aligned prime-focus telescopes and Rowland-circle grating combinations, with a separate slit for each telescope. In four of the eight channels, LiF overcoated optics are used to cover the bandpass from to 1190 Å. The other four channels use SiC overcoated optics to cover the bandpass from the Lyman edge to Å. Each of the nine observations, consisting of anywhere from one to eight orbits, was taken through the low wavelength resolution slit (LWRS), which is 30 30 square arcseconds in angular area.
We reduced the data with CALFUSE pipeline versions 2.0.5 and higher, and combined the data for each orbit without considering shifts in the stellar position within the slits during the Earth-occultation period between orbital acquisitions. The individual spectral channels were linearized to a 0.01 Å scale. They were then joined into one spectrum by cross correlation of overlapping spectral sections.
For each of the wavelengths listed in Table 4, we calculated the continuum level from the unweighted mean of all data points at the specified wavelengths Å, from all the individual exposures at a particular epoch. We took as the uncertainty the larger of the formal statistical error in that mean and the scatter of the measurements from the individual exposures. In a few cases, where one or two of the individual exposures at a given epoch were discordant (centering in the aperture may have been poor for several orbits in those cases), we removed those exposures.

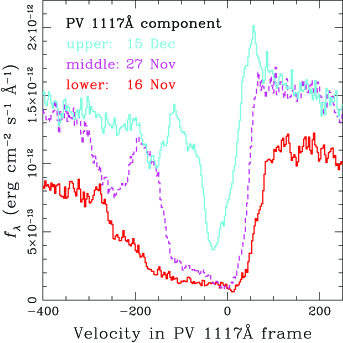
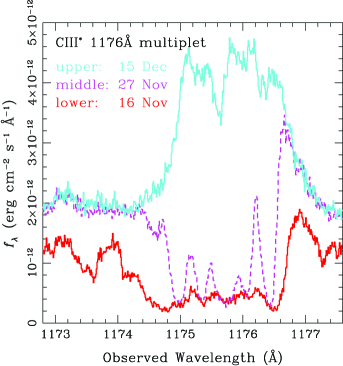
Fig. 5 shows the joined spectra (except for the safety snap). When the object may have shifted out of the slit, we adjusted the flux level to reflect the reduced integration time. The spectral continua are rather flat, and strong absorption by interstellar H2 spans the entire wavelength region (see McCandliss, 2003, for H2 absorption templates). During the main optical outburst, the FUV continuum rose and then fell, peaking at around the same time as the optical maximum. The continuum flux variations are also evident from the 959.5 Å, 1058.7 Å, and 1103.4 Å flux densities listed in the last three columns of Table 4. By the seventh observation (F7), on 2002 July 5, the FUV flux had returned to approximately the quiescent value recorded by and in 1993 and 1995, respectively ( and data were obtained from the Multimission Archive at STScI database, plus see Birriel et al., 1998; Schmid et al., 1999). During the subsequent brief optical rebrightening in 2002, the FUV flux dropped by almost an order of magnitude, and then rose back to the quiescent level again in the final observation on 2003 August 4.
In addition to absorption by some high-ionization species, the first observation shows a large amount of cool gas shrouding the FUV continuum. We see singly and doubly ionized C, Fe, and Si, as well as absorption by P V and the non-resonance 1176 Å transition in C III. Low-ionization species with P-Cygni profiles include N II, P II, C II, and Fe III. The presence of P-Cygni profiles in data is consistent with the optical P-Cygni profiles at around the same epoch. By the time of the second observation, the absorbing material begins to clear away. Moreover, whereas the first spectrum is almost entirely in absorption, the later spectra contain increasingly strong emission features. Toward the end of the series of FUV spectra, O VI becomes extremely strong as the continuum level falls.
Fig. 6 shows two examples of the early evolution of some line profiles. P V begins in absorption, with a blueshifted (P-Cygni-type) line width of approximately 300 km s-1. In the second observation, taken immediately before optical maximum, the width of the main blueshifted P V absorption decreases to less than 200 km s-1, and by the third observation, taken just after optical maximum, the P V absorption components have narrowed further and an emission component is present. During this same time, C III 1176 moves from absorption to emission.
The P V absorption-line ratio also demonstrates the trend of decreasing opacity evident in the line profiles from the first three spectra. For optically thin gas, the ratio of the 1117 to 1128 components of P V is 2:1, whereas for optically thick gas, the ratio is 1:1. In the first two observations, the ratio of the two P V line components is close to 1:1. By the third observation, however, the ratio is approximately 1.33:1, indicating that the opacity had begun to decrease. Furthermore, although the early P V line profiles suggest high optical depth, the troughs of the lines do not touch zero. Either the surface probed in the absorption line has significant emissivity relative to the underlying continuum, another continuum source is present, or the optically thick material only partially covers the continuum source111Nebular recombination radiation (predominantly from He II) is unlikely to be the possible secondary source of FUV emission since the unabsorbed flux expected from the nebula at FUV wavelengths is only a few times (Fernández-Castro et al., 1988, 1995). After extinction by the interstellar medium, the nebula contributes on the order of at these wavelengths, which is much less than the flux we see below the optically thick line profiles. . The early C III and Si III lines also appear to be optically thick, but do not reach zero.
2.4. Radio
Radio observations were performed with the NRAO Very Large Array (VLA) in New Mexico, and the Multi-Element Radio Linked Interferometer Network (MERLIN) in the U.K. Reduction was done with AIPS, and details of the reduction and analysis of the first 12 observations (R1-R12) are given in Brocksopp et al. (2004). For the final three observations (R13-R15; from the VLA), we observed in standard continuum mode, with two intermediate-frequency (IF) pairs of sidebands recording both right and left circular polarization, for a total bandwidth of 200 MHz at each frequency (100 MHz per polarization for two polarizations).
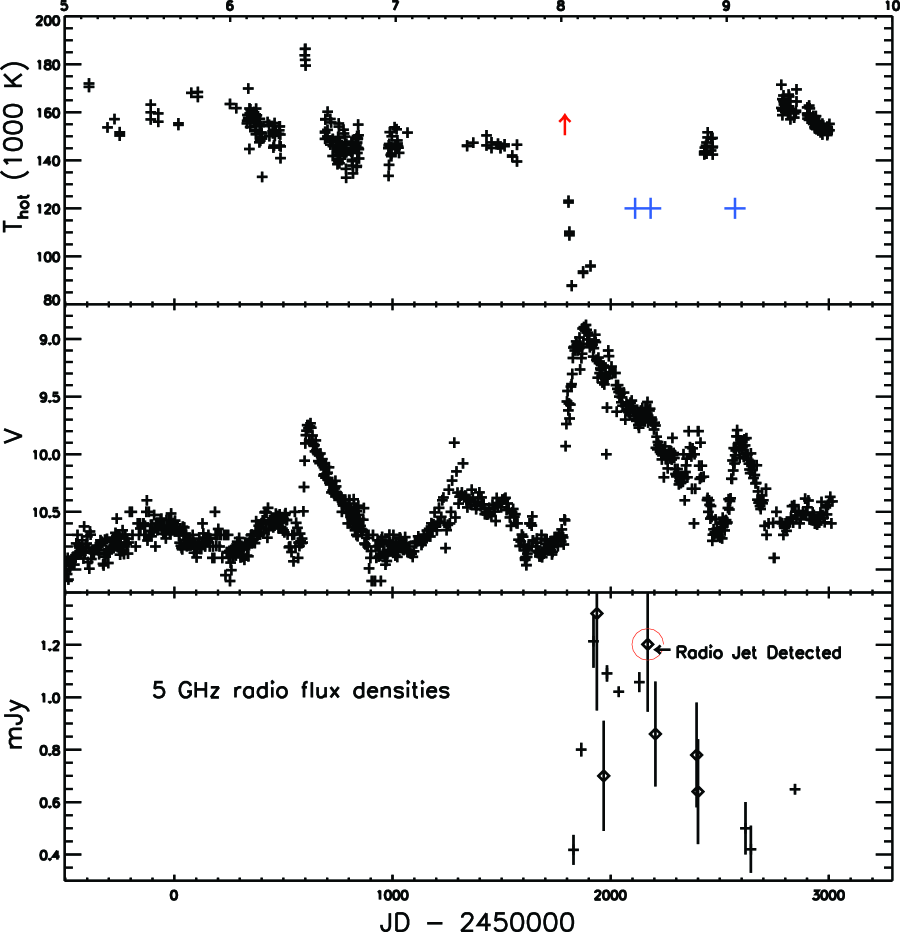
For phase calibration, we used a 110 s / 50 s cycle at 8.5 GHz and a 100 s / 50 s cycle at 5 GHz. The phase calibrator, 2322+509, is 2.8∘ away from Z And. Flux densities are defined with respect to 0542+498 (3C 147) and 0137+331 (3C 48), using the 1999.2 VLA flux-density scale. The flux densities for Z And represent the average of the two IF sideband pairs at each band, integrated over a small region surrounding the peak. We constructed images of the full primary beam at each frequency, using natural weighting for maximum sensitivity. These images were deconvolved with the CLEAN algorithm to remove the sidelobes of both Z And and (at 4.9 GHz) a nearby, extended confusing source. We list radio flux densities between 2000 and 2003 in Table 5. The 5 GHz flux densities are also plotted in the bottom panel of Fig. 9.
Early in the optical outburst, the 5 GHz flux density was very low compared to typical quiescent levels of about 1 mJy. Our first radio data were obtained approximately 40 days after the beginning of the optical rise, so the radio flux density could have dropped before the initial optical rise, simultaneous with the rise, or after the rise. As the optical outburst progressed, Z And brightened in the radio and, at 15 GHz, reached mJy, the highest 15 GHz flux density ever recorded for this source. The radio brightness peaked between two and five months after the optical brightness maximum (first at 5 GHz, then at 15 GHz, and finally at 1.4 GHz). During the optical rebrightening in late 2002, the radio brightness temporarily dropped below typical quiescent levels.
Roughly one year after the start of the optical outburst, and about eight and six months after the respective 5 GHz and 15 GHz brightness maxima, Brocksopp et al. (2004) discovered a radio jet from Z And. The extended radio component was just 60 mas in length, but was oriented in a direction consistent with the outflow being almost exactly perpendicular to the binary orbital plane (see Schmid & Schild, 1997). In 2001 September, the ejected component was brighter than the central component. However, the extended component was not detected in three subsequent MERLIN observations taken over the course of the next eight months. Z And was unresolved by the VLA (in C configuration) in 2002 December and 2003 January.
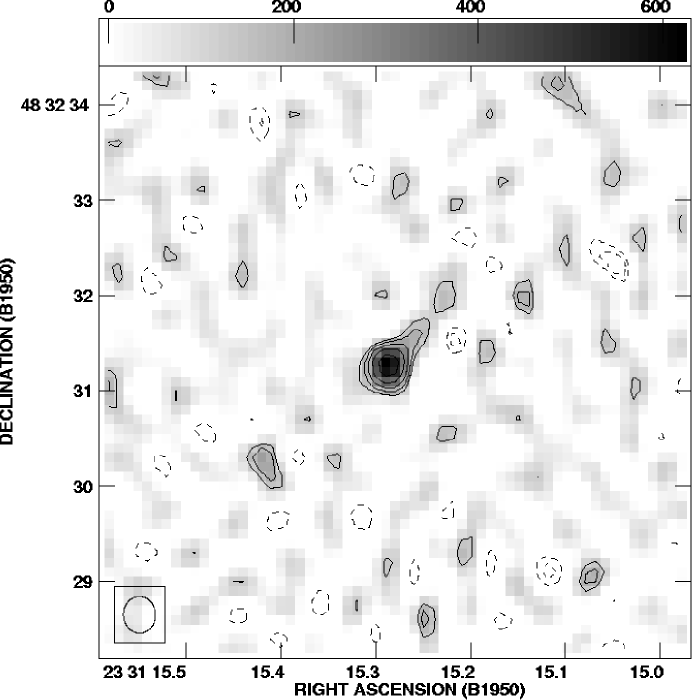
In 2003 July, our VLA observations (in A configuration) indicated that the radio jet was again detectable, and had reached 0.5 to in length. A Gaussian fit to the 5 GHz data suggests that the source was extended, with a nominal major-axis full-width at half maximum (FWHM) of and a minor axis less than 0.15″, at an orientation of east of north. For comparison, the beam is a Gaussian with FWHM oriented 1.6∘ degrees east of north. In the map, the source shows an elongation to the NW (see Fig. 7), and we obtained similar results with different -weighting schemes. The peak flux density of the extended component in the 5 GHz VLA image is about 0.18 mJy beam-1. There is no sign of extended emission in the 15 GHz image. The 2003 July VLA extension is about 20∘ west of the direction of the 2001 September MERLIN jet, but in a similar direction as a blob in a 1991–1992 VLA+MERLIN map shown by Kenny (1995).
If we take the size of the VLA extended region at face value and assume that the material was ejected at the start of the optical outburst, the outflow has a velocity of around 800 to 1000 km s-1. The inferred velocity of the small (60 mas) jet found with MERLIN was 400 km s-1. However, the two velocity estimates have sufficiently large uncertainties that they are roughly consistent.
2.5. Fast Optical Photometry
On 2000 November 23, we performed fast optical photometry using the 1-m Nickel telescope at UCO/Lick Observatory. The goal of these observations was to determine whether the 28-minute oscillation due to accretion onto the spinning, magnetic WD was detectable during the 2000–2002 outburst, as it was during the event in 1997 (Sokoloski & Bildsten, 1999). We took repeated 15-s exposures using a filter and an unthinned, phosphor-coated, 2048 2048 pixel Loral CCD. A typical dead-time (with 44 binning and fast readout) of 23 s gave a time resolution of 38 s. The full time series spanned 5.6 hours. A description of our differential photometry for this field and the data reduction and analysis methods can be found in Sokoloski & Bildsten (1999) and Sokoloski et al. (2001), respectively.
The 28-minute oscillation was not detected. After removal of some hour-time-scale variability with low-order polynomial fitting, we found an upper limit on the amplitude of any 28-minute signal in the data of 3 mmag (see Sokoloski et al., 2001, for a description of how we obtain upper limits using Monte Carlo simulations). The conservative upper limit of 3 mmag was obtained without use of the brightest comparison star, GSC 03645-01592, since this star is an intrinsically variable -Scuti star (Sokoloski et al., 2002). If GSC 03645-01592 is used, and its intrinsic variability removed with a high-order polynomial, the upper limit for the 28-minute oscillation becomes 1.8 mmag.
This non-detection indicates that the evolution of the 28-minute oscillation during the large 2000–2002 outburst was fundamentally different from its evolution during the smaller 1997 outburst. In 1997, the oscillation amplitude changed roughly in step with the hot-component optical flux, reaching almost 6 mmag when the optical flux was 0.9 mag above the pre-outburst level. In 2000, despite the fact that Z And had brightened by 1.8 mag compared to quiescence, the oscillation was not detected.
2.6. X-Ray
We obtained three X-ray observations of Z And during the first year of the 2000–2002 outburst. The first observation (X1) was performed with the X-Ray Observatory (Weisskopf et al., 2002) on 2000 November 13, just over two months into the optical outburst, at the beginning of the third stage of the optical rise. The subsequent two X-ray observations (X2 and X3) were performed with the XMM-Newton Observatory (Aschenbach, 2002), on 2001 January 28 (50 d after the optical outburst peak) and 2001 June 11 (6 months after the optical peak), respectively. See Table 6 for a summary of all three X-ray observations.
Observation X1 was performed with the Chandra High Energy Transmission Grating Spectrometer (HETGS). The data were processed using updated calibration files (CALDB 2.27), and reduced with the software package CIAO v3.1. In 19 ksec, the source was detected with 109 source counts in the zeroth-order spectrum. Due to the low number of counts, we used only the zeroth-order data for our analysis. To reduce the instrumental background, we only selected photons with energies between 0.3 and 7 keV. Based on examination of source-free regions in the S1 chip, no periods of high background occurred during the observation.
We performed spectral analysis for all X-ray data using the software packages Sherpa (within CIAO) and XSPEC v11.3. For observation X1, we extracted the source spectrum from a -radius circular region centered on the source, and used an annular region also centered on the source for the background. We rebinned the spectrum to have at least 10 counts per spectral bin. In the energy range over which the source was detected, the background contributed less than 0.1%.
Observations X2 and X3 were performed with the XMM-Newton European Photon Imaging Cameras (EPIC), in full-frame mode, using the medium neutral-density filter. After rejecting data with high background levels, we retained good-time intervals of 16 ksec and 4 ksec (out of 20 ksec and 15 ksec) for observations X2 and X3, respectively.


We reduced and analyzed the XMM-Newton data with the software package SAS v5.4.1, using only data in the 0.2–10 keV range. We extracted the EPIC-pn source spectra from a -radius circle centered on the source, and the background from a source-free region. Z And was detected in the EPIC-pn with over 1500 source counts during observation X2, but was significantly fainter (about 140 EPIC-pn source counts) during observation X3. In addition, the background level was significantly higher during observation X3 (approximately 0.7 counts s-1, probably due to solar activity, compared to counts s-1 in observation X2). To improve the statistics, we rebinned the spectra from X2 and X3 to have 20 and 10 counts per spectral bin, respectively.
The X-ray emission detected in observation X1 fell primarily between 0.3 and 2 keV. With only 100 source counts and a large uncertainty in the amount of intrinsic absorption, we are unable to use the spectrum from X1 to strongly constrain physical models. Nevertheless, we fit the spectrum with several different models as a means of parametrizing its softness and investigating the absorption. We could not obtain an acceptable fit for a single-component Raymond-Smith (RS) plasma model. For a powerlaw model, the best fit is statistically acceptable, but gives an unphysically large photon index of (where the photon flux is given by , with being energy and a normalization constant). The absorbing column density in the powerlaw model is cm-2, which is significantly higher than the Galactic value of cm-2 (Dickey & Lockman, 1990), but lower than values of cm-2 sometimes found for symbiotic stars near orbital phase zero (where X-ray emission from the accreting white dwarf must pass through the maximum amount of the red-giant wind; Vogel, 1991). As discussed in §3.1.2, we adopt mag for Z And. Based on the relationship between and shown in Fig. 1.1 of Spitzer (1978), mag is consistent with the Galactic column density given by Dickey & Lockman (1990).
A blackbody model yields a good fit if we include an absorption edge at keV; the significance level of the additional absorption edge is greater than 95%. The resultant blackbody temperature is 0.21 keV, or K, and in this model is consistent with the Galactic value. The absorbed flux in the energy bands 0.3–7 keV and 2–20 keV is erg cm-2 s-1 and erg cm-2 s-1, respectively. The spectrum from observation X1, with the blackbody-plus-absorption-edge model, is shown in the left-hand panel of Fig. 8. We list the best-fitting spectral parameters in Table 7.
For observation X2, there is no single-component spectral model which can provide an acceptable fit to the data, in part because low-level emission was detected all the way out to 10 keV. As with observation X1, a single-component RS plasma model does not generate a good fit. Instead, to obtain a reasonable , a blackbody component with keV ( K), a powerlaw component with , and two absorption edges (at 0.64 and 0.96 keV) are required. The optical depth of both edges is 1. An additional edge at 0.29 keV is probably due to the calibration error near the carbon edge at 0.3 keV. The derived in this model is consistent with the Galactic value. The powerlaw component comprises about 6% of the total unabsorbed flux. The absorbed flux in 0.3–7 keV and 2–20 keV is erg cm-2 s-1 and erg cm-2 s-1, respectively. The spectrum from observation X2 and best-fitting spectral model are shown in the right panel of Fig. 8. The spectral-fit parameters are listed in Table 7.
Z And was significantly fainter during observation X3. With the low source count rate and high background level during this observation, it is clear that the spectrum was soft, but it is otherwise not tightly constrained. The spectrum is best described by an absorbed blackbody model with keV ( K), and A powerlaw with an unphysically high photon index of produced a similar-quality fit, as did a RS plasma model fit, which gave keV ( K) and an absorbing column close to (). The absorbed fluxes in 0.3–7 keV and 2–20 keV are erg cm-2 s-1 and erg cm-2 s-1, respectively.
In all three X-ray observations, we find formally acceptable fits to blackbody models with temperatures of a few times K. However, these temperatures are too high for the X-ray emission to be blackbody emission from either the WD surface or accretion disk. A WD with a radius of cm and blackbody temperature K would have a luminosity of — two orders of magnitude greater than the Eddington limit for a WD. Moreover, our optical and FUV data indicate that the effective temperature of the WD in Z And typically does not rise above 180,000 K (see §3.1). Given that we have very poor statistics for two of the three X-ray observations, that symbiotics generally have rich line spectra at other wavelengths, and that there are multiple potential sites of X-ray emission and absorption in Z And, we suspect that a more complex X-ray spectrum, possibly containing overlapping emission lines from a plasma and absorption features from the ionized nebula, is mimicking a blackbody in our CCD-resolution spectra.
In both the FUV (see §2.3) and radio (see §2.4) data, we find evidence that a significant amount of material was ejected from the WD into the dense symbiotic nebula. Thus, an alternative possible source of X-ray emission from Z And during outburst is shock-heated plasma. Taking a distance of 1.2 kpc, the unabsorbed X-ray fluxes from Table 7 give 0.3-7.0-keV X-ray luminosities of almost erg s-1 for observation X1, dropping to a few times erg s-1 by observation X3. These X-ray luminosities are more than five orders of magnitude less than the total bolometric luminosity of the WD near the peak of the outburst (see §3.1.2). Thus, most of the outburst energy is emitted at slightly lower than X-ray energies, as expected given the WD effective temperature of K. The total 0.3-7-keV X-ray energy radiated in four months (the approximate time for which the X-ray emission was high compared to quiescence) is about erg — less than the kinetic energy of of material moving at 300 km s-1 (the approximate velocity of the outflowing material; see § 2.3 and § 2.4). Since at least was probably accreted in 2000 (see §4), the availability of this much kinetic energy for conversion to X-ray emission is plausible. In addition, the temperature behind a strong shock moving at 400 km s-1 is roughly K ( K if the shock velocity is 300 km s-1), and plasma at this temperature will produce soft X-ray emission. Moreover, if we take a cooling time of a few months and a plasma temperature of K, we infer a post-shock density on the order of cm-3. This estimate gives a pre-shock density of a few times , which is reasonable for the outer nebula in Z And (assuming that the density decreases from the inner-nebula value of , from Fernández-Castro et al., 1988, as the inverse of the distance squared).
The presence of absorption edges provides additional evidence for significant amounts of hot, possibly shock-heated gas. In observation X1, we found a 1.02 keV edge that is close to the energies of either the Fe VII L1 edge at 1.03 keV or the Ne VI K edge at 1.04 keV. Ebisawa et al. (2001) saw the same edge in observations of the supersoft X-ray source RX J0925.7–4758, and they ascribed it to a high column of ionized material between the WD and the observer. We also detected a 0.96 keV edge in the observation-X2 spectrum, possibly related to the same feature. The 0.64 keV edge seen in the observation-X2 spectrum is close to the Lyman edge of N VII at 0.67 keV. A similar feature was found in the X-ray spectrum of the recurrent nova U Sco (Kahabka et al., 1999). Since it is hard to imagine that the hot-component effective temperature could get high enough to produce N VII via photoionization in Z And, the presence of the 0.64 keV edge could be evidence for shock heating. The hard tail in observation X2 provides additional evidence for shock-heated gas at this time.
Comparing our X-ray fluxes to those from a 1993 quiescent-state PSPC observation (Mürset et al., 1997), the X-ray flux of Z And increased by about an order of magnitude during the 2000–2002 outburst. The PSPC count rate in the energy band (0.12–2.4 keV) in 1993 was counts s-1, equal to approximately (for reasonable blackbody spectral models). In observations X1 and X2, the 0.3–2.0 keV flux was at least or a few times . By the time of observation X3, six months into the optical decline, the X-ray flux had decreased to a level similar to that measured by during quiescence.
We also examined two public Rossi X-ray Timing Explorer PCA (Jahoda et al., 1996) observations of Z And — one during the decline of the small optical outburst in 1997 (45 ksec; 1997 November 28), and another a year later after the system had returned to quiescence (12 ksec and 37 ksec on 1998 November 17 and 18). In the first observation, Z And was detected with a rate of 2 counts s-1. Using the software PIMMS and assuming a powerlaw spectral model, this count rate gives a 2–20 keV flux of a few times , two to three orders of magnitude higher than the 2–20 keV fluxes estimated for the 2000–2002 outburst. Z And was not detected during the second, quiescent-state observation. Thus, unlike in the supersoft X-ray sources, some observations of which show an inverse relationship between the optical and X-ray brightness (Southwell et al., 1996), in Z And the X-ray flux rose during both the 1997 and 2000–2002 optical outbursts.
3. Analysis and Conclusions
To investigate the changes in the hot component from 1994 to 2003, and to diagnose the nature of the two outbursts during this time period, we use the data described above to estimate the effective temperature and luminosity of the WD-plus-disk as a function of time. In addition, optical and FUV line profiles provide information about material ejected during the 2000–2002 outburst.
3.1. Hot-Component Effective-Temperature and Luminosity Evolution
3.1.1 Effective Temperature
We estimated the effective temperature of the hot component between 1994 and 2003 using both the ratio of nebular emission lines (Iijima, 1981) and the presence of different ionization states in the optical and FUV spectra (Mürset & Nussbaumer, 1994). Assuming a radiation-bounded nebula (all photons capable of ionizing H and He ionize these atoms), Iijima (1981) showed that the effective temperature of a central source of ionizing photons is
| (1) |
where , , and are the nebular emission-line fluxes of He II 4686, H, and He I 4471, respectively. This expression is valid for effective temperatures between 70,000 K and 200,000 K. In our treatment, we neglected the 4471 flux, because F4471 0.1 FHβ. To minimize calibration errors, we used the ratio of equivalent widths, EW4686/EWHβ, instead of the flux ratio. Because the continuum is nearly flat at 4650–4900, this approximation is justified. Errors in the equivalent widths are 5%–10%; thus, the statistical error in the effective temperature is 10%–15%. To correct for the fact that near orbital phase zero the H-emitting region is partially occulted by the red giant, and thus the H equivalent widths (EWHβ) do not reflect the true H flux from the nebula at these times, we multiplied by a sinusoidal factor, , where is the orbital phase. This expression was empirically derived to force the quiescent orbital-phase-zero values of on average to equal the quiescent orbital-phase-0.5 values.
We also estimated based on the presence of different ionization states in the optical and FUV spectra. Mürset & Nussbaumer (1994) derive a relation between (in degrees K) and , the ionization potential (in units of eV) of the highest-ionization species visible in the spectrum:
| (2) |
They used photoionization models to estimate an accuracy of 10% for this expression. The ionization-state-based estimate of for Z And generally agreed with the line-ratio-based estimate described in the previous paragraph. However, the two methods gave slightly different results at the time of maximum WD luminosity during the 2000–2002 outburst, when the assumption of a radiation-bounded nebula might have been violated (the rather low X-ray absorpting column and the higher-than-average radio flux are both consistent with the nebula being more ionized around the time of peak luminosity), and near orbital phase zero in 2002, when the H-emitting region was partially occulted (as described above). Because of these problems with the line-ratio-based estimates, and because the combination of optical and spectra provides a good sampling of ionization states that bracket the temperatures of interest, the ionization-state-based results were given precedence on these occasions.
For our spectra, the persistence of He II 4686 ( eV) indicates 55,000 K throughout 1994–2003. Both Raman-scattered O VI at 6830 ( eV) and the [Fe VII] 6087 ( eV) lines are also generally visible when Z And is inactive, suggesting K in quiescence. During the 1997 outburst, Raman 6830 strengthened considerably, confirming the increase in to 180,000 K suggested by . During the rise to optical maximum in 2000, [Fe VII] 6087 and Raman 6830 weakened and then disappeared, and in FUSE spectra, O VI 1032,1038 was absent, all supporting the decline in to 80,000–90,000 K. These lines reappeared during the optical decline, confirming the rise in effective temperature determined from . In spectra F4 – F6, taken midway through the optical decline in 2001, O VI 1032,1038 are strong, but Ne VI 1006,1010 ( eV) are weak or absent. For this time period, we adopt K, slightly below our estimates. In spectra F7 and F9, in 2002 July and 2003 August, Ne VI 1006,1010 are present, confirming the increase in back to the pre-outburst value, in accord with the simultaneous return to the optical quiescent state. During the brief optical rebrightening in late 2002, the fading of Ne VI 1006,1010 on spectrum F8 indicates that temporarily decreased, and we again adopt a value of K for this time period. Overall, our line-ratio-method and ionization-state-based estimates of appear to be consistent to within 10-20%. The hot-component effective temperature, , is plotted as a function of time in the top panel of Fig. 9.
We found that K during quiescence. Our value of the quiescent WD effective temperature is somewhat higher than the quiescent-state Zanstra temperature of 120,000 K (on average) found by Mürset et al. (1991) between 1979 and 1987, and of roughly K found by Fernández-Castro et al. (1988) between 1978 and 1982. However, the effective temperatures from Mürset et al. (1991) increase during 1979–1981 (108,000 K on average) and 1984–1987 (126,000 K on average), and Birriel et al. (1998) find K from a FUV observation in 1995 March. Our higher values could thus reflect long-term changes of a similar magnitude in . Tomov et al. (2003) find K, as we do, in 1999 September.
In summary, the effective-temperature history of the WD is markedly different for the 1997 and 2000–2002 outbursts. During the 1997 outburst, increased by about 20%, to more than 180,000 K. It returned to the quiescent-state value by midway through the optical decline. showed a more complex evolution during the 2000–2002 event. Photometry from Skopal (2003) indicates that very early in the 2000–2002 event (within the first few days), the -band flux jumped by 2 mag and the color decreased (i.e., became bluer; see Skopal, 2003, for more complete coverage of this blue spike), suggesting that initially increased. Within two weeks of the start of the outburst, however, as the optical flux continued its rise to maximum, the evolution changed direction. Over the next two months, decreased to 90,000 K. By the time of optical maximum, was beginning its recovery. It returned to the quiescent-state value before the completion of the optical outburst. Finally, again dropped briefly during the small optical rebrightening in late 2002. The dominant behavior of dropping as the optical flux rises to maximum, as in the 2000–2002 event, is typical of historical outbursts.
3.1.2 Luminosity
To determine the bolometric luminosity of the WD throughout the 2000–2002 outburst, we estimated the WD radius at the time of each observation by scaling the WD photosphere models of Barman et al. (2000) to the extinction-corrected fluxes, using the effective temperatures described above, a distance of 1.2 kpc, and a mass of 0.65 (Schmid & Schild, 1997). Values of in the literature include 0.3 mag (Altamore et al., 1981), 0.27–0.29 mag (Kenyon & Webbink, 1984), 0.3 mag (Mikołajewska & Kenyon, 1996), and 0.35 mag (Viotti et al., 1982). We take mag, the lowest of these values. This choice is the most conservative for our purposes, as larger values will produce even greater WD bolometric luminosities. Furthermore, this low value of produces a dereddened flux ratio () that is more consistent with the theoretical expectation, and also more consistent with the interstellar reddening from dust emission maps (Schlegel et al., 1998; Burstein & Heiles, 1982). With the WD photospheric radii and effective temperatures determined previously, we were then able to obtain the luminosities using the standard relation . The fluxes provide a good approximation to the flux directly from the WD because the contribution from both the red giant and the nebula are negligible in the FUV (for a complete spectral energy distribution and model, see Fernández-Castro et al., 1988).
The derived hot-component luminosities, which we list in Table 8, are close to from the end of 2000 to late 2001. Although these results are quite sensitive to the reddening used to correct the FUV fluxes for extinction, our choice for on the low end of the range of published estimates means that the true luminosities could have been even higher. In addition, we find reasonable agreement between our estimate of – in quiescence ( observations F7 and F10) and the quiescent-state estimates of approximately 620– found by Mürset et al. (1991), who used a modified Zanstra method, which is much less sensitive to reddening. For comparison with our outburst luminosities, the Eddington luminosity for a white dwarf is
3.2. Disk Instability in 1997
We interpret the 1997 outburst in terms of a disk instability that produces a sudden increase in the accretion rate through the disk surrounding the white dwarf. Considerable evidence supports this interpretation: 1) the amplitude and shape of the optical light curve; 2) the behavior of the short-period photometric oscillation due to magnetic accretion onto a rotating white dwarf; and 3) the evolution of in 1997.
Given the small size and short duration of the 1997 outburst, it was unlikely to have been caused by a recurrent-nova-like thermonuclear runaway or a weak shell flash. Thus, the main alternative to the disk-instability interpretation is an expansion of the white-dwarf photosphere at roughly constant bolometric luminosity (Tutukov & Yungelson, 1976). In symbiotic stars, Kenyon & Webbink (1984) showed how the spectroscopic evolution of this alternative differs from the evolution expected from a disk instability. Here, we consider each of the pieces of evidence listed above and use this information to reject the expanding-photosphere picture in favor of a disk instability.
The triangular shape of the light curve during the 1997 outburst resembles the outbursts of many dwarf novae (see, e.g., Warner, 1995). The rapid rise time of 20 days is similar to the typical rise times of 2–10 days for dwarf novae, especially given that longer dwarf-nova rise times are typically seen in CVs with longer orbital periods (and therefore larger disks; Warner, 1995). The slower, nearly linear decline is also reminiscent of dwarf novae, where a cooling wave propagates inward through the disk at the local sound speed. In dwarf novae, the cooling wave takes, for example, 7 – 10 days to travel roughly 0.7 R⊙. The longer 300 day decline in Z And is reasonable for a disk with an outer radius of 20 – 40 R⊙, or roughly 3 – 7% of the binary separation (10 – 20% of the hot-component Roche-lobe radius if we take and a red-giant mass of ). Moreover, the faster rise than decline is suggestive of an outburst in which the heating wave is initiated at large radii and moves inward through the disk (Cannizzo, Wheeler, & Polidan, 1986). Besides the shape, the amplitude of the 1997 outburst is close to the 1 mag maximum amplitude expected for a disk instability in a symbiotic star (the amplitude is low because of the additional light from the red giant and nebula; Kenyon, 1986; Duschl, 1986b).
During the small 1997 outburst, Sokoloski & Bildsten (1999) detected a 28-min photometric oscillation when the system was near optical maximum and then throughout the decline back to optical quiescence. They interpreted this oscillation as a hot-spot on the surface of a white dwarf with a rotational period of 28 min. The properties of the light curve are consistent with a hot spot produced by accretion channeled from the disk to the white dwarf by a magnetic field with a surface strength of at least G (or G if the WD is in spin equilibrium). The behavior of the oscillation throughout the outburst provides a clear discriminant between a disk instability and an expanding photosphere. In the expanding-photosphere model, the optical emission from accretion remains constant while optical emission from the WD photosphere increases. Therefore, the ratio of optical flux from accretion to that from the WD photosphere drops by at least the same factor as the overall increase in optical brightness. Thus, the expanding-photosphere model predicts that the pulse fraction of the oscillation will decrease during an outburst. In contrast, because the luminosity of an accretion hot-spot is likely to track the overall accretion luminosity, the pulse fraction of the oscillation should remain roughly constant during a disk instability.
Our data clearly favor a disk instability as the source of the 1997 outburst. The pulse fraction of 0.6% near the peak of the outburst is comparable to the pulse fraction of 0.7% during quiescence (after subtracting out the approximate contribution of the red giant to the -band flux, which we take to be 75% in quiescence; see Fernández-Castro et al., 1988). In contrast, we would expect at least a factor of three reduction in the pulse fraction for a 1 mag rise in brightness due to an expanding photosphere. The data clearly rule out such a large change in the pulse fraction.
The derived change in also favors a disk instability over an expanding photosphere. In the Rayleigh-Jeans tail of the WD blackbody distribution, the optical intensity is proportional to . The optical flux is therefore proportional to . If the bolometric luminosity is constant, as is the case in the expanding-photosphere model, then , and the optical flux is proportional to . For a 1 mag optical eruption, the expanding-photosphere model thus predicts a factor 1.3 decline in (see also Bath & Shaviv, 1976). Our analysis of the optical emission lines indicates a factor of 1.2 increase in (Fig. 9). The disk-instability model is clearly more consistent with the data.
3.3. Disk Instability Plus Enhanced Shell Burning in 2000–2002
The hot-component effective-temperature evolution was quite different during in the 2000–2002 outburst. These two eruptions were therefore examples of distinct types of events. Unlike the 1997 event, the properties of the 2000–2002 outburst are not consistent with a simple disk-instability model. Evidence against the simple disk-instability model for this eruption includes the following: 1) the rise to optical maximum proceeded in three distinct stages; 2) the optical brightness increased by well beyond the 1 mag that can be produced by a disk instability in a symbiotic (Kenyon, 1986); 3) evolved in a rather complex way; 4) the optical oscillation at the WD spin period due to magnetic accretion was absent near the peak of the outburst; and 5) the amount of material needed to power this event by accretion alone is much higher than could reasonably have been accreted during the outburst.
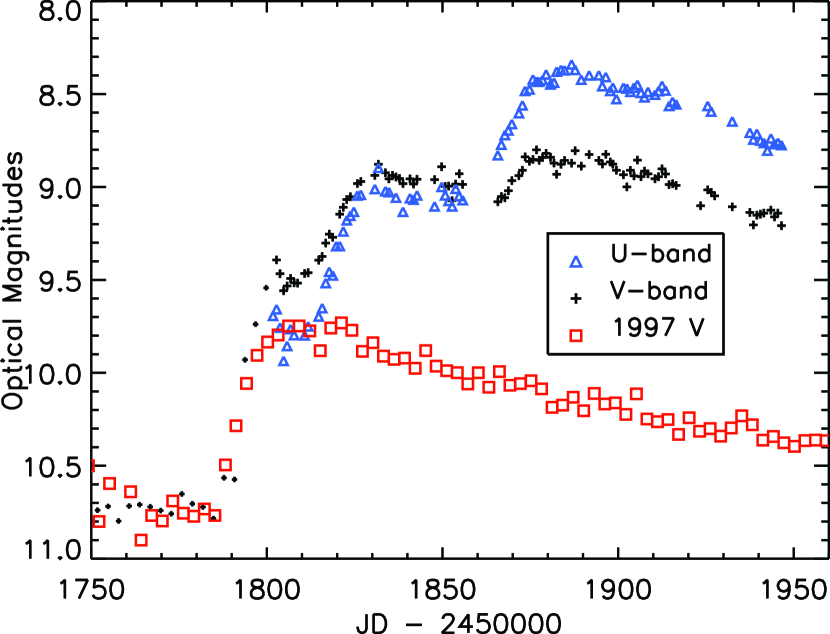
The start of the 2000 eruption closely resembled the evolution of the 1997 outburst. Fig. 10, in which the 1997 and 2000 light curves are overlaid, shows the similarity between the first stage of the 2000–2002 event and the rise to maximum in 1997. Very early in the 2000–2002 event, appears to have increased, as it did in 1997 (see §3.1.1). We do not have the spectral data needed to determine during the first week or so of the 2000–2002 outburst, or the fast photometry to show that the pulse fraction of the oscillation remained constant during the early rise in 2000. However, the color evolution during the first week of the outburst (Skopal, 2003) strongly suggests that increased during the early rise. Furthermore, since the brightness tends to be dominated by reprocessed ionizing radiation from the hot component, the early jump in -band flux (Skopal, 2003) indicates that the 2000–2002 outburst was initiated by a process that caused the luminosity of the hot component to increase rapidly. We therefore conclude that the 2000–2002 outburst began with a disk instability, as in 1997.
If the 2000–2002 outburst was entirely accretion powered, the required accretion rate to produce such a high luminosity would be
| (3) | |||||
where is the bolometric luminosity, is the WD radius, is the WD mass, and as indicated by Mürset et al. (1991) and our scaling of the FUV fluxes to photospheric models (see Table 8). It is difficult to imagine how such a high accretion rate could be sustained in Z And for a full year.
If the outburst was nuclear powered, on the other hand, the burning of only a few times of fuel can produce for one year. Moreover, since was higher by an order of magnitude in outburst compared to quiescence, and we argued in § 1.1 that the quiescent hot-component luminosity already indicates the presence of nuclear shell burning, it follows that the rate of nuclear burning must have increased during outburst. Kilpio et al. (2005) also suggest that this outburst involved enhanced nuclear burning (but as a result of the collapse of the disk when the wind speed dropped below a critical level). If we include the kinetic energy of ejected mass in the total energy produced by the outburst (Brocksopp et al., 2004; Tomov et al., 2003), thermonuclear involvement is even more strongly indicated.
3.4. Shell Ejection and Dissipation
Our observations suggest that during the second stage of the 2000–2002 outburst, a shell of material (or possibly an optically thick wind) was blown from the surface of the WD. During the third stage, this ejected shell became optically thin. During the second stage, dropped (see Fig. 9) and the color reddened, first sharply, and then more gently (see Fig. 2). The spectrum taken near the end of the second stage was dominated by blueshifted absorption from optically thick gas flowing outward (see §2.3). Instead of the high-ionization-state emission lines typically associated with symbiotic-star nebulae, this first observation shows a large amount of cool gas (e.g., singly and doubly ionized species of C, Fe, and Si). The hot WD surface thus appears to have been hidden by an optically thick shell of material. During the third stage of the rise to optical maximum, slowly began to increase again and the color became more blue, the final increase in optical flux became dominated by -band light, the FUV spectra began to move from absorption to emission, and the radio flux rose. After the third stage, the X-ray spectrum showed evidence for the presence of significant quantities of shock-heated gas.
The uncharacteristically low radio flux density measured during the second stage of the outburst (see §2.4) is consistent with the ejection of an optically thick shell from the WD. The radio flux is primarily due to bremsstrahlung emission from the nebula. A low value indicates that the size of the emitting region is unusually small, in this case presumably because the flux of ionizing photons decreased when the shell first expanded and dropped. At the time of the first radio observation (R1), we estimate . We thus expect the flux of ionizing photons from the hot-component surface to drop more than 80% from the pre-outburst value to , where is the flux of ionizing photons from the hot-component photosphere at the time of R1, and is the flux of ionizing photons in quiescence, when K.
Given a typical quiescent 5 GHz radio flux density at the orbital phase corresponding to R1 of mJy (Kenny, 1995), and a measured 5 GHz radio flux density of mJy, we can infer the approximate radius of the hot-component photosphere or ejected shell:
| (4) | |||||
where we have taken the quiescent-state hot-component radius to be (see Mürset et al., 1991). We have assumed that changes in the size of the ionized portion of the nebula occur in the outer regions that are closer to optically thin than optically thick. Thus, the change in radio flux density is approximately equal to the change in total flux of ionizing photons. Since the geometry and ionization structure of the nebula are poorly known, the resulting uncertainty in our estimates from the radio data is probably even larger than the quoted errors. We expect the change in flux of ionizing photons to impact the radio emission almost immediately, since the recombination time in a nebula with electron density on the order of – is minutes to hours (Fernández-Castro et al., 1995).
A similar analysis of the radio flux at the time of our second radio observation (R2) gives at JD 2451865, roughly consistent with derived from a observation taken at the same time (see §3.3 below). From analysis of additional observations taken between the second and third radio observations, we find that reached a maximum size of greater than . The third radio observation indicates that the hot-component photosphere had contracted, to , by JD 2451921. Thus, the expansion and dissipation of the photosphere or optically thick shell is evident in the radio as well as FUV data.
Our first radio data point was obtained during the optical plateau after the second optical rise, over one month into the outburst. Therefore, the only information about the evolution of very early in the outburst is that indirectly inferred from the decline in between optical spectroscopic observations O1 and O3. A radio light curve (plus simultaneous optical spectroscopic monitoring) starting earlier in a classical symbiotic-star outburst would provide more complete information about the evolution of during the beginning of the shell-ejection phase of this type of event. Since the FUV fluxes can provide an independent measure of , a simultaneous FUV light curve early in an outburst would provide a test of the shell-ejection hypothesis.
The non-detection of the magnetic hot spots on the surface of the WD at the beginning of the third stage of the outburst is also consistent with the ejection of an optically thick shell from the WD. Because the WD in Z And is magnetic, the accretion flow close to the WD is channeled along magnetic field lines. Hot spots at the base of these columns produce an optical oscillation at the WD spin period (Sokoloski & Bildsten, 1999). However, on JD 2451872 (just before the optical maximum), the oscillation amplitude upper limit was well below the amplitude measured during the 1997 outburst, suggesting that the white-dwarf surface was either hidden or the magnetic accretion flow disrupted during the second stage of the rise to optical maximum in late 2000.
Our X-ray observations are also consistent with the shell-ejection hypothesis. The hard (2 keV) tail seen in the second X-ray observation (X2) could be the result of shock-heated gas, which in symbiotic stars has been suggested to be due to colliding winds (e.g., Mürset et al., 1997). A new burst of material blown from the WD would tend to enhance such emission. Furthermore, as discussed in §2.6, at least one of the absorption edges we detected can be ascribed to an ionization state of N that is most likely produced in shock-heated gas. The difference between the 1997 and 2000 peak X-ray fluxes provides additional support for shell ejection during the 2000–2002 event. In 1997, no shell was ejected, and so the accreting WD was clearly visible. Accordingly, the X-ray flux reached a significantly higher value in 1997 compared to 2000, when much of the X-ray flux from accretion was probably hidden.
The physical changes that comprise the third stage of the rise are, however, reflected most clearly in the FUV spectra. During this period, the FUV emission begins to leak through the ejected shell, producing the high FUV fluxes seen in 2000 November and December and the -dominated final optical rise (via nebular reprocessing of FUV emission into the optical). The evolution of the FUV spectrum from an optically thick, absorption-line spectrum with blueshifted P-Cygni absorption to optically thin emission-line spectra provides the most direct evidence for shell ejection and dissipation. Moreover, the evolution of the blueshifted P-Cygni absorption reveals that the average velocity of the absorbing material along the line of sight decreased with time. Finally, the maximum velocities from the first observation are comparable to the 400 km s-1 inferred for the speed of the radio jet that was produced in conjunction with the 2000–2002 outburst (Brocksopp et al., 2004).
3.5. Optical Rebrightening in 2002
In mid-2002, the decline to optical quiescence was interrupted by a 1 mag rebrightening that lasted for about five months. The color during this rebrightening was initially quite red (comparable to the second stage of the outburst; see bottom panel of Fig. 2). As the rebrightening event faded, the color became slightly more blue, although never as blue as during the entire previous year-long optical decline. Both the and VLA fluxes were unusually low during the optical rebrightening.
Our data indicate that the optical rise in 2002 could have resulted from a decrease in due to a slight expansion of the white-dwarf photosphere. Skopal (2003) proposes that the rebrightening was due to the emergence of the hot component from eclipse. The unusually low values of the FUV and radio fluxes near the maximum of the optical rebrightening, and the orbital inclination of from polarimetry (Schmid & Schild, 1997), both present problems for the eclipse interpretation. Moreover, the fact that the optical flux is higher after the dip in the light curve despite the system being at an orbital phase where it is normally low, and that the minimum of the possible eclipse occurs before orbital phase zero (see Fig. 9), also tend to favor a non-eclipse explanation.
Webbink (1976) suggested that a similar rebrightening in T CrB was due to the emptying of the accretion disk after a pulse of material ejected from the red giant formed a ring and then disk around the accreting star. For Z And, however, the disappearance of the Ne VI lines in spectrum F8, the reddening of the color, and the decrease in the radio flux density all indicate that decreased (from around 150,000 K to approximately 120,000 K) when the optical flux increased. To produce this decrease in , we infer that the WD radius probably expanded slightly, despite the fact that our FUV data do not allow a reliable estimate of at this time (the FUV flux ratio indicates that our FUV continuum fluxes in observations F7–F9 must have been contaminated by emission and/or absorption, so a WD photosphere model could not be fit to derive WD radii). Tomov, Tomova, & Taranova (2004) report a similar conclusion regarding the optical activity in 2002.
4. Discussion
In the 2000–2002 eruption of Z And, we see evidence for phenomena that usually occur in two distinct types of CV outbursts (dwarf novae and classical novae). As discussed in §3.3, there are multiple similarities between the first stage of the 2000 outburst and the 1997 event, which was due to an accretion-disk instability (see §3.2). The 2000–2002 outburst thus appears to have started as an accretion-disk instability. After a few weeks to months, however, the outburst energetics became dominated by an increase in nuclear shell burning on the surface of the WD. In addition, during the rise to optical maximum, an optically thick shell of material was ejected, causing to drop and P-Cygni profiles to appear in the spectra. We suggest that the 2000–2002 outburst of Z And was triggered by the influx of hydrogen-rich material from a dwarf-nova-like disk instability, and then powered by the subsequent increase in nuclear shell burning on the WD, in a milder version of the phenomenon that powers classical novae. The outburst in Z And therefore combines elements of dwarf novae and classical novae. We refer to this new type of eruption as a combination nova. Since the latter stages of typical classical symbiotic outbursts are similar to the 2000–2002 outburst of Z And, and the the recurrence times for classical symbiotic outbursts are shorter than theoretical calculations can obtain for standard shell flashes (Sion, Acierno, & Tomczyk, 1979), it is possible that many classical symbiotic outbursts are combination novae.
The initial correspondence between the 2000 and 1997 outbursts suggests that the physical trigger mechanism was the same for both events. A disk-instability trigger mechanism can explain the recurrence times (from a few years to more than a decade) of the outbursts of Z And and other classical symbiotic stars. Furthermore, since symbiotics are wide binaries, their accretion disks are probably large. For typical accretion rates of to , the disk temperature ranges from K close to the white dwarf surface to – K at . These conditions encompass the range needed for an unstable disk (e.g., Cannizzo, 1993; Osaki, 1996, and references therein). Based on a correlation between the presence of classical symbiotic outbursts and either observational indicators that the red giant is close to filling its Roche lobe (and therefore that a disk is more likely to be present around the WD) or photometric oscillations similar to the superhumps in the SU UMa class of CVs, Mikołajewska et al. (2002) suggest that the presence of an accretion disk drives the eruptions in the symbiotic binaries Z And, YY Her, CI Cyg, BF Cyg, and AX Per. Our extensive observations of Z And show that this assertion is true for this object, and explain how the presence of an accretion disk can produce classical symbiotic outbursts.
For the disk-instability trigger mechanism to produce an observable increase in the rate of nuclear shell burning on the WD, the amount of material added, , must be a significant fraction of the mass of the WD envelope, . Extrapolating slightly from the curves in Fig. 8 of Townsley & Bildsten (2004), we expect the envelope mass on a WD accreting at a rate of a few times to be around . For the luminous WD in Z And, the envelope mass should be even smaller since less material is required to initiate a thermonuclear runaway or weak shell flash on a luminous WD (e.g., Sion & Starrfield, 1986). Observationally, Fig. 10 shows that the first stage of the 2000 event rose higher than the maximum reached in 1997, apparently crossing some threshold in needed to produce a thermonuclear response. For the 1997 event, which we assume was entirely accretion powered, if we take a bolometric correction mag, we find is approximately equal to a few times . The amount of material accreted in 2000 was probably similar or somewhat larger. Thus /–0.1 (for –) appears to be sufficient to produce enough of an increase in pressure, and hence temperature, to trigger a nuclear response in the burning shell of Z And. The relatively small amount of accreted material that appears to be able to trigger a shell flash, and the correspondingly short amount of time between flashes, cannot be explained by current models of nuclear burning on the surface of a WD. Episodic accretion through an unstable disk could be the additional factor that needs to be taken into account. If we take an average accretion rate into the WD disk of (see Iijima, 2002, who finds typical mass transfer rates in symbiotic stars of to ), then it would be possible to both fuel the quasi-steady burning and accumulate enough material in the disk to trigger a combination nova roughly every ten years.
After the addition of fresh fuel, we expect the nuclear burning rate to increase on the thermal time scale at the base of the envelope,
| (5) |
where is the specific heat at constant pressure, is the temperature at the base of the WD envelope, is the mass of the envelope, and erg g-1 is the amount of energy released by burning one gram of hydrogen-rich material. For steady CNO burning, the temperature at the base of the envelope is K. However, since the CNO burning rate, , is a very sensitive function of (), and this burning rate increased by a factor of ten during the 2000–2002 outburst of Z And, the observed burning enhancement can be produced by about a 10% change in the temperature at the base of the envelope, or a change of less than K. Thus, the thermal time scale associated with the observed degree of change in nuclear burning in Z And is
| (6) | |||||
Here, we have taken an envelope mass of , and an average accretion rate of .
The second stage of the 2000–2002 outburst occurred about 2 weeks after the beginning of the outburst. This response time is quite close to the expected nuclear response time given in Eq. 6, which could in fact be even shorter if the total amount of fresh fuel is a significant fraction of the WD envelope and is dumped onto the WD quickly (i.e., within a few days to a week), so that the compression becomes adiabatic. To test this disk-instability-trigger idea for future symbiotic-star outbursts, it will be important to obtain optical spectra during the first few days of the initial rise.
Both symbiotic stars and supersoft X-ray sources probably contain accreting WDs with nuclear shell burning (van den Heuvel et al., 1992; Mürset et al., 1991; Sokoloski et al., 2001). However, based upon the lower hot-component luminosity estimates for symbiotics, the burning may occur at a slower rate in symbiotics (and in a few, it is completely absent). The cause of optical and X-ray brightness changes appears to be another important difference between these two classes of objects, both of which are considered to be possible progenitors of Type Ia supernovae.
A promising model for the long-term variability of at least some supersoft X-ray sources is the simple photospheric-expansion model (in which the WD bolometric luminosity remains constant), since X-ray fluxes have been seen to drop when the optical fluxes rise in several supersoft sources (e.g., Southwell et al., 1996). We do not observe this inverse relationship between optical and X-ray flux during either the 1997 or the 2000–2002 outbursts of Z And. As discussed in §3.1 and §3.3, the rise in in 1997 and the increase in by an order of magnitude during the 2000–2002 outburst are also at odds with the simple photospheric-expansion model. Finally, given the low (compared to supersoft X-ray sources) hot-component effective temperature for Z And, blackbody emission from the WD surface probably plays very little role in producing the X-ray emission from this source. Instead, the X-ray observations of Z And are consistent with the combination nova picture.
5. Summary
We have shown that the 2000–2002 outburst of Z And was primarily powered by an increase in nuclear burning on the WD surface. The smaller, 1997 event, on the other hand, is consistent with having been a disk instability like those of dwarf novae. Thus more than one type of classical symbiotic outburst can occur within the same symbiotic system. The key points that allow us to gain new insight into classical symbiotic outbursts from the 2000–2002 eruption of Z And are as follows: 1) high-precision light curves that showed the outburst to be a multistage event; 2) the close similarity between the first stage of the multi-stage outburst and the 1997 outburst, which we identify as a dwarf-nova-like disk instability; and 3) the fact that the hot-component luminosity during much of the eruption, as determined from FUV fluxes, was too high for the outburst to have been solely accretion-driven.
In the 2000–2002 event, the bolometric luminosity increased during the outburst to , indicating that the outburst could not have been due to either a simple expansion of the white-dwarf photosphere (e.g., in response to a small change in to above the steady-burning upper limit) or to a burst of accretion. Instead, the overall energetics support thermonuclear shell burning as the main source of power. However, since both the short recurrence time for large outbursts in Z And and the structure of the 2000–2002 outburst light curve suggest that the increase in nuclear burning was not a standard recurrent nova, we suggest that the enhanced nuclear burning was triggered by an accretion event. We favor a dwarf-nova-type disk instability as the trigger. Thus, we propose a new type of outburst that combines the physics of dwarf novae and classical novae. We call this type of event a combination nova.
References
- Altamore et al. (1981) Altamore, A., Baratta, G. B., Cassatella, A., Friedjung, M., Giangrande, A., Ricciardi, O., Viotti, R. 1981, ApJ, 245, 630
- Aschenbach (2002) Aschenbach, B. 2002, Proc. SPIE, 4496, 8
- Aurière (1982) Aurière, M. 1982, A&A, 109, 301
- Barman et al. (2000) Barman, T. S., Hauschildt, P. H., Short, C. I., & Baron, E. 2000, ApJ, 537, 946
- Bath & Shaviv (1976) Bath, G. T., & Shaviv, G. 1976, MNRAS, 175, 305
- Birriel et al. (1998) Birriel, J. J., Espey, B. R., & Schulte-Ladbeck, R. E. 1998, ApJ, 507, L75
- Brocksopp et al. (2004) Brocksopp, C., Sokoloski, J. L., Kaiser, C., Richards, A. M., Muxlow, T. W. B., & Seymour, N. 2004, MNRAS, 347, 430
- Burstein & Heiles (1982) Burstein, D., & Heiles, C. 1982, AJ, 87, 1165
- Cannizzo (1993) Cannizzo, J. K. 1993, in Accretion Disks in Compact Stellar Systems, ed. J. Wheeler (Singapore: World Scientific), 6
- Cannizzo, Wheeler, & Polidan (1986) Cannizzo, J. K., Wheeler, J. C., & Polidan, R. S. 1986, AJ, 301, 634
- Cardelli, Clayton, & Mathis (1989) Cardelli, J. A., Clayton, G. C., & Mathis, J. S. 1989, ApJ, 345, 245
- Corradi, Mikołajewska, & Mahoney (2003) Corradi, R. L. M., Mikolajewska, J., & Mahoney, T. J. 2003, Astronomical Society of the Pacific Conference Series, 303
- Crocker et al. (2001) Crocker, M. M., Davis, R. J., Spencer, R. E., Eyres, S. P. S., Bode, M. F., & Skopal, A. 2001, MNRAS, 335, 1100
- Dickey & Lockman (1990) Dickey, J. M., & Lockman, F. J. 1990, ARA&A, 28, 215
- Duschl (1986a) Duschl, W. J. 1986a, A&A, 163, 56
- Duschl (1986b) Duschl, W. J. 1986b, A&A, 163, 61
- Ebisawa et al. (2001) Ebisawa, K., et al. 2001, ApJ, 550, 1007
- Espey et al. (1996) Espey, B., Keenan, F. P., McKenna, F. C., Feibelman, W. A., Aggarwal, K. M. 1996, ApJ, 465, 965
- Espey & McCandliss (2003) Espey, B. R., & McCandliss, S. R. 2003, in Symbiotic Stars Probing Stellar Evolution, ASP Conference Proceedings, Vol. 303. Held 27-31 May 2002 at Isaac Newton Group of Telescopes, La Palma, Spain, Eds. R. L. M. Corradi, R. Mikołajewska and T. J. Mahoney (San Francisco: Astronomical Society of the Pacific), p.72
- Fabricant et al. (1998) Fabricant, D. G., Cheimets, P., Caldwell, N., & Geary, J. 1998, PASP, 110, 79
- Fernández-Castro et al. (1988) Fernández-Castro, T., Cassatella, A., Giménez, A., & Viotti, R. 1988, ApJ, 324, 1016
- Fernández-Castro et al. (1995) Fernández-Castro, T., González-Riestra, R., Cassatella, A., Taylor, A. R., & Seaquist, E. R. 1995, ApJ, 442, 366
- Filippenko et al. (2001) Filippenko, A. V., et al. 2001, in Small Telescope Astronomy on Global Scales, ed. B. Paczyński et al. (San Franciso: ASP), p.121
- Filippenko (2005) Filippenko, A. V. 2005, in The Fate of the Most Massive Stars, ed R. Humphreys & K. Stanek (San Francisco: ASP), p. 34
- Formiggini & Leibowitz (1994) Formiggini, L., & Leibowitz, E. 1994, A&A, 292, 534
- Fujimoto (1982) Fujimoto, M. Y. 1982, ApJ, 257, 767
- Iben (1982) Iben, I. 1982, ApJ, 259, 244
- Iijima (2002) Iijima, T. 2002, NewA, 7, 147
- Iijima (1981) Iijima, T. 1981, in Photometric and Spectroscopic Binary Systems, Proceedings of the NATO Advanced Study Institute (NATO ASI series, v. 69), p. 517
- Jahoda et al. (1996) Jahoda, K., Swank, J. H., Giles, A. B., Stark, M. J., Strohmayer, T., Zhang, W., & Morgan, E. H. 1996, Proc. SPIE, 2808, 59
- Kahabka et al. (1999) Kahabka, P., Hartmann, H. W., Parmar, A. N., & Negueruela, I. 1999, A&A, 347, L43
- Kellogg, Pedelty, & Lyon (2001) Kellogg, E., Pedelty, J. A., & Lyon, R. G. 2001, ApJ, 563, L151
- Kenny (1995) Kenny, H. 1995, PhD, University of Calgary (Canada)
- Kenyon (1986) Kenyon, S. J. 1986, “The Symbiotic Stars”, (Cambridge: Cambridge University Press)
- Kenyon & Fernández-Castro (1987) Kenyon, S. J., & Fernández-Castro, T. 1987, AJ, 93, 938
- Kenyon, Proga, & Keyes (2001) Kenyon, S. J., Proga, D., & Keyes, C. D. 2001, AJ, 122, 349
- Kenyon & Truran (1983) Kenyon, S. J., & Truran, J. W. 1983, ApJ, 273, 280
- Kenyon & Webbink (1984) Kenyon, S. J., & Webbink, R. F. 1984, ApJ, 279, 252
- Kilpio et al. (2005) Kilpio, E., Bisikalo, D. V., Boyarchuk, A. A., & Kuznetsov, O. A. 2005, in The Astrophysics of Cataclysmic Variables and Related Objects, ASP Conf. Series,
- Li et al. (2000) Li, W., et al. 2000, in Cosmic Explosions, ed. S. S. Holt & W. W. Zhang (New York: American Institute of Physics), p. 103
- Livio (1988) Livio, M. 1988, in The Symbiotic Phenomenon, Proccedings of IAU Colloq. 103, ed. J. Mikołajewska et al. (Dordrecht: Kluwer), p. 149
- Livio, Prialnik, & Regev (1989) Livio, M., Prialnik, D., & Regev, O. 1989, ApJ, 341, 299
- McCandliss (2003) McCandliss, S. R. 2003, PASP, 115, 651
- Mikołajewska et al. (1988) Mikołajewska, J., Friedjung, M., Kenyon, S. J., & Viotti, R., eds. 1988, The Symbiotic Phenomenon, Proccedings of IAU Colloq. 103, (Dordrecht: Kluwer)
- Mikołajewska & Kenyon (1996) Mikołajewska, J., & Kenyon, S. J. 1996, AJ, 112, 1659
- Mikołajewska et al. (1995) Mikołajewska, J., Kenyon, S. J., Mikołajewski, M., Garcia, M. R., & Polidan, R. S. 1995, AJ, 109, 1289
- Mikołajewska et al. (2002) Mikołajewska, J., Kolotilov, E. A., Shenavrin, V. I., & Yudin, B. F. 2002, in The Physics of Cataclysmic Variables and Related Objects, ASP Conference Proceedings, Vol. 261, ed. B. T. Gänsicke, K. Beuermann, & K. Reinsch (San Francisco: Astronomical Society of the Pacific, p. 645
- Moos et al. (2000) Moos, H. W., et al. 2000, ApJ, 538, L1
- Mürset & Nussbaumer (1994) Mürset, U., & Nussbaumer, H. 1994, A&A, 282, 586
- Mürset et al. (1991) Mürset, U., Nussbaumer, H., Schmid, H. M., & Vogel, M. 1991, A&A, 248, 458
- Mürset et al. (1997) Mürset, U., Wolff, B., & Jordan, S. 1997, A&A, 319, 201
- Nussbaumer (2003) Nussbaumer, H. 2003, in Symbiotic Stars Probing Stellar Evolution, ASP Conference Proceedings, Vol. 303. Held 27-31 May 2002 at Isaac Newton Group of Telescopes, La Palma, Spain, Eds R. L. M. Corradi, R. Mikolajewska and T. J. Mahoney (San Francisco: Astronomical Society of the Pacific), p.325
- Nussbaumer & Vogel (1989) Nussbaumer, H., & Vogel, M. 1989, A&A, 213, 137
- Osaki (1996) Osaki, Y. 1996, PASP, 108, 39
- Paczyński & Rudak (1980) Paczyński, B., & Rudak, B. 1980, A&A, 82, 349
- Paczyński & Żytkow (1978) Paczyński, B., & Żytkow, A. N. 1978, ApJ, 222, 605
- Sahnow et al. (2000) Sahnow, D. J. et al. 2000, ApJ, 538, L7
- Schlegel et al. (1998) Schlegel, D. J., Finkbeiner, D. P., & Davis, M. 1998, ApJ, 500, 525
- Schmid et al. (1999) Schmid, H. M., et al. 1999, A&A, 348, 950
- Schmid & Schild (1997) Schmid, H. M., & Schild, H. 1997, A&A, 327, 219
- Seaquist & Taylor (1990) Seaquist, E. R., Taylor, A. R. 1990, ApJ, 349, 313
- Sion, Acierno, & Tomczyk (1979) Sion, E. M., Acierno, M. J., & Tomczyk, S. 1979, ApJ, 230, 832
- Sion & Ready (1992) Sion, E. M., & Ready, C. J. 1992, PASP, 104, 87
- Sion & Starrfield (1986) Sion, E. M., & Starrfield, S. G. 1986, ApJ, 303, 130
- Sion & Starrfield (1994) Sion, E. M., & Starrfield, S. G. 1994, ApJ, 421, 261
- Skopal (2003) Skopal, A. 2003, A&A, 401, L17
- Skopal et al. (2002) Skopal, A., Vǎnko, M., Pribulla, T., Wolf, M., Semkov, E., & Jones, A. 2002, Contributions of the Astronomical Observatory Skalnate Pleso, vol. 32, no. 1, p 62
- Sokoloski & Bildsten (1999) Sokoloski, J. L., & Bildsten, L. 1999, ApJ, 517, 919
- Sokoloski et al. (2001) Sokoloski, J. L., Bildsten, L., & Ho, W. C. G. 2001, MNRAS, 326, 553
- Sokoloski et al. (2002) Sokoloski, J. L., Bildsten, L., Chornock, R., & Filippenko, A. V. 2002, PASP, 114, 636
- Southwell et al. (1996) Southwell, K. A., Livio, M., Charles, P. A., O’Donoghue, D., & Sutherland, W. J. 1996, ApJ, 470, 1065
- Spitzer (1978) Spitzer, L. 1978, “Physical Processes in the Interstellar Medium” (New York: John Wiley-Interscience)
- Starrfield, Sparks, & Truran (1985) Starrfield, S., Sparks, W. M., & Truran, J. W. 1985, ApJ, 291, 136
- Swings & Struve (1970) Swings, P., & Struve, O. 1970, Spectroscopic Astrophysics. An Assessment of the Contributions of Otto Struve, 175
- Taylor, Ulvestad, & Perley (2004) Taylor, G.B., Ulvestad, J.S., & Perley, R.A. 2004, ”The Very Large Array Observational Status Summary”, available at http://www.vla.nrao.edu/astro/
- Tomov et al. (2003) Tomov, N. A., Taranova, O. G., & Tomova, M. T. 2003, A&A, 401, 669
- Tomov, Tomova, & Taranova (2004) Tomov, N. A., Tomova, M. T., & Taranova, O. G. 2004, A&A, 428, 985
- Townsley & Bildsten (2004) Townsley, D. M., & Bildsten, L. 2004, ApJ, 600, 390
- Tutukov & Yungelson (1976) Tutukov, A. V., & Yungelson, L. R. 1976, Astrofizika, 12, 521
- van den Heuvel et al. (1992) van den Heuvel, E. P. J., Bhattacharya, D., Monoto, K., & Rappaport, S. A. 1992, A&A, 262, 97
- Viotti et al. (1982) Viotti, R., Giangrande, A., Ricciardi, O., & Cassatella, A. 1982, ASSL Vol. 95: IAU Colloq. 70: The Nature of Symbiotic Stars, 125
- Vogel (1991) Vogel, M. 1991, A&A, 249, 173
- Warner (1995) Warner, B. 1995, “Cataclysmic Variable Stars”, Cambridge Astrophysics Series, Cambridge, New York: Cambridge University Press, 1995
- Webbink (1976) Webbink, R. F. 1976, Nature, 262, 271
- Weisskopf et al. (2002) Weisskopf, M. C., Brinkman, B., Canizares, C., Garmire, G., Murray, S., & Van Speybroeck, L. P. 2002, PASP, 114, 1
| Date | |||
|---|---|---|---|
| (JD) | (mag) | (mag) | (mag) |
| 2451801.75 | 9.69 | ||
| 2451802.75 | 9.66 | 10.41 | 9.39 |
| 2451803.75 | 9.76 | 10.39 | 9.47 |
| 2451804.75 | 9.94 | 10.61 | 9.56 |
| 2451805.75 | 9.86 | 10.59 | 9.53 |
| 2451806.75 | 9.76 | 10.54 | 9.49 |
| 2451807.75 | 9.80 | 10.57 | 9.52 |
| 2451808.75 | 10.59 | 9.52 | |
| 2451810.75 | 9.80 | 10.44 | 9.47 |
| 2451811.75 | 9.75 | 10.37 | 9.46 |
Note. — The complete version of this table is in the electronic edition of the Journal, and includes photometry from 276 nights. The printed edition contains only a sample. The relative photometry is accurate to approximately 1%. Absolute photometry is accurate to approximately 10%.
| Obs. Num | UT Date | JD2450000 | Days into OutburstaaThe beginning of the 2000–2002 outburst was taken to be JD 2451790. |
|---|---|---|---|
| FAST spectra on 162 dates before the 2000–2002 outburst. | |||
| O1 | 2000 Sep 19 | 1806 | 17 |
| O2 | 2000 Sep 23 | 1810 | 21 |
| O3 | 2000 Oct 04 | 1821 | 32 |
| O4 | 2000 Nov 25 | 1873 | 84 |
| O5bbFrom the William Herschel Telescope, courtesy of R. Hynes. | 2000 Dec 03 | 1882 | 92 |
| O6 | 2000 Dec 29 | 1907 | 117 |
| Plus FAST spectra on 111 additional dates through the end of 2003. | |||
Note. — See the version of Table 3 in the electronic edition of the Journal for the full listing of FAST optical spectra.
| Date | Exposure | H | [O III] | He I | N III | He II | H | He I | [Fe VII] | TiO | H | He I | Raman | TiO |
|---|---|---|---|---|---|---|---|---|---|---|---|---|---|---|
| (JD) | Time (s) | 4340Å | 4363Å | 4388Å | 4640Å | 4686Å | 4861Å | 5876Å | 6087Å | 6200Å | 6563Å | 6678Å | 6830Å | 7175Å |
| 2449608.87614 | 5.00 | -36.51 | -8.50 | -3.36 | -7.00 | -79.63 | -44.46 | -7.28 | -1.55 | 0.59 | -120.30 | -3.96 | -9.69 | 1.02 |
| 2449608.87672 | 5.00 | -37.96 | -8.25 | -3.21 | -6.42 | -79.45 | -45.29 | -7.27 | -1.23 | 0.57 | -123.00 | -3.49 | -9.64 | 1.01 |
| 2449608.87730 | 60.00 | -38.71 | -9.86 | -4.65 | -7.53 | -81.31 | -45.35 | -7.78 | -1.38 | 0.59 | -79.90 | -3.43 | -9.56 | 1.01 |
| 2449693.62117 | 5.00 | -52.39 | -3.37 | -3.11 | -8.99 | -86.84 | -90.62 | -7.80 | -1.88 | 0.55 | -179.72 | -4.18 | -11.34 | 0.86 |
| 2449693.62223 | 30.00 | -50.95 | -4.87 | -2.97 | -8.63 | -88.37 | -94.11 | -7.32 | -2.12 | 0.56 | -171.12 | -4.15 | -11.46 | 0.86 |
| 2449725.57784 | 5.00 | -51.76 | -2.92 | -3.71 | -8.01 | -84.37 | -96.06 | -7.88 | -1.96 | 0.56 | -190.80 | -5.10 | -10.35 | 0.84 |
| 2449725.57821 | 30.00 | -54.49 | -3.25 | -2.84 | -6.67 | -80.26 | -100.16 | -7.82 | -1.79 | 0.58 | -170.60 | -5.03 | -9.94 | 0.85 |
| 2449725.57922 | 60.00 | -55.38 | -4.08 | -2.60 | -7.41 | -82.00 | -97.73 | -7.93 | -1.81 | 0.57 | -153.39 | -5.25 | -10.04 | 0.86 |
| 2449749.56896 | 60.00 | -55.03 | -3.93 | -2.90 | -6.53 | -78.05 | -95.47 | -10.63 | -1.79 | 0.56 | -54.30 | -5.32 | -9.88 | 0.76 |
| 2449749.56999 | 60.00 | -57.80 | -3.69 | -2.55 | -7.11 | -73.69 | -95.69 | -10.13 | -1.92 | 0.56 | -37.69 | -5.38 | -10.98 | 0.80 |
Note. — The complete version of this table is in the electronic edition of the Journal. The printed edition contains only a sample. The complete version contains equivalent widths from 826 spectra between JD 2449608.8761 and JD 2453002.5699. Equivalent widths are given in units of Å and have errors of 5%–10%.
| Obs. | UT Date | JD | Obs | aaFUSE flux densities in units of erg cm-2 s-1 Å-1. | aaFUSE flux densities in units of erg cm-2 s-1 Å-1. | aaFUSE flux densities in units of erg cm-2 s-1 Å-1. |
|---|---|---|---|---|---|---|
| Num. | 2450000 | Length (s) | (959.5 Å) | (1058.7 Å) | (1103.4 Å) | |
| F1 | 2000 Nov 16 | 1865.1 | 8203 | |||
| F2 | 2000 Nov 27 | 1875.8 | 10847 | |||
| F3 | 2000 Dec 15 | 1894.4 | 10444 | |||
| F4 | 2001 Jul 20 | 2111.1 | 10928 | |||
| F5 | 2001 Jul 22 | 2112.8 | 13081 | |||
| F6 | 2001 Sep 30 | 2183.1 | 10825 | |||
| F7 | 2002 Jul 05 | 2460.6 | 3731 | 0.2 | ||
| 2002 Oct 20 | 2568.5 | 59 | Safety Snap | |||
| F8 | 2002 Oct 22 | 2570.4 | 6736 | 0.2 | 0.2 | |
| F9 | 2003 Aug 04 | 2856.1 | 14175 | |||
| Obs. | UT Date | DayaaDay = JD2450000. | Instrument | ccFlux densities in mJy. | ccFlux densities in mJy. | ccFlux densities in mJy. | ccFlux densities in mJy. |
|---|---|---|---|---|---|---|---|
| Num | (ConfigbbConfig = VLA Configuration. The configuration of the VLA antennas is changed over time, between the most extended (A) configuration, with a resolution of about 0.35 arcsec at 4.86 GHz, and the most compact (D) configuration, with a resolution some 35 times worse. See, e.g., Taylor, Ulvestad, & Perley (2004) for details.) | (1.4 GHz) | (5 GHz) | (8.5 GHz) | (15 GHz) | ||
| R1 | 2000 Oct 13 | 1830 | VLA (D) | 0.29 | 0.42 (0.06) | 0.87 (0.13) | |
| R2 | 2000 Nov 17 | 1865 | VLA (A) | 0.28 (0.05) | 0.80 (0.03) | 2.45 (0.09) | |
| R3 | 2001 Jan 12 | 1921 | VLA (A) | 0.29 | 1.21 (0.10) | 2.94 (0.50) | |
| R4 | 2001 Jan 28 | 1937 | MERLIN | 1.32 (0.37) | |||
| R5 | 2001 Feb 28 | 1968 | MERLIN | 0.70 (0.21) | |||
| R6 | 2001 Mar 15 | 1983 | VLA (B) | 0.17 | 1.09 (0.03) | 3.50 (0.12) | |
| R7 | 2001 May 08 | 2037 | VLA (B) | 0.69 (0.02) | 1.02 (0.02) | 2.53 (0.09) | |
| R8 | 2001 Aug 10 | 2131 | VLA (C) | 0.28 (0.08) | 1.06 (0.04) | 2.14 (0.14) | |
| R9 | 2001 Sep 18 | 2170 | MERLIN | 1.20 (0.26)ddSpatially resolved. Flux densities quoted for these observations are the total flux densities. | |||
| R10 | 2001 Oct 23 | 2205 | MERLIN | 0.86 (0.20) | |||
| R11 | 2002 Apr 30 | 2394 | MERLIN | 0.78 (0.20) | |||
| R12 | 2002 May 06 | 2400 | MERLIN | 0.64 (0.20) | |||
| R13 | 2002 Dec 09 | 2618 | VLA (C) | 0.50 (0.10) | 0.84 (0.07) | ||
| R14 | 2003 Jan 03 | 2643 | VLA(C) | 0.42 (0.09) | 0.84 (0.08) | ||
| R15 | 2003 Jul 24 | 2845 | VLA (A) | 0.65 (0.06)ddSpatially resolved. Flux densities quoted for these observations are the total flux densities. | 1.55 (0.16) |
| Obs. Num/ | UT Date | JD | Orbital | Obs. LengthbbSecond quantity for the observations is the remaining observation length after removal of high-background data. | Source |
|---|---|---|---|---|---|
| Inst | -2450000 | PhaseaaOrbital phase from ephemeris of Mikołajewska & Kenyon (1996). | (ksec) | Counts | |
| X1/ (ACIS-S/HETGS) | 2000 Nov 13 | 1862 | 0.12 | 19 | 109 |
| X2/ (EPIC-pn) | 2001 Jan 28 | 1938 | 0.21 | 20/16 | 1500 |
| X3/ (EPIC-pn) | 2001 Jun 11 | 2072 | 0.39 | 15/4 | 140 |
| UT | Eedge1 | Eedge2 | dof | aa0.3–7 keV absorbed flux ( erg cm-2 s-1). | bb0.3–7 keV unabsorbed flux ( erg cm-2 s-1). | |||
|---|---|---|---|---|---|---|---|---|
| Date | ( cm-2) | (keV) | (keV) | (keV) | ||||
| X1 (2000 Nov) | 0.53/5 | |||||||
| X2 (2001 Jan) | 1.11/56 | |||||||
| X3 (2001 June) | 0.35/11 |
Note. — All fit parameters are for blackbody models plus absorption edges, with an additional powerlaw component in observation X2 ( is the photon index). The quoted uncertainties are 90% confidence.
| Obs. | UT Date | JD | aa extinction-corrected flux densities at 1058.7 Å and 1103.4 Å in units of erg cm-2 s-1 A-1. Fluxes are corrected for interstellar extinction using the extinction curve of Cardelli, Clayton, & Mathis (1989) as implemented in the IDL routine ‘unred_ccm’ (see http://archive.stsci.edu/pub/iue/software/iuedac/procedures/unred_ccm.pro), with mag and . | aa extinction-corrected flux densities at 1058.7 Å and 1103.4 Å in units of erg cm-2 s-1 A-1. Fluxes are corrected for interstellar extinction using the extinction curve of Cardelli, Clayton, & Mathis (1989) as implemented in the IDL routine ‘unred_ccm’ (see http://archive.stsci.edu/pub/iue/software/iuedac/procedures/unred_ccm.pro), with mag and . | |||
|---|---|---|---|---|---|---|---|
| Num. | 2450000 | ( K) | () | () | |||
| F1 | 2000 Nov 16 | 1865.1 | 92 | 250 | 240 | 6600 | |
| F2 | 2000 Nov 27 | 1875.8 | 94 | 380 | 330 | 9400 | |
| F3 | 2000 Dec 15 | 1894.4 | 95 | 380 | 340 | 9800 | |
| F4 | 2001 Jul 20 | 2111.1 | 120 | 180 | 150 | 6100 | |
| F5 | 2001 Jul 22 | 2112.8 | 120 | 190 | 150 | 6100 | |
| F6 | 2001 Sep 30 | 2183.1 | 120 | 190 | 150 | 5600 | |
| F7bbFor observations F7–F9, the flux ratios are unphysical for a WD photosphere. They have therefore likely been contaminated by non-photospheric absorption and/or emission. The formal values of and for these observations should thus be used with extreme caution. | 2002 Jul 5 | 2460.6 | 150 | 24 | 16 | 1500 | |
| F8bbFor observations F7–F9, the flux ratios are unphysical for a WD photosphere. They have therefore likely been contaminated by non-photospheric absorption and/or emission. The formal values of and for these observations should thus be used with extreme caution. | 2002 Oct 22 | 2570.4 | 120 | 3 | 5 | 200 | |
| F9bbFor observations F7–F9, the flux ratios are unphysical for a WD photosphere. They have therefore likely been contaminated by non-photospheric absorption and/or emission. The formal values of and for these observations should thus be used with extreme caution. | 2003 Aug 04 | 2856.1 | 160 | 26 | 18 | 2000 |