The Peculiar Type Ib Supernova SN 2005bf: Explosion of a Massive He Star With a Thin Hydrogen Envelope?
Abstract
We present photometry and optical spectroscopy of SN 2005bf near light maximum. The maximum phase is broad and occurred around 2005 May 7, about forty days after the shock breakout. SN 2005bf has a peak bolometric magnitude : while this is not particularly bright, it occurred at an epoch significantly later than other SNe Ibc, indicating that the SN possibly ejected M☉ of 56Ni, which is more than the typical amount. The spectra of SN 2005bf around maximum are very similar to those of the Type Ib SNe 1999ex and 1984L about 25-35 days after explosion, displaying prominent He I, Fe II, Ca II H & K and the near-IR triplet P Cygni lines. Except for the strongest lines, He I absorptions are blueshifted by km s-1, and Fe II by km s-1. No other SNe Ib have been reported to have their Fe II absorptions blueshifted more than their He I absorptions. Relatively weak H and very weak H may also exist, blueshifted by km s-1. We suggest that SN 2005bf was the explosion of a massive He star, possibly with a trace of a hydrogen envelope.
1 Introduction
The study of a subclass of hydrogen deficient supernovae, namely type Ib and type Ic events, has been one of the interesting topics in supernova (SN) research. The observational properties, progenitors, and hence the physics of explosion are the least understood for these two subclasses. The recently established connection of bright and energetic SN Ic events with Gamma-Ray Burst sources (e.g. Mazzali et al.,, 2003) makes their study interesting and exciting. Type Ib and Ic SNe are classified on the basis of their spectra. Both types are hydrogen deficient at maximum light, and also lack the deep Si II absorption near 6150 Å, a characteristic feature of the Ia events. At early phases Ic’s do not show lines of He I, shown by the Ib’s, while at later phases both types have similar spectra (Wheeler & Harkness, 1990; Matheson et al.,, 2001; Branch et al.,, 2002). The Ib and Ic supernovae events are widely accepted to be core collapse supernovae (e.g. Shigeyama et al.,, 1990; Hachisu et al.,, 1991; Woosley, Langer & Weaver, 1993; Nomoto et al.,, 1994).
Supernova SN 2005bf was discovered independently by Monrad (2005) and Moore & Li (2005) on April 5.722, 2005 (UT), at a magnitude about 18.0, in the SB(r)b galaxy MCG +00-27-5. The supernova was also marginally detected, at magnitude about 18.8, on a image taken on Mar. 30.31 (Moore & Li, 2005). Early spectroscopic observations indicated the supernova to be of type Ic a few days before maximum light (Morell et al.,, 2005; Modjaz et al.,, 2005). SN 2005bf was reported to undergo an unusual photometric behaviour by Hamuy et al., (2005). After an initial brightening from April 7 to April 13, the supernova declined until April 21, after which it re-brightened to magnitudes brighter than the initial maximum (see light curves posted at the Carnegie Supernova Project (CSP) group website999http://csp1.lco.cl/cspuser1/images/OPTICAL LIGHT CURVES/SN05bf.html). Spectra obtained during the re-brightening (Wang & Baade, 2005; Modjaz, Kirshner & Chalis, 2005) indicated that the spectrum had developed conspicious lines of He I similar to type Ib supernovae. Also, the SN reached a bright maximum, making it an interesting target.
In this paper we present optical spectroscopy of SN 2005bf obtained near the maximum, and optical photometry during the maximum and subsequent decline. CCD photometric and spectroscopic observations were performed with the 2-m Himalayan Chandra Telescope (HCT) at the Indian Astronomical Observatory (IAO), Hanle, India using the Himalaya Faint Object Spectrograph Camera (HFOSC).
2 The Optical and Bolometric Light Curves
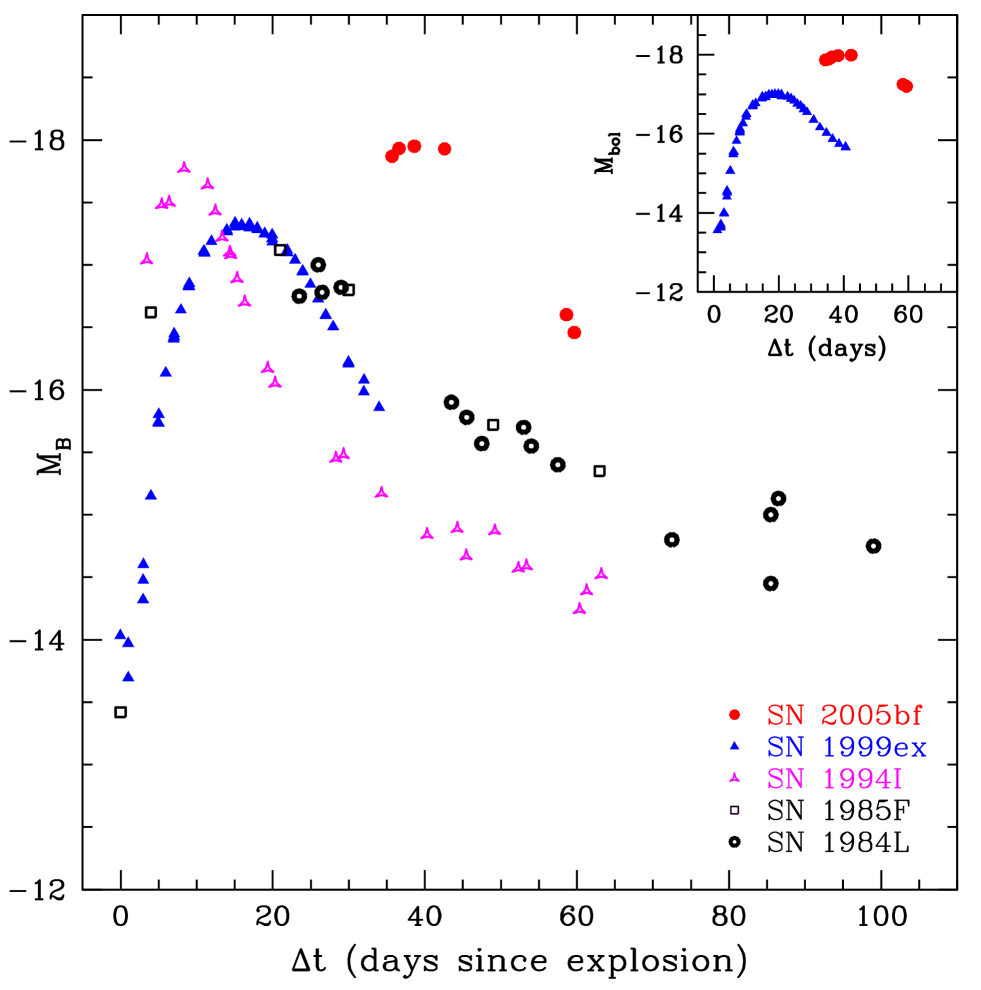
Photometric observations in the Bessell bands were made during May 3 – May 28. Landolt standard regions were observed on May 27 to calibrate a sequence of secondary standards in the supernova field. The magnitudes of SN 2005bf and the secondary standards in the field were obtained by point spread function photometry. The identification and magnitudes of the secondary standards in the field of SN 2005bf may be obtained from http://www.iiap.res.in/personnel/gca/sn05cal.html. The light curves of SN 2005bf are shown in Figure 1. Also included in the figure with the magnitudes are the unfiltered CCD magnitudes reported in the IAU Circulars, and the estimates made by amateurs 101010http://www.astrosurf.com/snweb2/2005/05bf/05bfMeas.htm. The pre-maximum evolution of SN 2005bf was quite peculiar and different from that of other SNe Ib/c. SN 2005bf had a very slow rise to the maximum, which occurred around 2005 May 7, nearly 40 days since the shock breakout. In contrast, the type Ib SN 1999ex rose to maximum in about 18 days (Stritzinger et al.,, 2002). After maximum, which was broad, SN 2005bf declined with rates of 0.07 mag day-1, 0.038 mag day-1, 0.05 mag day-1 and 0.014 mag day-1 in ,, and , respectively, which are similar to the decline rates observed in SN Ib SN 1999ex at similar epochs with respect to maximum.
In this paper we assume the date of explosion to be 2005 March 30 (JD 2 45 3459.5), based on Moore & Li (2005) and the light curve posted by the CSP. A Galactic reddening E(B-V) = 0.045 as estimated by Schlegel, Finkbeiner & Davis (1998) in the direction of the host galaxy has been used. As the supernova occurred in one of the spiral arms of the host galaxy, reddening within the host is also expected. However, since no conspicious Na I D absorption features have been reported, we assume negligible extinction due to the host galaxy. We adopt a distance modulus of for the host galaxy using km s-1 Mpc-1, , , and a redshift of (HyperLeda database).
The bolometric magnitudes were estimated by converting our photometry, corrected for the assumed E(B-V), into absolute monochromatic fluxes adopting the magnitude-to-flux conversion factors compiled by Bessell et al., (1998). The fluxes were then integrated using a fitting spline curve. Around the light maximum, extending the spline fit only to 3600 Å give bolometric magnitudes about 0.15-0.2 mag fainter than if the fit were extended to 3000 Å, while there is no significant difference around the epochs of our last observations, indicating a significant contribution by the flux around maximum. Hence, the bolometric magnitudes are estimated with zero-flux terminals of the spline fit chosen as 3000 Å and 2.480 m in an effort to recover as much as possible the and near-infrared fluxes that were missed by our photometry. Adding a conservative uncertainty, , to the bolometric magnitudes, we estimate the bolometric magnitude at maximum to be on May 11 (JD 2 45 3502.1). We plot in Figure 2 the evolution of the absolute magnitude in () for SN 2005bf since our assumed date of explosion and compare it with other SNe Ib/c, namely, SN 1999ex (Stritzinger et al.,, 2002), SN 1994I (Richmond et al.,, 1996), SN 1984L (Tsvetkov, 1987; Schlegel et al.,, 1989) and SN 1985F (Tsvetkov, 1986). The maximum bolometric magnitude (inset in Figure 2) of SN 2005bf is brighter than the average value for type Ib/c SNe, even though the time of maximum was significantly later. Furthermore, the colour at maximum indicates SN 2005bf to be marginally bluer.
The rise time depends on the mass and the explosion energy (e.g. Nomoto et al.,, 2004). The slow rise suggests a relatively low ratio of explosion energy to ejected mass. A detailed modelling of the light curve and the spectra are beyond the scope of this work and will be reported in a later paper (Tominaga et al.,, 2005). However, preliminary calculations indicate a tentative value for the explosion energy of erg, and an ejected mass of . The brightness of the peak and its late occurrence suggest a relatively large production of 56Ni (), which points to a rather massive progenitor () (Tominaga et al.,, 2005).
3 The Spectra
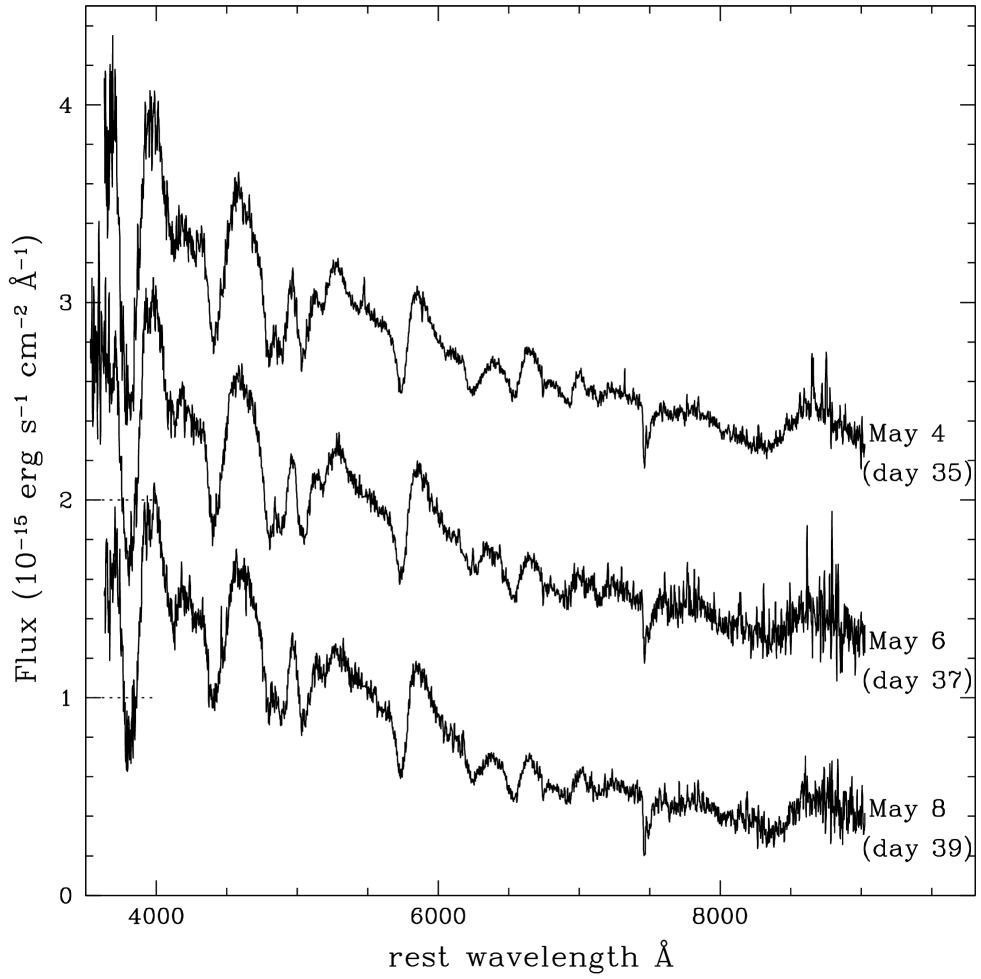
Spectra of SN 2005bf were obtained at a resolution of 8 Å in the wavelength range 3600–7200 Å and 5200–9200 Å on May 4.65, 6.62, 8.63 (UT) (marked by vertical lines in Fig. 1). All observations were made using a slit of 2.2 arcsec width and aligned along the parallactic angle. Spectrophotometric standards HZ 44 and BD +330 2642 observed on 2005 May 4 were used to correct the supernova spectra for the response curves of the instrument and bring them to a flux scale. The spectra in the two different regions were combined, scaled to a weighted mean, to give the final spectrum on a relative flux scale, which were then brought to an absolute scale using the magnitudes. The flux calibrated spectra, corrected for the redshift of the host galaxy are shown in Figure 3. The three spectra presented here are all near optical maximum, but are very similar to those of SN 1984L (Harkness et al.,, 1987; Matheson et al.,, 2001) about one week past maximum and SN 1999ex (Hamuy et al.,, 2002) 4 days past maximum. If the phase since the date of explosion is considered, then the spectra of SN 2005bf correspond to about 35-39 days after explosion, while the corresponding phase is about 20-25 days for SN 1984L and SN 1999ex.
The spectra show prominent and broad P Cygni lines of He I, Fe II, and Ca II. The He I 5876 P Cygni feature is strong, whose identification is supported by the presence of clear He I 6678 and 7065, although Na I D could also contribute. He I 7281 may also exist. However, it should be noted that this feature is affected by the telluric H2O absorption, and our spectra are not corrected for the telluric features. The velocities corresponding to the absorption minima of the relatively weak He I 6678, 7065, and 7281 (if real) have average velocities of 6500 km s-1, lower than that of He I 5876 which is 7300 km s-1. The very strong P Cygni feature between 3700 Å and 4100 Å and the very broad one between 8000 Å and 9000 Å are obviously Ca II H&K and the near-infrared triplet, respectively, with velocities 10000 km s-1, indicating that these lines have large optical depths. Between 4000 Å and 5500 Å the spectra are dominated by Fe II multiplets, whose individual identifications are difficult due to the large intrinsic number of Fe II optical transitions and strong line-blending in the fast-moving SN atmosphere. Nevertheless, we identify Fe II multiplet 27 (4233), 42 (4924, 5018, and 5169), and 49 (5317) with velocities between 7500 km s-1 and 8000 km s-1. The strong 4570Åfeature is a complex blend of several lines of Fe II multiplets 37 and 38, mainly 4629, 4584, 4549, and 4520. The absorption velocity, calculated with respect to 4520, a strong feature in both multiplets, is consistent with other Fe II lines. The identity of the P Cygni line between 6200 Å and 6500 Å is controversial. This feature, if identified as H, corresponds to a velocity as high as 15000 km s-1. If, instead, identified as Si II 6355, the measured velocity drops to km s-1, which is significantly lower than all other lines. It may be noted that the uncertainty of our measurements varies from line to line and from spectrum to spectrum and can be as large as km s-1, a result of the low S/N ratio, potential weak lines, and other pollution around the line absorption minima.
To further establish line identifications, we compute synthetic spectra using the fast, parameterized supernova spectrum-synthesis code, SYNOW (see Branch et al.,, 2002, and references therein), and show the fit to the spectrum of May 4 in Figure 4. We assume a power law for the radial dependance of line optical depths. The photospheric velocity, , is assumed to be traced by the absorption minima of weak lines. We first assume 8000 km s-1 (lower thick solid line), the value that matches weak Fe II lines. As expected, Fe II and Ca II lines are well reproduced, while He I 6678 and 7065 absorptions are a bit bluer than the observed. The observed He I 6678, 7065, and 7281 (if real) are also stronger than in the model. This suggests that non-thermal excitation, which is not included in SYNOW, is important for He I. The 6240 Å absorption minimum is reproduced by introducing a high-velocity H with a lower cut-velocity of 15,000 km s-1 (see also Wang & Baade, 2005). The narrow absorption and flat-topped emission of the synthetic H profile are consequences of the artifical optical-depth discontinuity of a detached line. Identification of this feature with Si II instead of H produces too blue an absorption minimum at 6200 Å (dotted line, inset in Fig. 4). An alternative identification of the feature is with Ne I 6402 (Branch, 2003). A marginally discernible dip at 4630 Å in the Fe II peak may, if real, be explained by high-velocity H (marked by arrows in Fig. 4). Hydrogen lines have been suggested for other Ib SNe (e.g. Deng et al.,, 2000; Branch, 2003; Wheeler et al.,, 1994).
We also computed a synthetic spectrum with 6500 km s-1 (upper thick solid line). This spectrum reproduces the positions of He I absorption minima, but Fe II absorptions are too red. As a possible solution, we tentatively introduce a lower cut-velocity of 8000 km s-1 for Fe II. One can assume Fe III dominates over Fe II below that velocity although Fe III is actually not included in our spectrum synthesis. With such a low , Si II 6355 seemingly matches the P Cygni feature between 6200 Å and 6500 Å better than the high- case. Calculations of realistic spatial structures of ionization and excitation above the photosphere are needed to correctly identify this feature and to determine the photospheric velocity, which is beyond the ability of SYNOW and the scope of this paper.
4 Conclusions
The light curve and spectra of SN 2005bf around maximum are presented. The light curves indicate that the maximum occurred nearly 40 days after the date of explosion. At maximum, SN 2005bf was brighter and bluer than other SNe Ib/c. The maximum phase was broad and the decline rates slow, and may be compared with the core collapse models of hydrogen-less cores. Preliminary calculations suggest a core mass larger than the Type Ib model suggested for SN1984L (Tominaga et al.,, 2005). The slow rise to the maximum and the brighter peak bolometric luminosity indicate that most of 56Ni was buried in a relatively low velocity region in the very massive ejecta (Hachisu et al.,, 1991), although a small part of 56Ni may be mixed out (Tominaga et al.,, 2005). The spectra of SN 2005bf around maximum are very similar to those of the Type Ib SNe 1999ex and 1984L about 25-35 days after explosion with prominent He I, Fe II, Ca II H&K and the near-IR triplet P Cygni lines present. Relatively weak H and very weak H may also exist, blueshifted by km s-1. We suggest that SN 2005bf was the explosion of a massive He star, possibly with a trace of hydrogen envelope.
References
- Branch (2003) Branch, D. 2003, in Proc. IAU Symp. 212, Eds. by K. van der Hucht, A. Herrero, and C. Esteban. San Francisco: Astronomical Society of the Pacific, p. 346
- Branch et al., (2002) Branch, D., Benetti, S., Kasen, D., Baron, E., Jeffery, D.J., Hatano, K., Stathakis, R.A., Filippenko, A.V., et al. 2002, ApJ, 566, 1005
- Bessell et al., (1998) Bessell, M. S., Castelli, F., Plez, B., 1998, A&A, 333, 231
- Deng et al., (2000) Deng, J. S., Qiu, Y. L., Hu, J. Y., Hatano, K., Branch, D. 2000, ApJ, 540, 452
- Hachisu et al., (1991) Hachisu, I., Matsuda, T., Nomoto, K., Shigeyama, T., 1991, ApJ, 368, 27
- Hamuy et al., (2005) Hamuy, M., Contreras, C., Gonzalez, S., Krzeminski, W. 2005, IAUC 8520
- Hamuy et al., (2002) Hamuy, M., Maza, J., Pinto, P. A.; Phillips, M. M., Suntzeff, N. B., Blum, R. D., Olsen, K. A. G., Pinfield, D. J., et al. 2002, AJ, 124, 417
- Harkness et al., (1987) Harkness, R. P., Wheeler, J. C., Margon, B., Downes, R. A., Kirshner, R. P., Uomoto, A., Barker, E. S., Cochran, A. L., et al. 1987, ApJ, 317, 355
- Richmond et al., (1996) Richmond, M. W., van Dyk, S. D., Ho, W., Peng, C. Y., Paik, Y., Treffers, R. R., Filippenko, A. V., Bustamante-Donas, J., et al. 1996, AJ, 111, 327
- Matheson et al., (2001) Matheson, T., Filippenko, A. V., Li, W., Leonard, D. C., Shields, J. C. 2001 AJ, 121, 1648
- Mazzali et al., (2003) Mazzali, P. A., Deng, J., Tominaga, N., Maeda, K., Nomoto, K., Matheson, T., Kawabata, K. S., Stanek, K. Z., Garnavich, P. M. 2003, ApJ, 599, L95
- Modjaz et al., (2005) Modjaz, M., Kirshner, R., Challis, P., Matheson, T., Landt, H. 2005, IAUC 8509
- Modjaz, Kirshner & Chalis (2005) Modjaz, M.; Kirshner, R.; Challis, P. 2005, IAUC 8522
- Monrad (2005) Monard, L. A. G. 2005, IAUC 8507
- Moore & Li (2005) Moore, M., Li, W. 2005, IAUC 8507
- Morell et al., (2005) Morrell, N., Hamuy, M., Folatelli, G., Contreras, C. 2005, IAUC 8509
- Nomoto et al., (1994) Nomoto, K., Yamaoka, H., Pols, O.R., van den Heuvel, E.P.J., Iwamoto, K., Kumakai, S., Shigeyama, T., 1994, Nature, 371, 227
- Nomoto et al., (2004) Nomoto, K., Maeda, K., Mazzali, P. A., Umeda, H., Deng, J., & Iwamoto, K. 2004, in “Stellar Collapse” (Astrophysics and Space Science) ed. C. L. Fryer (Dordrecht: Kluwer), 277 (astro-ph/0308136)
- Schlegel et al., (1989) Schlegel, Eric M., Kirshner, Robert P., 1989, AJ, 98, 577
- Schlegel, Finkbeiner & Davis (1998) Schlegel, D. J., Finkbeiner, D. P., Davis, M. 1998 ApJ, 500, 525
- Shigeyama et al., (1990) Shigeyama, T., Nomoto, K., Tsujimoto, T., Hashimoto, M-A. 1990, ApJL, 361, 23
- Stritzinger et al., (2002) Stritzinger, M., Hamuy, M., Suntzeff, N. B., Smith, R. C., Phillips, M. M., Maza, J., Strolger, L.-G., Antezana, R. et al. 2002, AJ, 124, 2100
- Tominaga et al., (2005) Tominaga, N., et al. 2005, ApJL (submitted)
- Tsvetkov (1986) Tsvetkov, D. Y. 1986, SvAL, 12, 328
- Tsvetkov (1987) Tsvetkov, D. Y. 1987, SvAL, 13, 376
- Wang & Baade (2005) Wang, L., Baade, D. 2005, IAUC 8521
- Wheeler & Harkness (1990) Wheeler, J.C., Harkness, R.P. 1990, Rep. Prog. Phys., 53, 1467
- Wheeler et al., (1994) Wheeler, J. C.; Harkness, R. P.; Clocchiatti, A.; Benetti, S.; Brotherton, M. S.; Depoy, D. L.; Elias, J. 1994, ApJ, 436, L135
- Woosley, Langer & Weaver (1993) Woosley, S.E., Langer, N., Weaver, T.A. 1993, ApJ, 411, 823