Identifying silicate-absorbed ULIRGs at z1–2 in the Bootes Field using Spitzer/IRS
Abstract
Using the 16m peakup imager on the Infrared Spectrograph (IRS111The IRS was a collaborative venture between Cornell University and Ball Aerospace Corporation funded by NASA through the Jet Propulsion Laboratory and the Ames Research Center.) on Spitzer, we present a serendipitous survey of 0.0392 deg2 within the area of the NOAO Deep Wide Field Survey in Bootes. Combining our results with the available Multiband Imaging Photometer for Spitzer (MIPS) 24m survey of this area, we produce a catalog of 150 16m sources brighter than 0.18 mJy (3) for which we derive measures or limits on the 16/24m colors. Such colors are especially useful in determining redshifts for sources whose mid infrared spectra contain strong emission or absorption features that characterize these colors as a function of redshift. We find that the 9.7m silicate absorption feature in Ultraluminous Infrared Galaxies (ULIRGs) results in sources brighter at 16m than at 24m at z 1–1.8 by at least 20. With a threshold flux ratio of 1.2, restricting our analysis to detections at 16m, and using a limit on 24m non-detections, the number of silicate-absorbed ULIRG candidates is 36. This defines a strong upper limit of 920 sources deg-2, on the population of silicate-absorbed ULIRGs at z 1–1.8. This source count is about half of the total number of sources predicted at z 1–2 by various phenomenological models. We note that the high 16/24m colors measured cannot be reproduced by any of the mid-IR spectral energy distributions assumed by these models, which points to the strong limitations currently affecting our phenomenological and theoretical understanding of infrared galaxy evolution.
1 Introduction
It is widely accepted that in order to fully understand the observed increase in star formation activity at high redshifts (e.g. Madau et al., 1998), a more comprehensive understanding of the ultraluminous infrared population (ULIRGs) will play a key role. ULIRGs, galaxies with infrared luminosity L L☉, are rare in the local universe and comprise only of the IRAS Bright Galaxy Survey (Soifer et al., 1987). Yet, at high redshifts of z , ULIRGs may account for the bulk of all star-formation activity and dominate the far-infrared background (e.g. Blain et al., 2002). The interstellar dust formed in starburst galaxies absorbs the optical and UV emission and re-radiates in the mid and far infrared. These galaxies enshrouded in dust are extremely difficult to directly observe in the optical and near infrared regime. A number of theoretical groups, Lagache et al. (e.g. 2004); Chary et al. (e.g. 2004); Pearson (e.g. 2005); Gruppioni et al. (e.g. 2005) have developed galaxy evolution models that constrain the evolution of the infrared luminosity function with redshift. These semi-empirical models predict the comoving luminosity density distribution and mid-infrared source counts as a function of redshift.
The complexities of the ULIRG spectra, the possibility that most could contain contributions from an active galactic nucleus (AGN) and a massive starburst (Genzel et al., 1998), challenges the interpretations of the mid-IR surveys especially prior to Spitzer’s advent (Elbaz et al., 2002; Fadda et al., 2002). The superb sensitivity of the IRS on Spitzer (Houck et al., 2004) showed the diversity of the mid-IR spectra of ULIRGs in the local universe (Armus et al., 2004; Spoon et al., 2004). Moreover, the imaging capability of IRS at 16 and 22 m to levels below 0.1 mJy in addition to the broadband filters of the Spitzer cameras have allowed the use of mid-IR colors as tracers of specific spectral features (see Charmandaris et al., 2004b).
One such mid-IR continuum feature is the 9.7m silicate absorption band. Since it is not prominent in normal galaxies, quasars or unobscured starbursts, it can be used as an indicator of high columns of cold dust obscuring the nuclear emission from dust rich IR luminous systems. The presence of this feature has been clearly seen in the local universe from the ground (e.g. Dudley, 1999) as well as in space with the Infrared Space Observatory (ISO) (Genzel et al., 1998; Laurent et al., 2000) and Spitzer (Armus et al., 2004; Spoon et al., 2004). It has also been clearly detected in sources at higher redshifts such as at z1 (Higdon et al., 2004) and at z2 (Houck et al., 2005).
Mid-IR color anomalies due to this feature can be used as an approximate redshift indicator of a high redshift IR luminous source, if there is a large line of sight extinction to the nucleus. This is important because spectroscopic redshifts are not readily available for these distant and optically faint ULIRGs. Furthermore, at z1–2, determining redshifts is challenging due to the so-called “redshift desert” as strong UV/optical emission lines are not accessible from the ground. The variation of mid-IR colors in Spitzer data due to the presence of the 9.7m absorption feature was proposed by Charmandaris et al. (2004b) as a potential redshift indicator for SCUBA sources. Subsequently Takagi & Pearson (2005) presented a detailed analysis on the effects of the 9.7m silicate absorption feature on mid-IR colors measured by Spitzer and ASTRO-F broadband filters as a function of redshift. They predict a population of galaxies which they call “Si-break” galaxies. These are galaxies at z1.5, which due to strong 9.7m absorption are not detected (or are extremely faint) by the 24m filter of the MIPS((Rieke et al., 2004)), even though they are more prominent at other mid-/far-IR wavelengths. Given the sensitivity of the Spitzer instruments, as well as the expected SEDs and redshift of these sources, these galaxies would have to be dust enshrouded galaxies with LIR 1012L☉ i.e. ULIRGs.
In this paper, we compare the 24m observations of the 9 deg2 NOAO Deep Wide-Field Survey (NDWFS; Jannuzi & Dey, 1999) in Bootes using Spitzer/MIPS, to the 16 m peak-up imaging of Spitzer/IRS obtained in parallel during deep spectroscopic observations in the same area. Our goal is to identify silicate-absorbed ULIRGs in the Bootes field and compare it to theoretical predictions of total number of sources at z 1–2. This is the largest area to-date for which deep sub-mJy level imaging at both 24m and 16m is available.
We present our observations in 2, results in 3, and discuss the implications of our findings in 4.
2 Observations and Data Reduction
We observed 57 positions in the Bootes field during two different periods using the IRS on Spitzer (Houck et al., 2004). Note that the peak-up images utilized for the present analysis were obtained in parallel as a “bonus” during deep IRS staring spectroscopic observations ( 7–35 m) of select sources in the Bootes field (Houck et al., 2005). When the IRS spectrum of a science target between 7–15m was obtained using the Short Low module, images of two different parts of the sky one with the blue peak-up camera at 16m (13.3–18.7 m) and another with the red peak-up camera at 22m (18.5–26 m) were acquired in parallel.
The total field of view of a blue peak-up image in both nod positions is 5055 pixels. Since the pixel size of the IRS short-low (SL) module is , the field of view is 2.475 arcmin2. The total area observed is 0.0392 deg2 which is 230 times smaller than the total area of the Bootes survey imaged at 24m with MIPS. The observations were obtained between August 27 and September 2, 2004 as well as between November 11 and 17, 2004, with exposure times of 240sec, resulting in a median 1 depth of 0.06mJy at 16m.
The IRS 16m images were processed using the standard IRS pipeline (version 11.0) at the Spitzer Science Center (see chapter 7 of Spitzer Observing Manual222http://ssc.spitzer.caltech.edu/documents/som/). The 2D images were converted from slopes after linearization correction, subtraction of darks, and cosmic ray removal. The resulting images were divided by the photometric flat, and a world coordinate system was inserted into them using the reconstructed pointing of the telescope. The astrometric accuracy of our images is better than 1 and the FWHM of the point spread function (PSF) is 3.5 at 16m. The peak-up images of each of the two nod position were median averaged and the final images of the two nods were subtracted from each other.This removed the background emission to first order and facilitated the source identification, which was performed by eye. 1 in sources detected in both nod positions was lower by a factor of .
To calculate the exact location of the source, a Gaussian fit was used to obtain its centroid. Aperture photometry was performed in the location of the centroid and the flux was measured within an aperture radius of 3 pixels. A median sky was subtracted from an annulus of inner and outer radii of 8 pixels and 17 pixels respectively. Final conversion from counts (e-/s) to mJy was done by dividing by 729, a factor determined during the flux calibration of the peak-up arrays after observing a variety of stars for which high quality spectral templates were available. We estimate that our photometry is accurate to a 6% level for sources .
3 Results
The 16m sources in the Bootes field are cataloged in Table 1. We detect a total of 150 sources at 16m over the 0.0392 deg2 region in the Bootes field with a flux greater than 3 of 0.18 mJy. Of these 150 sources, 137 have optical counterparts available from the NOAO survey (within 2″) and 80 have 24m counterparts (within 2.5″).
| ID | Spitzer NameaaSST16 source name derives from discovery with the IRS PU 16m images; coordinates listed are in J2000; 16m positions with typical 3 uncertainty of 1.2″; sources with an optical counterpart will also appear in NDWFS catalogs with prefix NDWFS and the optical source position; optical magnitudes are Mag-Auto from NDWFS Data Release Three, available at http://www.noao.edu/noao/noaodeep/); sources with a MIPS 24 m counterpart will also appear in MIPS catalog. | f16μm | f24μmbbRatio of the 16m and 24m flux densities. Upper limit s for 24m sources are assumed to be 0.18 mJy. | |||||
|---|---|---|---|---|---|---|---|---|
| (mJy) | (mJy) | (mJy) | (mag) | (mag) | (mag) | |||
| 1 | SST16 J143413.49+332217.4 | 0.275 | 0.057 | 1.52 | 24.72 | 23.65 | ||
| 2 | SST16 J143408.45+332218.1 | 0.331 | 0.048 | 0.346 | 0.95 | 22.18 | 20.85 | 20.32 |
| 3 | SST16 J143411.11+332212.2 | 0.237 | 0.048 | 0.207 | 1.14 | 24.82 | 23.74 | 23.00 |
Note. — Table 1 is published in its entirety in the electronic edition. A portion is shown here for guidance regarding its form and content.
To better quantify the presence of silicate-absorbed ULIRGs at z1.5 in the Bootes field, as proposed by Takagi & Pearson (2005), we plot the distribution of sources as a function of the ratio of 16m to 24m flux in Figure 1. For a 0.3 mJy source, the uncertainty in the f16μm/f24μm ratio using error propagation is 0.3. Therefore, we restrict our analysis to the 67 16m sources brighter than 0.3 mJy (5). For sources that do not have 24m counterparts in the Bootes catalog, we manually inspected the location corresponding to the 16m sources and in several cases we were able to identify faint sources below the formal 0.18 mJy (3) limit of the catalog. For non-detections we compute a lower limit to the ratio by assuming a 3 limit of 0.18 mJy to the 24m flux. We find 30 matched and 18 unmatched sources that are brighter at 16m relative to 24m. Of these sources, 18 matched and 18 unmatched sources have f16μm/f24μm ratio greater than 1.2.
4 Discussion and Conclusion
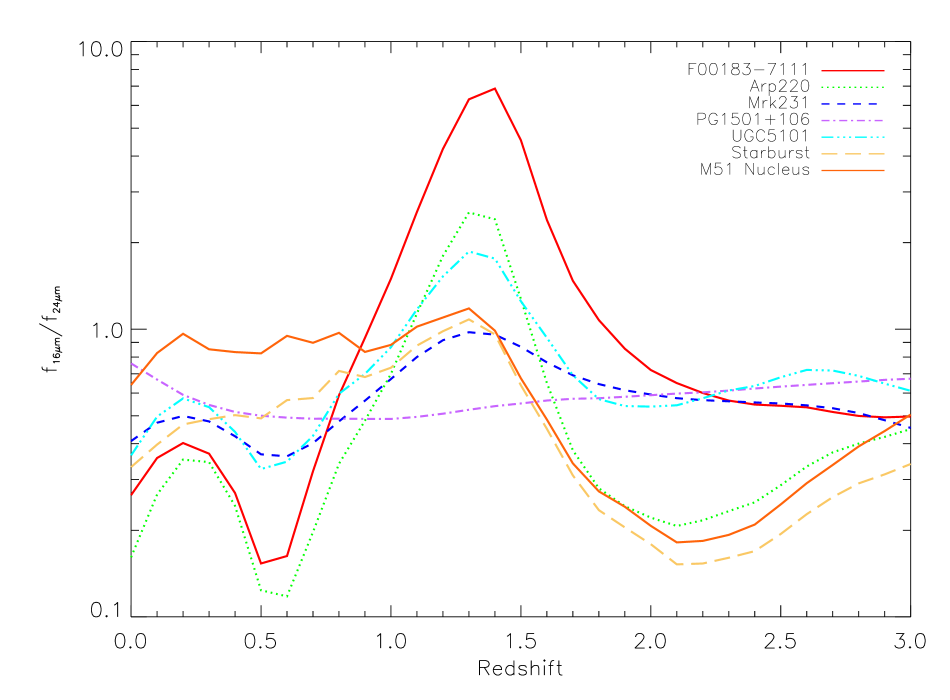
To examine in more detail the variation of the 16m to 24m color, following the approach of Charmandaris et al. (2004b), we plot in Figure 2 the ratio of 16m flux to the 24m flux based on Spitzer IRS spectra of ULIRGs with strong or moderate silicate absorption. We also include in the plot an average starburst mid-IR SED as well as an AGN and a quasar. These galaxies were selected after careful examination of over 120 mid-IR spectra in the 5–38m range obtained as part of the IRS guaranteed time extragalactic program. This sample provides the best coverage of parameter space for the integrated mid-IR SEDs of galaxies available to date. We find that the 9.7m silicate absorption feature clearly causes a peak in the 16m to 24m flux ratio, when the emitting source is at z1.5 because it is in the center of the 24m band. From Figure 2, when the depth of the silicate absorption increases, the peak of the ratio and the width of the redshift range over which the emitting galaxy can be located also increase. Other mid-IR emission features such as the strong 7.7m feature, attributed to the C–C stretch mode of polycyclic aromatic hydrocarbons (PAH) seen in many starburst galaxies (e.g. Förster Schreiber et al., 2003; Brandl et al., 2005), are too weak to push this ratio above 1.2.
Conservatively, we set the threshold for ULIRGs with strong 9.7m silicate absorption at f16μm/f 1.2. Therefore, restricting our analysis to 16m detections (f 0.3 mJy), we identify 18 sources with 24m counterparts and 18 with no counterparts as silicate-absorbed ULIRGs in 0.0392 deg2, i.e. 920 sources deg-2. Based on our available mid-IR SEDs and Figure 2, this would set an upper limit to the possible redshift range of these galaxies of z 1–1.8. Our identification does not include ULIRGs with warmer SEDs such as Mrk1014 or Mrk231 (Armus et al., 2004; Weedman et al., 2005). The above number places a strong upper limit on the population of silicate-absorbed ULIRGs at the redshift epoch of z 1–1.8.
Takagi & Pearson (2005) predict 900 silicate-break galaxies deg-2 for their bright end model and 1500 deg-2 for their burst model. Their prediction is based on f16μm/f0.8 and includes models with deep silicate absorption. We chose a higher threshold of 1.2 to minimize contamination. As is evident from Figure 2, a threshold of 0.8 would select starburst galaxies as well as prototypical AGNs like Mrk 231. From Figure 1, we find 1450 deg-2 above the Takagi & Pearson (2005) threshold of 0.8. This puts a strict upper limit on the population of silicate-break galaxies.
How do our results compare with other theoretical predictions? Given that we are interested in sources with f16μm/f24μm1.2 and that most of the model predictions in the literature are for the 24m surveys we focus on predictions to the total number of sources with f0.2 mJy in the redshift range of z 1–2. According to Lagache et al. (2004) these are 1732 deg-2 while Gruppioni et al. (2005) predict 1828 deg-2. The “burst” and “bright end” models of Pearson (2005) result in 1644 to 1550 deg-2 and Chary et al. (2004) predict 1663 deg-2. Interestingly, the ensemble of the mid-IR SEDs which are being used by the theoretical models to fit the number counts and produce the above mentioned predictions do not include SEDs which have an extreme 9.7m band such as IRASF00183-7111.
Yet, our study finds that heavily absorbed sources such as IRASF00183-7111 are sufficient to account for more than half of all the sources at z 1–2 predicted by these various models. Examining the 10 ULIRGs in the Bright Galaxy Sample, Armus et al. (2005) find that half of them would exhibit a ratio f16μm/f. In this context our upper limit of 920 ULIRGs with strong silicate absorption at z1–1.8 is consistent with what one would expect based on the ULIRGs in the local universe. The theoretical models currently available cannot make a direct prediction on the number of these types of galaxies at high redshift since they are based on observations of only a handful of mid-IR SEDs and the wealth of Spitzer/IRS spectra which clearly demostrate the diversity of the mid-IR features, are only now becoming available in the literature. Interestingly, Lagache et al. (2004) show that small variations in the shape of the PAH emission features of the earlier work of Lagache et al. (2003) were necessary to explain the increase in the 24m number counts detected by the Spitzer deep surveys. Similarly, one would expect that taking into account the new mid-IR SEDs of ULIRGs may have a significant influence on the theoretical predictions of the type of infrared luminous galaxies contributing to the observed number counts.
It is clear that there are some caveats on the above mentioned approach as a method for identifying sources with strong silicate absorption at z 1–2. Inspection of Table 1, suggests that all our sources, with the exception of source #33 and #41, have an I-mag greater than 19 and an R-mag greater than 20. If any of these sources were stars, their I and R magnitudes are inconsistent with what we find. For instance, if we consider a main sequence star whose 16m flux is 0.3 mJy, its V-band magnitude varies from 11.2 (type B0,1V) to 17.5 (type M,late V) (see Wainscoat et al., 1992). This corresponds to a range in R band magnitude of 11.3-15.7. Clearly, the R-mag of all our sources is 4–5 mags fainter. Thus it is highly unlikely that we are observing faint main sequence stars. Red giants, embedded protostars or asteroids are also improbable contaminants because of the high Galactic and high Ecliptic latitute of the Bootes field (b67 and l45 respectively) as well as the multiple epochs of the MIPS24 catalogue.
Since there are no direct spectroscopic observations available for at least a fraction of the galaxies of our sample, we cannot cross-calibrate the method using broadband colors and the exact redshift of the source. However, Teplitz et al. (2005) performed a similar study around Hubble Deep Field North, using an area 4 times smaller than the present study but with considerably deeper imaging at 24 m and with spectroscopic redshifts for most of their sources. Their results reveal that 10 of their 149 sources have known redshift and f16μm/f, half of which are at z1. 20 sources with ratio greater than 1.2 have unknown redshifts. Assuming that the mid-IR and optical redshift cross identifications are accurate, these could be considered as an approximate estimate for the uncertainties. Even though we have no indication that we are incomplete in the mid-IR SED sampling, there is always a possibility that SEDs which are not taken into account here, are affecting our estimates. For example, it is conceivable that a population of quiescent dwarf galaxies with low optical luminosity consistent with the NOAO R-mag 20 located at z0.2–0.5 and mid-IR spectra similar to those of the spiral nucleus of M51 (see Teplitz et al., 2005) could produce such a ratio. It is also possible that some complications may arise in our sample if some of our sources are unresolved interacting galaxies having components with significantly different mid-IR spectra (see Charmandaris et al., 2004a).
Irrespective of possible contamination contributing to an overestimate of our observed counts, our upper limit illustrates the importance of silicate-absorbed ULIRGs as a substantial fraction of the ULIRG population at z 1–2. The faint brightness level of these galaxies (f0.5mJy) makes the direct detection of the mid-IR spectral shape for a substantial sample of them rather challenging even for Spitzer/IRS. As a result, infrared broadband imaging and accurate SED fitting techniques using local analogues may be the only method to provide constraints to the ambiguities in the theoretical predictions to the redshift distribution of the sources contributing to the IR number counter. The recent addition of efficient 16m imaging with Spitzer as well as the upcoming ASTRO-F mission will clearly play a critical role towards this goal.
References
- Armus et al. (2004) Armus, L., et al. 2004, ApJS, 154, 178
- Armus et al. (2005) Armus, L., et al. 2005, ApJ, (in preparation)
- Blain et al. (2002) Blain, A. W., Smail, I., Ivison, R. J., Kneib, J.-P., & Frayer, D. T. 2002, Phys. Rep., 369, 111
- Brandl et al. (2005) Brandl, B.R., et al. 2005, ApJ, (submitted)
- Charmandaris et al. (2004a) Charmandaris, V., Le Floc’h, E., & Mirabel, I. F. 2004, ApJ, 600, L15
- Charmandaris et al. (2004b) Charmandaris, V., et al. 2004, ApJS, 154, 142
- Chary et al. (2004) Chary, R., Casertano, S., Dickinson, M. E., et al. 2004,ApJS, 154, 80
- Dudley (1999) Dudley, C. C. 1999, MNRAS, 307, 553
- Elbaz et al. (2002) Elbaz, D., Cesarsky, C. J., Chanial, P., Aussel, H., Franceschini, A., Fadda, D., & Chary, R. R. 2002, A&A, 384, 848
- Fadda et al. (2002) Fadda, D., Flores, H., Hasinger, G., Franceschini, A., Altieri, B., Cesarsky, C. J., Elbaz, D., & Ferrando, P. 2002, A&A, 383, 838
- Förster Schreiber et al. (2003) Förster Schreiber, N. M., Sauvage, M., Charmandaris, V., Laurent, O., Gallais, P., Mirabel, I. F., & Vigroux, L. 2003, A&A, 399, 833
- Genzel et al. (1998) Genzel, R. et al. 1998, ApJ, 498, 579
- Gruppioni et al. (2005) Gruppioni, C., Pozzi, F., Lari, C., Oliver, S. & Rodighiero, G., 2005, ApJ, 618, 9
- Hao et al. (2005) Hao, L. et al. 2005, ApJ, 625, 75
- Higdon et al. (2004) Higdon, S. J. U., et al. 2004, ApJS, 154, 174
- Houck et al. (2004) Houck, J. R., et al., 2004, ApJS, 154, 18
- Houck et al. (2005) Houck, J. R., et al., 2005, ApJ, 622, 105
- Jannuzi & Dey (1999) Jannuzi, B. T., & Dey, A. 1999, ASP Conf. Ser. 191: Photometric Redshifts and the Detection of High Redshift Galaxies, 191, 111
- Lagache et al. (2003) Lagache, G., Dole, H., & Puget, J.-L. 2003, MNRAS, 338, 55
- Lagache et al. (2004) Lagache, G. et al., 2004, ApJS, 154, 112
- Laurent et al. (2000) Laurent, O., Mirabel, I. F., Charmandaris, V., Gallais, P., Madden, S. C., Sauvage, M., Vigroux, L., & Cesarsky, C. 2000, A&A, 359, 887
- Madau et al. (1998) Madau, P., Pozzetti, L., & Dickinson, M. 1998, ApJ, 498, 106
- Pearson (2005) Pearson, C. 2005, MNRAS, 358, 1417
- Rieke et al. (2004) Rieke, G. H., et al. 2004, ApJS, 154, 25
- Soifer et al. (1987) Soifer, B. T., Sanders, D. B., Madore, B. F., Neugebauer, G., Danielson, G. E., Elias, J. H., Lonsdale, C. J., & Rice, W. L. 1987, ApJ, 320, 238
- Spoon et al. (2004) Spoon, H.W.W. et al. 2004, ApJS, 154, 184
- Takagi & Pearson (2005) Takagi, T. & Pearson, C.P., 2005, MNRAS, 257, 165
- Teplitz et al. (2005) Teplitz, H.I., Charmandaris, V., Chary, R., Colbert, J.W., Armus, L., Weedman, D., 2005, ApJ, (accepted, astro-ph/0507558)
- Wainscoat et al. (1992) Wainscoat, R. J., Cohen, M., Volk, K., Walker, H. J., & Schwartz, D. E. 1992, ApJS, 83, 111
- Weedman et al. (2005) Weedman, D., et al. 2005, ApJ, (accepted, astro-ph/0507423)

| ID | Spitzer NameaaSST16 source name derives from discovery with theIRS PU 16m images; coordinates listed are in J2000; 16m positions with typical 3 uncertainty of 1.2″; sources with an optical counterpart will also appear in NDWFS catalogs with prefix NDWFS and the optical source position; optical magnitudes are Mag-Auto from NDWFS Data Release Three, available at http://www.noao.edu/noao/noaodeep/); sources with a MIPS 24 m counterpart will also appear in MIPS catalog. | f16μm | f24μmbbRatio of the 16m and 24m flux densities. Upper limits for 24m sources are assumed to be 0.18 mJy. | |||||
|---|---|---|---|---|---|---|---|---|
| (mJy) | (mJy) | (mJy) | (mag) | (mag) | (mag) | |||
| 1 | SST16 J143413.49+332217.4 | 0.275 | 0.057 | 1.52 | 24.72 | 23.65 | ||
| 2 | SST16 J143408.45+332218.1 | 0.331 | 0.048 | 0.346 | 0.95 | 22.18 | 20.85 | 20.32 |
| 3 | SST16 J143411.11+332212.2 | 0.237 | 0.048 | 0.207 | 1.14 | 24.82 | 23.74 | 23.00 |
| 4 | SST16 J143411.37+332248.6 | 0.257 | 0.054 | 0.296 | 0.86 | 24.76 | 23.60 | 22.61 |
| 5 | SST16 J143410.56+332302.7 | 0.212 | 0.050 | 1.18 | 24.81 | |||
| 6 | SST16 J143411.18+332217.0 | 0.180 | 0.048 | 1.00 | ||||
| 7 | SST16 J142820.50+353042.8 | 0.203 | 0.052 | 0.208 | 0.97 | 22.82 | ||
| 8 | SST16 J142821.18+353137.1 | 0.166 | 0.054 | 0.92 | 25.49 | 23.32 | 22.00 | |
| 9 | SST16 J143212.04+351234.2 | 0.413 | 0.051 | 0.343 | 1.20 | 22.99 | 21.50 | 21.02 |
| 10 | SST16 J143210.86+351339.4 | 0.251 | 0.053 | 1.39 | 23.36 | 22.44 | 22.07 | |
| 11 | SST16 J143030.36+343642.2 | 0.777 | 0.064 | 0.493 | 1.57 | 22.60 | 20.83 | 19.89 |
| 12 | SST16 J143030.11+343704.3 | 0.220 | 0.061 | 1.22 | 25.14 | 23.70 | 22.94 | |
| 13 | SST16 J143028.50+343713.9 | 0.169 | 0.047 | 0.770 | 0.22 | 24.41 | 22.10 | 21.31 |
| 14 | SST16 J143024.71+343645.6 | 0.242 | 0.054 | 1.34 | 26.79 | 23.76 | 22.70 | |
| 15 | SST16 J143029.44+343744.0 | 0.210 | 0.054 | 0.220 | 0.95 | 24.73 | 23.26 | |
| 16 | SST16 J142743.41+342717.1 | 0.352 | 0.051 | 1.95 | 23.23 | 21.07 | 20.34 | |
| 17 | SST16 J142742.61+342639.8 | 0.181 | 0.049 | 0.569 | 0.31 | 25.09 | 23.64 | |
| 18 | SST16 J142745.42+342654.2 | 0.142 | 0.044 | 0.79 | 22.88 | 21.45 | 20.88 | |
| 19 | SST16 J142748.11+342715.8 | 0.203 | 0.054 | 0.349 | 0.58 | 26.12 | 23.81 | 22.81 |
| 20 | SST16 J142745.28+342644.5 | 0.174 | 0.048 | 0.277 | 0.62 | 25.35 | 25.15 | 24.66 |
| 21 | SST16 J143109.78+343315.1 | 0.331 | 0.052 | 1.84 | 26.17 | 24.91 | 24.54 | |
| 22 | SST16 J143110.91+343325.0 | 0.210 | 0.051 | 1.16 | 24.44 | 22.39 | 21.64 | |
| 23 | SST16 J143107.75+343305.4 | 0.157 | 0.044 | 0.87 | 23.75 | 22.39 | 22.02 | |
| 24 | SST16 J142938.40+324348.0 | 0.955 | 0.074 | 5.31 | 22.95 | 20.56 | 19.78 | |
| 25 | SST16 J142936.66+324344.3 | 0.273 | 0.057 | 0.360 | 0.75 | 22.09 | 21.64 | 21.33 |
| 26 | SST16 J142936.96+324420.2 | 0.426 | 0.069 | 2.37 | 25.06 | 23.98 | 23.28 | |
| 27 | SST16 J142936.64+324414.0 | 0.374 | 0.064 | 2.07 | 26.12 | 24.78 | 23.85 | |
| 28 | SST16 J143726.45+341935.8 | 0.150 | 0.047 | 0.83 | 23.95 | 22.12 | 21.36 | |
| 29 | SST16 J143726.18+341946.3 | 0.286 | 0.050 | 1.523 | 0.18 | 25.13 | 22.80 | 21.96 |
| 30 | SST16 J143722.24+342005.5 | 0.336 | 0.057 | 0.561 | 0.59 | |||
| 31 | SST16 J143726.74+342034.7 | 0.594 | 0.053 | 0.562 | 1.05 | 22.75 | 20.93 | 20.25 |
| 32 | SST16 J143006.09+341412.3 | 0.361 | 0.057 | 2.00 | 25.72 | 24.29 | 23.34 | |
| 33 | SST16 J143003.10+341447.2 | 0.260 | 0.051 | 1.44 | 18.55 | 16.67 | 17.74 | |
| 34 | SST16 J143005.05+341410.2 | 0.176 | 0.054 | 0.257 | 0.68 | 25.57 | 24.48 | 23.36 |
| 35 | SST16 J143803.91+341458.3 | 0.655 | 0.059 | 3.63 | 25.00 | 22.58 | 21.38 | |
| 36 | SST16 J143808.17+341453.8 | 0.261 | 0.048 | 1.45 | 26.22 | 25.11 | 24.13 | |
| 37 | SST16 J143810.52+341500.1 | 0.186 | 0.056 | 0.225 | 0.82 | |||
| 38 | SST16 J143026.95+332006.1 | 0.228 | 0.052 | 0.473 | 0.48 | 26.68 | 25.55 | 24.30 |
| 39 | SST16 J143546.89+343312.4 | 0.289 | 0.057 | 0.188 | 1.53 | 25.14 | 23.80 | 22.53 |
| 40 | SST16 J143547.87+343320.5 | 0.241 | 0.055 | 1.34 | 24.52 | 23.23 | 22.51 | |
| 41 | SST16 J143543.08+343313.1 | 0.416 | 0.051 | 2.31 | 18.18 | 19.54 | 18.81 | |
| 42 | SST16 J143314.46+342452.9 | 0.901 | 0.065 | 0.301 | 2.99 | 22.99 | 21.03 | 20.04 |
| 43 | SST16 J143309.84+342453.1 | 0.188 | 0.049 | 0.567 | 0.33 | 24.08 | 23.43 | 22.90 |
| 44 | SST16 J143309.18+342445.2 | 0.181 | 0.053 | 1.00 | 21.92 | 20.65 | 20.04 | |
| 45 | SST16 J143312.72+342532.7 | 0.182 | 0.048 | 0.285 | 0.63 | 25.55 | 24.09 | 23.41 |
| 46 | SST16 J142745.76+345418.0 | 0.304 | 0.060 | 1.69 | 24.63 | 23.60 | ||
| 47 | SST16 J143644.28+351107.9 | 0.226 | 0.063 | 1.25 | 23.83 | 21.47 | 20.84 | |
| 48 | SST16 J143642.85+351102.4 | 0.241 | 0.053 | 0.218 | 1.10 | 22.80 | 20.24 | 19.61 |
| 49 | SST16 J143641.40+351144.9 | 0.309 | 0.065 | 1.71 | 25.09 | 23.41 | 22.54 | |
| 50 | SST16 J143640.08+351117.5 | 0.367 | 0.067 | 2.04 | 25.33 | 24.57 | 23.24 | |
| 51 | SST16 J143642.25+351057.5 | 0.290 | 0.052 | 1.149 | 0.25 | 24.31 | 22.14 | 21.41 |
| 52 | SST16 J143027.91+343453.0 | 0.487 | 0.071 | 2.70 | 24.48 | 22.60 | 22.13 | |
| 53 | SST16 J143027.55+343453.9 | 0.546 | 0.075 | 3.03 | 24.25 | 22.10 | 21.13 | |
| 54 | SST16 J143809.03+342111.5 | 0.282 | 0.058 | 0.222 | 1.27 | 25.07 | 24.70 | 23.92 |
| 55 | SST16 J143808.73+342043.0 | 0.211 | 0.058 | 1.17 | 25.42 | 24.45 | 23.46 | |
| 56 | SST16 J142649.81+333356.3 | 0.272 | 0.063 | 0.194 | 1.39 | 25.73 | 24.12 | 23.35 |
| 57 | SST16 J142646.81+333400.4 | 0.325 | 0.058 | 0.314 | 1.03 | 24.61 | 23.51 | 22.85 |
| 58 | SST16 J142649.10+333422.1 | 0.212 | 0.054 | 0.204 | 1.04 | 25.75 | 23.89 | 23.12 |
| 59 | SST16 J142645.41+333442.7 | 0.293 | 0.071 | 0.236 | 1.24 | 25.18 | 23.57 | |
| 60 | SST16 J142650.55+333454.8 | 0.245 | 0.057 | 0.274 | 0.89 | 22.62 | 20.91 | 20.46 |
| 61 | SST16 J143510.36+335158.8 | 0.305 | 0.056 | 0.265 | 1.14 | 24.59 | 23.27 | 22.45 |
| 62 | SST16 J143508.98+335237.7 | 0.237 | 0.055 | 0.253 | 0.93 | 23.79 | 21.69 | 21.01 |
| 63 | SST16 J143508.52+335241.8 | 0.267 | 0.060 | 0.337 | 0.79 | 26.32 | 24.14 | 22.95 |
| 64 | SST16 J143504.00+335215.0 | 0.796 | 0.063 | 4.42 | 22.63 | 20.53 | 19.87 | |
| 65 | SST16 J143506.65+335257.1 | 0.175 | 0.055 | 0.97 | 26.32 | 23.73 | 22.84 | |
| 66 | SST16 J142844.81+342936.7 | 0.423 | 0.074 | 2.35 | 23.40 | 22.30 | 21.27 | |
| 67 | SST16 J142828.48+354545.3 | 0.321 | 0.079 | 0.211 | 1.52 | 25.90 | 23.89 | 21.94 |
| 68 | SST16 J142826.47+354635.9 | 0.271 | 0.073 | 1.50 | ||||
| 69 | SST16 J142825.87+354636.1 | 0.249 | 0.071 | 0.215 | 1.15 | 24.67 | 21.81 | 20.33 |
| 70 | SST16 J142826.03+354548.3 | 0.206 | 0.066 | 0.454 | 0.45 | |||
| 71 | SST16 J142826.12+354636.0 | 0.324 | 0.063 | 0.304 | 1.06 | 21.82 | ||
| 72 | SST16 J142824.17+354709.6 | 0.305 | 0.076 | 1.69 | ||||
| 73 | SST16 J142823.35+354624.8 | 0.305 | 0.077 | 0.415 | 0.73 | 26.83 | 24.31 | 22.86 |
| 74 | SST16 J142607.37+351733.5 | 1.208 | 0.090 | 6.71 | 22.63 | 20.67 | 20.00 | |
| 75 | SST16 J142607.78+351653.7 | 0.602 | 0.079 | 0.270 | 2.22 | 23.18 | 20.84 | 20.13 |
| 76 | SST16 J142608.56+351757.6 | 0.502 | 0.071 | 0.224 | 2.23 | 24.87 | 23.78 | 22.89 |
| 77 | SST16 J143133.85+325922.6 | 0.369 | 0.068 | 0.457 | 0.80 | 25.47 | 23.51 | 22.38 |
| 78 | SST16 J143135.30+330015.4 | 0.289 | 0.067 | 0.550 | 0.52 | 25.09 | 24.20 | 23.21 |
| 79 | SST16 J143103.65+325619.5 | 0.501 | 0.080 | 0.183 | 2.73 | 22.77 | 20.95 | 20.02 |
| 80 | SST16 J143100.54+325647.9 | 0.454 | 0.066 | 2.52 | 24.51 | 22.55 | 22.00 | |
| 81 | SST16 J142645.17+325814.0 | 0.201 | 0.058 | 0.307 | 0.65 | 22.33 | 20.79 | 20.18 |
| 82 | SST16 J142646.22+325710.4 | 0.374 | 0.066 | 2.08 | 24.40 | 23.85 | 23.05 | |
| 83 | SST16 J142643.98+325702.9 | 0.332 | 0.065 | 1.84 | 25.62 | 23.99 | 23.02 | |
| 84 | SST16 J143516.07+330213.8 | 0.344 | 0.067 | 1.91 | 23.24 | 21.22 | 20.50 | |
| 85 | SST16 J143517.61+330208.4 | 0.468 | 0.069 | 2.60 | 24.19 | 22.37 | 21.22 | |
| 86 | SST16 J143517.91+330240.6 | 0.312 | 0.059 | 0.260 | 1.19 | 25.80 | 24.63 | 23.64 |
| 87 | SST16 J143520.32+330206.2 | 0.174 | 0.052 | 0.97 | 24.76 | |||
| 88 | SST16 J142632.88+332632.1 | 0.183 | 0.058 | 0.260 | 0.70 | 24.61 | 21.75 | 20.78 |
| 89 | SST16 J142634.49+332640.4 | 0.227 | 0.056 | 0.190 | 1.19 | 27.00 | 26.22 | 25.19 |
| 90 | SST16 J142636.19+332610.4 | 0.451 | 0.062 | 2.50 | 22.83 | 20.84 | 20.08 | |
| 91 | SST16 J143246.59+333038.1 | 0.245 | 0.064 | 1.36 | 24.31 | 22.61 | 21.56 | |
| 92 | SST16 J143248.82+333109.6 | 0.313 | 0.058 | 0.995 | 0.31 | 24.11 | 22.11 | 21.20 |
| 93 | SST16 J143246.96+333019.8 | 0.581 | 0.066 | 3.23 | 23.13 | 20.97 | 20.27 | |
| 94 | SST16 J143046.24+333837.8 | 0.387 | 0.069 | 2.15 | 24.03 | 21.93 | 21.01 | |
| 95 | SST16 J143050.44+333857.0 | 0.617 | 0.058 | 0.307 | 2.00 | 25.04 | 22.62 | 21.93 |
| 96 | SST16 J142913.17+333914.1 | 0.269 | 0.060 | 1.49 | 25.91 | 22.82 | 21.19 | |
| 97 | SST16 J142916.19+333834.1 | 0.391 | 0.057 | 0.384 | 1.01 | 21.38 | 20.62 | |
| 98 | SST16 J143422.00+334014.7 | 0.297 | 0.061 | 0.826 | 0.36 | |||
| 99 | SST16 J143421.95+334018.7 | 0.454 | 0.060 | 0.579 | 0.78 | 23.47 | 21.36 | 20.59 |
| 100 | SST16 J142816.38+334052.6 | 0.507 | 0.060 | 2.81 | 25.00 | 23.41 | 22.29 | |
| 101 | SST16 J143517.47+335952.8 | 0.255 | 0.051 | 0.297 | 0.85 | 25.63 | 24.55 | 24.33 |
| 102 | SST16 J143517.25+335857.3 | 0.272 | 0.059 | 0.237 | 1.14 | 25.01 | 23.91 | 23.10 |
| 103 | SST16 J143518.95+335924.0 | 0.482 | 0.063 | 0.410 | 1.17 | 23.41 | 21.21 | 20.63 |
| 104 | SST16 J143519.27+335859.4 | 0.244 | 0.075 | 0.428 | 0.57 | 25.47 | 24.14 | 23.36 |
| 105 | SST16 J143230.93+341812.3 | 0.283 | 0.062 | 0.426 | 0.66 | 25.17 | ||
| 106 | SST16 J143231.67+341755.1 | 0.247 | 0.062 | 1.37 | 25.33 | 23.40 | 22.33 | |
| 107 | SST16 J143234.27+341759.3 | 0.254 | 0.055 | 1.41 | 24.12 | 22.60 | 21.90 | |
| 108 | SST16 J142936.62+343547.2 | 0.255 | 0.054 | 1.42 | 23.81 | |||
| 109 | SST16 J142535.75+351336.6 | 0.203 | 0.061 | 1.12 | 26.08 | 23.79 | 22.34 | |
| 110 | SST16 J142640.12+351436.2 | 0.362 | 0.063 | 0.612 | 0.59 | 24.10 | 23.35 | 22.64 |
| 111 | SST16 J142641.75+351356.8 | 0.397 | 0.063 | 0.297 | 1.33 | 25.33 | 23.50 | 22.26 |
| 112 | SST16 J142645.33+351416.0 | 0.398 | 0.059 | 0.380 | 1.04 | 23.83 | 21.78 | 20.88 |
| 113 | SST16 J142844.43+352716.3 | 0.423 | 0.061 | 2.35 | 23.82 | 22.48 | 21.40 | |
| 114 | SST16 J142846.60+352701.9 | 0.411 | 0.057 | 0.502 | 0.81 | 26.77 | 24.50 | |
| 115 | SST16 J142846.31+352656.1 | 0.453 | 0.058 | 0.470 | 0.96 | 25.98 | 24.22 | 22.43 |
| 116 | SST16 J142849.45+352649.5 | 0.274 | 0.056 | 0.821 | 0.33 | 23.82 | 22.80 | 21.45 |
| 117 | SST16 J142844.80+352644.6 | 0.221 | 0.056 | 0.316 | 0.70 | 25.56 | 22.98 | 21.57 |
| 118 | SST16 J142921.96+321437.1 | 0.213 | 0.054 | 0.318 | 0.66 | |||
| 119 | SST16 J142920.52+352837.2 | 0.235 | 0.056 | 1.30 | 25.51 | 24.35 | 23.22 | |
| 120 | SST16 J143437.51+325837.8 | 0.183 | 0.053 | 1.01 | 24.98 | 22.51 | 21.33 | |
| 121 | SST16 J143438.66+325743.3 | 0.288 | 0.056 | 0.418 | 0.69 | 22.62 | 21.00 | 20.47 |
| 122 | SST16 J143435.53+325739.7 | 0.382 | 0.057 | 2.12 | 24.71 | 23.86 | 22.64 | |
| 123 | SST16 J142934.53+353055.4 | 0.392 | 0.056 | 2.18 | 26.08 | 24.27 | 22.51 | |
| 124 | SST16 J143306.58+331721.6 | 0.182 | 0.056 | 0.666 | 0.27 | 22.09 | 21.14 | 20.81 |
| 125 | SST16 J143310.70+331704.5 | 0.321 | 0.054 | 0.204 | 1.56 | 23.14 | 21.93 | 21.42 |
| 126 | SST16 J143311.95+331649.9 | 0.392 | 0.066 | 2.18 | 22.43 | 20.97 | 20.42 | |
| 127 | SST16 J142756.31+331646.1 | 0.837 | 0.069 | 4.65 | 22.95 | 21.10 | 20.30 | |
| 128 | SST16 J143454.29+354403.5 | 0.529 | 0.063 | 0.314 | 1.68 | |||
| 129 | SST16 J143456.49+354320.6 | 0.209 | 0.047 | 1.16 | 25.07 | 23.66 | 22.45 | |
| 130 | SST16 J143348.90+332213.5 | 0.272 | 0.052 | 1.51 | 25.17 | |||
| 131 | SST16 J143350.47+332111.3 | 0.423 | 0.060 | 2.35 | 22.86 | 20.65 | 19.92 | |
| 132 | SST16 J143346.77+332106.9 | 0.207 | 0.058 | 1.15 | 23.46 | 22.73 | 21.94 | |
| 133 | SST16 J142951.88+322127.5 | 0.189 | 0.062 | 0.249 | 0.76 | 26.53 | 25.54 | |
| 134 | SST16 J142956.05+322126.5 | 0.227 | 0.058 | 1.26 | 22.47 | 21.23 | 20.80 | |
| 135 | SST16 J142955.11+322046.1 | 0.383 | 0.060 | 0.338 | 1.13 | 24.41 | 21.80 | 21.06 |
| 136 | SST16 J143256.00+332947.0 | 0.273 | 0.063 | 1.51 | 24.41 | 23.77 | 23.02 | |
| 137 | SST16 J143300.25+332945.8 | 0.196 | 0.053 | 0.340 | 0.57 | 24.80 | 23.73 | 22.79 |
| 138 | SST16 J143301.79+332927.5 | 0.360 | 0.065 | 0.190 | 1.89 | 24.38 | 23.48 | 22.62 |
| 139 | SST16 J143257.77+332943.6 | 0.221 | 0.057 | 1.23 | 26.28 | 24.62 | 23.55 | |
| 140 | SST16 J143533.83+333718.9 | 0.296 | 0.059 | 0.520 | 0.56 | 25.35 | ||
| 141 | SST16 J143533.35+333656.1 | 0.249 | 0.064 | 0.753 | 0.33 | 26.11 | 24.46 | 23.56 |
| 142 | SST16 J143533.69+333632.4 | 0.296 | 0.059 | 0.300 | 0.98 | 25.13 | 24.50 | |
| 143 | SST16 J142950.93+334128.3 | 0.325 | 0.063 | 0.382 | 0.85 | 22.85 | 20.91 | 20.23 |
| 144 | SST16 J142952.67+334124.2 | 0.245 | 0.064 | 1.36 | 23.06 | 21.18 | 20.48 | |
| 145 | SST16 J142953.79+334105.6 | 0.627 | 0.063 | 0.366 | 1.71 | 23.86 | 21.03 | 20.02 |
| 146 | SST16 J143245.10+334420.4 | 0.461 | 0.061 | 0.187 | 2.46 | 23.35 | 21.27 | 20.52 |
| 147 | SST16 J143241.61+334411.6 | 0.308 | 0.059 | 1.71 | 26.51 | 24.30 | 22.88 | |
| 148 | SST16 J143641.92+350102.1 | 0.871 | 0.079 | 4.84 | ||||
| 149 | SST16 J143642.30+350153.3 | 0.278 | 0.057 | 1.54 | ||||
| 150 | SST16 J143640.05+350203.5 | 0.224 | 0.054 | 0.213 | 1.24 |