-
The orbital period of Nova V2540 Ophiuchi (2002)
Abstract: We present the results of 26 nights of CCD photometry of the nova V2540 Oph (2002) from 2003 and 2004. We find a period of 0.000006 d ( 0.0001 h) in the data. Since this period was present in the light curves taken in both years, with no apparent change in its value or amplitude, we interpret it as the orbital period of the nova binary system. The mass-period relation for cataclysmic variables yields a secondary mass of about 0.75 0.04 . From maximum magnitude rate of decline relation, we estimate a maximum absolute visual magnitude of =6.2 0.4 mag. This value leads to an uncorrected distance modulus of = 14.7 0.7. By using the interstellar reddening for the location of V2540 Oph, we find a rough estimate for the distance of 5.2 0.8 kpc. We propose that V2540 Oph is either: a high inclination cataclysmic variable showing a reflection effect of the secondary star, or having a spiral structure in the accretion disc, a high inclination intermediate polar system, or less likely a polar.
Keywords: accretion, accretion discs – stars: individual : V2540 Oph, novae, cataclysmic variables
1 Introduction
Nova V2540 Oph ( = , = ; Kato, Yamaoka & Ishioka 2002) was independently discovered by Haseda and Nakamura at magnitude V=9.0 on 2002 January 24 (Haseda et al. 2002). Examination of photographs revealed that the nova reached V=8.9 five days earlier (Seki et al. 2002). The upper limit on the pre-nova magnitude was estimated as 21 mag, indicating a lower limit of about 12.5 for the outburst amplitude by adopting an observed maximum magnitude of 8.5 (Kato et al. 2002). Kato et al. (2002) estimated an upper limit of =5.7 for the nova progenitor. They proposed that the nova should either have a short orbital period or a high inclination angle.
Retter et al. (2002a) obtained spectra (400-700 nm) of the nova on 2002 January 26 and detected strong emission lines of hydrogen and possibly weak P-Cyg profiles. They also found Fe II lines, indicating that the object is an Fe II class nova caught in the early decline stage. Infrared spectroscopy of V2540 Oph (Puetter et al. 2002) made about 172 days after discovery revealed that the nova showed a very rich emission line spectrum with the strongest line at 1.0830 micron (He I) and low exitation features of O I and Fe II. The so-called one micron iron lines (Fe II) were the strongest lines that have been observed in novae.
The possibility that V2540 Oph is either a short orbital period nova or a high inclination system as suggested by Kato et al. (2002) encouraged us to observe the system and to look for photometric periodicities. A preliminary report on the detection of a periodicity of about 0.28 d in V2540 Oph was given by Ak, Retter & Liu (2004) and here we present a compherensive analysis of this finding.
2 Observations
V2540 Oph was observed during 16 nights on May and June, 2003, and 10 nights on May and July, 2004. The observations span 26 days (167.9 hours in total). Table 1 presents a summary of the observation schedule. The photometry was carried out with a 0.3-m f/6.3 telescope coupled to an ST7 NABG CCD camera. The telescope is located in Exmouth, Western Australia, and no filter was used. The exposure times were between 30 and 60 sec every 120 sec. We estimated differential magnitudes with respect to GSC6248-1014 (the comparison star), using GSC6248-1077 as the check star. Their GSC magnitudes are 11.30 and 9.96 mag respectively. Differential magnitudes were calculated using aperture photometry. The mean GSC magnitude of the comparison star was added to the differential magnitudes to give a rough estimate of the visual magnitude. The observed magnitudes of V2540 Oph and the comparison star are listed in Table 2111available in electronic form.
| Date | Time of Start | Run Time | Points |
|---|---|---|---|
| (HJD-2450000) | (hours) | number | |
| 13/5/2003 | 2773.11350 | 2.1 | 60 |
| 21/5/2003 | 2781.08614 | 5.8 | 145 |
| 22/5/2003 | 2782.11612 | 6.5 | 173 |
| 23/5/2003 | 2783.07643 | 7.9 | 210 |
| 25/5/2003 | 2785.07620 | 7.4 | 197 |
| 26/5/2003 | 2786.07321 | 7.7 | 211 |
| 27/5/2003 | 2787.07082 | 7.7 | 202 |
| 20/7/2003 | 2840.96941 | 2.7 | 77 |
| 23/7/2003 | 2844.02231 | 5.8 | 162 |
| 24/7/2003 | 2845.00454 | 6.3 | 173 |
| 25/7/2003 | 2845.99641 | 6.5 | 164 |
| 26/7/2003 | 2846.98986 | 2.3 | 67 |
| 27/7/2003 | 2847.98599 | 6.8 | 185 |
| 28/7/2003 | 2848.99353 | 6.5 | 173 |
| 29/7/2003 | 2849.99128 | 2.6 | 70 |
| 30/7/2003 | 2850.98312 | 6.5 | 191 |
| 22/5/2004 | 3148.11717 | 6.8 | 183 |
| 25/5/2004 | 3151.13223 | 6.3 | 175 |
| 27/5/2004 | 3153.10968 | 6.9 | 193 |
| 28/5/2004 | 3154.09891 | 7.2 | 199 |
| 29/5/2004 | 3155.08938 | 7.6 | 208 |
| 16/6/2004 | 3172.99258 | 8.8 | 135 |
| 17/6/2004 | 3174.00195 | 8.3 | 302 |
| 18/6/2004 | 3174.99647 | 8.4 | 238 |
| 19/6/2004 | 3176.00047 | 8.4 | 239 |
| 21/6/2004 | 3178.02243 | 8.1 | 221 |
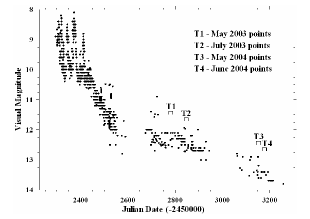
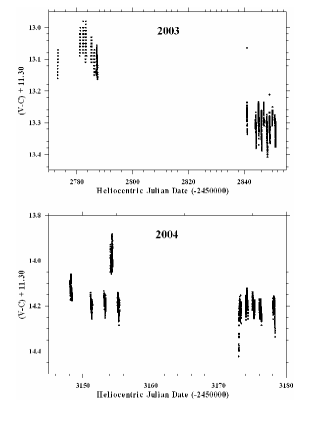
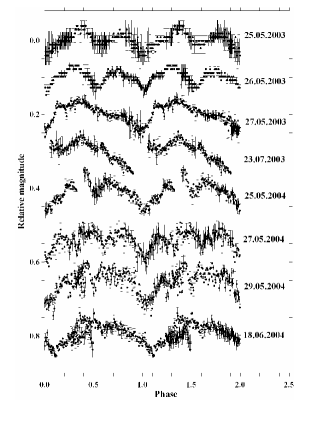
Figure 1 displays the visual light curve of the nova from outburst until Sept. 8, 2004. The data were taken from the Association Française des Observateurs d’Etoiles Variables (AFOEV222http://cdsweb.u-strasbg.fr/afoev/, Centre de Donnees Astronomiques de Strasbourg (CDS)) and the American Association of Variable Star Observers (AAVSO333www.aavso.org). This data set also includes the observations published in IAU Circulars. By combining the data from these associations of amateurs, we obtained almost 3300 individual points. Quasi-periodic brightness oscillations with a peak-to-peak amplitude of about 1.5 mag were apparent during the first 4 months after discovery. These are typical of the transition phase that is observed in certain novae. The times of our observations are marked on the graph. During the time interval spanned by our observations, the nova declined by about 1.1 mag. Kato et al. (2002) indicated that the true maximum of the nova could have been missed. However, they also noted that the reported spectrum (Retter et al. 2002a) suggests that the object was caught during an early decay stage. The magnitude of the nova was V=8.9 five days before the discovery (Seki et al. 2002), which is only 0.1 mag fainter than the discovery magnitude, and Kato et al. (2002) estimated an upper limit of V=8.5 for the maximum magnitude. So, it is possible that the true maximum of the nova was missed.
We present the light curves of V2540 Oph obtained in 2003 and 2004 separately in Figure 2. The jump of about 0.25 mag in the brightness of V2540 Oph in the fourth night in 2004 (May 28 2004) is probably real since we can not find a similar feature in the K-C magnitudes. Here K and C represent unfiltered magnitudes of the comparison star and the check star, respectively. The observational errors were estimated from the deviations of the K-C magnitudes from the nightly means and are typically about 0.016 and 0.012 mag for the 2003 and 2004 observations, respectively. A visual inspection of single runs shows a brightness modulation with a period of about 0.3 d in most nights. Samples of orbital light curves in 2003 and 2004 are shown in Figure 3.
3 Data Analysis
3.1 The periodogram analysis
The period analysis was performed using the Data Compensated Discrete Fourier Transform (DCDFT, Ferraz-Mello 1981, Foster 1995), including the CLEAN algoritm (Roberts, Lehar & Dreher 1987). The DCDFT method is based on a least-square regression on two trial functions, sin(t) and cos(t), and a constant. Here denotes the frequency. In the period analysis, we assume that the frequency, say , that corresponds to the highest peak in the power spectrum is real and subtract it from the data. Then, we find the highest peak, say , in the power spectrum of the residuals, subtract and simultaneously from the raw data and calculate a new power spectrum etc. until the strongest residual peak is below a given cutoff level. To select the peaks, we followed a conservative approach which is similar to the method described by Breger et al. (1993) who gave a good criterion for the significance of a peak in the power spectrum. In Breger’s method, the peaks in the power spectrum which are higher than the signal to noise ratio, S/N, of 4.0 for the amplitude are indicators of real signals. In order to assign a confidence level to the power spectra, we calculated the standard error () of the power values between the frequencies for which no strong peaks appear. We assumed 4 to be the confidence level for the power and considered only those peaks of the power spectrum whose power was above this level. We then applied the CLEAN algorithm to remove the false peaks until the strongest residual peak is below the calculated confidence level. Note that we also searched for periodic brightness modulations by Period98 (Sperl 1998), which is based on a least-square regression on a trial function, sin(t), along with a zero point. We found very similar power spectra from both techniques. We calculated the error in a frequency from the half width at the half maximum of the peak which is a good rough estimator of the uncertainty in a frequency. Before applying the power spectrum routines we normalized the data by subtracting the mean magnitudes from each night.
3.2 The 2003 light curve
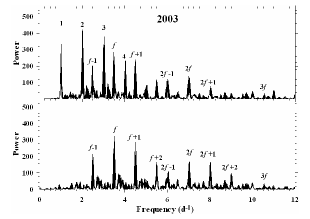
The power spectrum of the light curve of V2540 Oph obtained in 2003 is shown in the upper panel of Figure 4. We removed from the data the nights in which the duration of the observations was shorter than 3 hr. The power spectrum is dominated by the 1 alias and its harmonics which originate from the observational gaps. Since the observations were done from a single site, the 1 alias is very strong, as expected. After the 1 alias and its harmonics were subtracted from the data, the strongest peak in the power spectrum of the residuals corresponds to the frequency of = 3.498 0.002 . In order to find a confidence level for the power, we calculated the standard error () of the power level to be 3.09 between 10-20 after subtracting the harmonics of . By considering this standard error as the noise level, we calculated the confidence level to be 4=12.36 for the power, as described above.
To further check the reliability of the peak at the frequency 3.498 , we separately analyzed the data obtained in May and July, 2003. In the power spectra of both parts of the data, the same peak () appeared as the strongest one. Thus, we concluded that the peak at the frequency 3.498 represents a real periodicity in the 2003 data.
To search for additional signals, , its harmonics, and the 1 aliases were subtracted from the data. The power levels of the peaks in the power spectrum of the residuals are generally lower than the confidence level. The peaks indicating frequencies shorter than 3 are artefacts of the removed frequencies and correspond to periodicities that are longer than the typical interval of observations in each night. Thus, we can not consider them as real signals. In summary, we concluded that there are no additional signals in the 2003 light curve.
3.3 The 2004 light curve
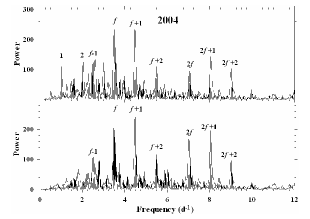
The power spectrum of the 2004 light curve of V2540 Oph is shown in the upper panel of Figure 5. The strongest peak in the power spectrum corresponds to the frequency of = 3.51 0.01 , which is consistent with that found in the 2003 data within errors. The 1 alias and its harmonics which originate from the observational gaps are very strong, as well. We calculated the standard error () of the power level to be 2.20 between 10-20 after subtracting the harmonics of . By considering this standard error as the noise level, we calculated the confidence level to be 4=8.80 for the power.
To further check the significance of the peak at the frequency 3.51 , we divided the data into two distinct parts (May and June, 2004). In the power spectra of both parts of the observations, the same peak () appeared as the strongest one. Thus, we concluded that the peak at the frequency 3.51 indicates a real periodicity in the 2004 data.
In summary, the frequencies of the signals found in 2003 and 2004 data are consistent with each other within errors.
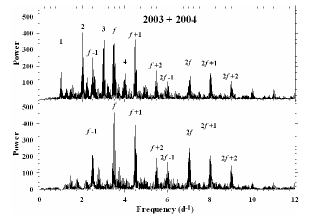
3.4 The power spectrum of the combined data
Analysis of the combined light curve observed in the two consequtive seasons can give a more precise value of the periodicity. To combine the data obtained in the two seasons, the cumulative error during the observing gap should be smaller than one cycle. The observed frequency and its error in 2003 data were given above as = 3.498 0.002 . Thus, after 1750 cycles (df/f5.72) the cumulative error is one cycle and we can not combine data obtained in two separate seasons. Fortunately, the gap between the observations from the two seasons is 300 days, or 1050 cycles. This calculation shows that the data from the two seasons can be combined.
Figure 6 is a plot of the power spectrum of all data except runs shorter than 3 h. The highest peak in the power spectrum corresponds to the frequency of = 3.51147 0.00008 ( 0.000006 d). Strong peaks at the 1 aliases and its harmonics are also prominent.
It should be noted that we could not find a statistically significant peak in the frequency range 20-100 in the power spectra of the 2003, 2004 and the combined light curves.
3.5 Structure of the periodicity
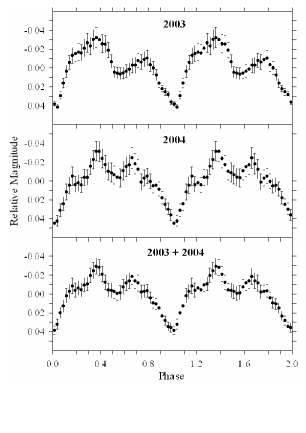
In Figure 7 we show the light curve of V2540 Oph folded on the d period. We omitted from the data the nights shorter than one full cycle. The points are the average magnitude value in each of the 40 equal bins that cover the 01 phase interval. The bars are 1 uncertainties in the average values. The full amplitude of the mean variation is 0.060 0.004 and 0.061 0.002 mag for the 2003 and 2004 observations, respectively. The amplitudes were derived by dividing the folded data into 10 equal intervals and by measuring the difference between extrema.
The best fitted ephemeris of the periodicity is:
Since the error in this value is larger than the result from the periodogram analysis, we adopt instead the value 0.000006 d found from the periodogram analysis of the combined light curve for the period.
A noteworthy feature seen in Figure 7 is the dip in the mean light curve at phase 0.5. The dip is present in both seasons and in the combined data. Its reliability was checked by subtracting a pure sinusoidal with a peak-to-peak amplitude of 0.060 mag from the folded and binned data, resulting in a distribution of the points around zero level. This method gave an eclipse-like feature at phase 0.5 with a full amplitude of about 0.02 mag.
3.6 The long-term light curve of the nova
We estimated a few parameters of the nova using the visual magnitude estimates by amateur astronomers that were made available by AAVSO and AFOEV (Section 2; Figure 1). As the typical uncertainty of a visual estimate is about 0.3 mag, we have determined a mean light curve by taking 0.1 d averages of the individual points. This led to an averaged light curve containing 705 points.
We found a decay rate of 0.011 0.002 mag/d during the first 296 days (JD 2452294-2452590) of the long-term light curve of V2540 Oph by fitting polinomials. However, at first glance, we see that the light curve can be divided into 5 linear parts that have different decay rates (see Figure 1). We calculated decay rates by linear fits to these parts of the light curve. The fading of the system was relatively fast (0.039 0.004 mag/d) during the first 47 days (JD 2452294-2452341) of the light curve. This decay rate is compatible with 0.033 mag/d measured by Kato et al. (2002) for the same time interval. However, during the next 99 days, the fading slowed down with a very low decay rate of 0.003 0.001 mag/d. In the following part of the light curve, the system faded with a decay rate (0.015 0.002 mag/d) faster than the previous part for about 150 days. Then the light curve showed another slow fading phase with 0.002 0.001 mag/d lasting about 270 days. The decay rate of the last part of the light curve was 0.005 0.001 mag/d which makes this part of the light curve steeper than the previuos one. Similar patterns can be seen in the light curves of nova V443 Sct (Anupama et al. 1992) and nova V4745 Sgr (Csák et al. 2005).
By using the maximum visual magnitude of 8.5 (Kato et al. 2002) we measured = 158 10 d and = 213 15 d from the long-term light curve which makes V2540 Oph a very slow nova according to the classification given in Table 5.4 of Warner (1995). The and parameters roughly obey the relation given by Warner (1995). Note the uncertainty in these values due to the possibility that the maximum was missed and because of the oscillations during the transition phase (Section 1; Figure 1).
We calculated the visual absolute magnitude in maximum with four maximum magnitude versus rate of decline relations by Downes & Duerbeck (2000), Della Valle & Livio (1995), Capaccioli et al. (1989) and Cohen (1985) using = 158 10 d. Our measurement resulted in 5.71, 6.86, 6.79, 5.40 mag, respectively. We adopted the formal average of these values, which is =6.2 0.4 mag. This value yields an uncorrected distance modulus of = 14.7 0.7 using the maximum visual magnitude of 8.5 (Kato et al. 2002). The galactic reddening map by Schlegel, Finkbeiner & Davis (1998)444http://nedwww.ipac.caltech.edu/ yields an upper limit of = 0.452 mag for the position of V2540 Oph. This yields an extinction of about = 1.5 mag. Consequently, we find a distance between 4.4 and 6.0 kpc.
Kiss & Thomson (2000) proposed that the quasi periods of the oscillations seen in nova light curves have a similar time scale of . V2540 Oph does not obey this relation since its parameter is much longer than the quasi period of the post-maximum oscillations which is about 32 1 d (see below). It should be noted that and the related parameters may be changed if the maximum visual magnitude of the nova was brighter than 8.5, say 8.0-8.2 mag. In this case, is measured as about 50 days, which is closer to the quasi-periodicity of the oscillations.
Another striking feature in the long-term light curve of V2540 Oph is the post-maximum oscillations with a full amplitude of about 1.5 mag superimposed on the fading phase during JD 2452294-2452440. The periodogram analysis gives a characteristic recurrence time of 32 1 d. However, it is evident that the maxima were not repeating periodically. We determined epochs of maxima by fitting low-order polinomials to the selected parts of the light curve. An inspection of the epochs shows that the time interval between successive maxima tends to increase monotonically in time. Similar trends were observed for GK Per, DK Lac (Bianchini, Friedjung & Brinkmann 1992) and V4745 Sgr (Csák et al. 2005).
4 Discussion
We identified one periodicity in the light curve of V2540 Oph about 16 and 28 months after its outburst. We suggest that the periodicity found in this study, P h, is the orbital period of the nova binary system. Such a period is typical of orbital periods in novae and cataclysmic variables (Warner 2002). The fact that the amplitude of the variation was very similar during the two years of observations (Section 3.5) despite a fading of 1.1 mag suggests that the dominant light source is the varying component, which is likely the accretion structure - the accretion disc or the accretion stream.
Using the orbital period of the system, we can obtain a rough mass estimate for the secondary star of the system. Smith & Dhillon (1998) derived a mass-period relation for the secondary stars in CVs using a sample of reliable mass estimates. From their Equation (9) we obtain a mass of 0.75 0.04 for the secondary star in V2540 Oph. The error in the mass was calculated from the standard deviation of the fit parameters. Using a mean white dwarf mass of 0.85 0.05 given for classical novae (Smith & Dhillon 1998), we find a mass ratio of / = 0.9 0.1. In the following we discuss several explanations for the observed variation.
4.1 A superhump periodicity?
The periodicity found in the light curve of V2540 Oph may be interpreted as a superhump period. Superhumps are quasi-periodic modulations that appear in the light curves of some cataclysmic variables (CVs), and in nova-like systems they are called permanent superhumps (Patterson et al. 1997; Patterson 1999, 2001; Retter & Naylor 2000; Retter et al. 2002b). The superhump period is a few per cent longer or shorter than the orbital period. The commonly accepted interpretation of the superhump phenomenon is that the light modulations result from the beat periodicity between the orbital period and the precession of the accretion disc around the white dwarf of the underlying binary system. However, our suggestion of the orbital period is based mainly on the following facts: This period was present in the light curves taken in 2003 and 2004, with no apparent change in its value, We did not observe a considerable amplitude difference of this brightness modulation between the 2003 and 2004 observations, and The shape of the light curve does not support a superhump period, since the mean shape of superhumps is typically an asymmetric sinusoid (e.g., Patterson et al. 1997; Retter, Leibowitz & Ofek 1997; Retter et al. 2003). Thus, we conclude that it is unlikely that the observed periodicity is a superhump.
4.2 Ellipsoidal effect of the secondary star
Another possible explanation of the variation in the light curve is the ellipsoidal effect of the companion star (e.g., Retter, Leibowitz & Naylor 1999). Using Equation (2.102) of Warner (1995) with the period of 6.83 h, we find that the visual absolute magnitude of the red dwarf is only about 7.4. An inspection of the long-term visual observations shows that the average visual magnitude of the nova was 12.3 and 13.4 during our 2003 and 2004 observations, respectively. If we assume that the distance of V2540 Oph is 4.4-6.0 kpc, we find an absolute magnitude between and for the system using = 1.5 mag (see Section 3.6). These absolute magnitudes show that the contribution of the secondary star to the total light of the system is less than 1 per cent, lower than observed. Thus, the light variation of V2540 Oph can probably not be attributed to the ellipsoidal effect of the companion star since the secondary star is too faint.
4.3 Irradiation effect and the polar interpretation
Retter et al. (1999) investigated the plausibility of the brightness modulation in the nova DN Gem originating from the irradiation of the secondary star using the model described in Somers, Mukai & Naylor (1996) and Ioannou et al. (1999). They concluded that an irradiated secondary star seems a likely source of the brightness modulations. These are similar to those seen in the light curve of V2540 Oph.
Woudt & Warner (2003) noted that one of the following requirements must be fulfilled for the large amplitude orbital modulations seen in the light curve of a recent nova in which the accretion disc does not dominate the luminosity of the system : The disc is foreshortened but the irradiated secondary is seen (high inclination angle), The disc has small dimensions (a short orbital period), No disc (the system is a polar). For V2540 Oph, the disc, if present, must be large since the system has a relatively long orbital period for a cataclysmic variable. Since the orbital period implies a hot secondary star due to its relatively high mass (0.75 ), this star can produce a significant irradiation effect. The folded light curve of V2540 Oph with a dip at phase 0.5 (Figure 7) resembles that of the polar V834 Cen (Cropper, Menzies & Tapia 1986) and the nova and polar candidate V2214 Oph (Baptista et al. 1993). However, the possibility that V2540 Oph is a polar seems weak as the orbital period distribution of polars concentrates around orbital periods shorter than 5 h (Warner 1995). Thus, using above requirements we can say that V2540 Oph is possibly a high inclination system with an irradiated secondary. If the brightness modulation seen in nova V2540 Oph originates from the irradiation of the secondary star, the dip at phase 0.5 may be an eclipse of the light reflected from the secondary star.
Kato et al. (2004) found a bump like feature at phase 0.6-0.7 and a dip-like feature at phase 0.2-0.4 in the light curve of the eclipsing transient nova V1494 Aql. These features are similar to those seen in the light curve of V2540 Oph. They suspected that the structure in the accretion disc fixed in the binary rotational frame may be responsible for these features. Hachisu, Kato & Kato (2004) showed that the out-of-eclipse features of V1494 Aql can be explained by spiral shocks on the accretion disk in the late phase of the nova outburst. A similar model can explain the out-of-eclipse features observed in V2540 Oph as well.
Although we can not unambiguously reject the possibility that the system is a polar, we can simply conclude that V2540 Oph is likely a high inclination system either showing an irradiation effect or having a spiral structure in its accretion disc. Interestingly, Kato et al. (2002) proposed that the nova should have either a short orbital period or a high inclination angle.
4.4 The transition phase and the intermediate polar model
The quasi-periodic brightness oscillations with a characteristic recurrence time of 32 d seen during the first four months of the long-term light curve of V2540 Oph (Figure 1) show that the nova was caught in the transition phase. We found a monotonic increase of the time interval between successive maxima in time (Section 3.6). Such trends were observed in GK Per, DK Lac (Bianchini et al. 1992) and V4745 Sgr (Csák et al. 2005). The optical light curve of a classical nova is typically characterized by a smooth decline. However, certain novae display a deep minimum in the light curve while others have slow oscillations, during the so-called ’transition phase’. The minimum is understood by the formation of a dust envelope around the binary system.
It should be noted that the term ’transition phase’ generally applies to a phenomenon between optical maximum and final fading stage, typically a few weeks-months after maximum. The oscillations observed in the long-term light curve of V2540 Oph occurred in a very early decay stage, soon after discovery. Thus, they may not represent the same phenomenon as typical transition phase oscillations. However, if the true maximum of the nova (see Section 2) was missed, the oscillations seen in the light curve would be the transition phase oscillations.
Several models have been suggested for the transition phase, such as stellar oscillations of the hot white dwarf, oscillations caused by the wind, formation of dust blobs that move in and out of line of sight to the nova, dwarf nova outbursts, mini nova-outbursts and oscillations of the common envelope (Bode & Evans 1989; Leibowitz 1993; Warner 1995; Csák et al. 2005). Shaviv (2001) argued that super-Eddington winds can be a natural explanation for the oscillatory behaviour during the transition phase of some novae. Retter (2002) suggested another solution for the transition phase problem and proposed a possible connection between the transition phase and intermediate polars (IPs) (for a review on IPs see e.g., Hellier 1999).
The IP model for V2540 Oph can not be ruled out, although we could not find a short-term spin period for the white dwarf in the light curve of V2540 Oph. In the transient nova V1494 Aql, no short-term period was found in the optical, but a 40 min period was detected in the X-ray (Drake et al. 2003). A short-term X-ray period of 22 min was also found in the transient nova V4743 Sgr (Ness et al. 2003). Thus, to confirm or refute the suggestion that novae with transition phase are intermediate polars, further X-ray and optical observations of novae are required.
Schmidtobreick et al. (2005) argued that some tremendous outburst nova candidates are likely to originate from rather low mass transfer rate systems, i.e. dwarf novae. However, they also expect that these systems have orbital periods shorter than classical novae. Thus, considering its orbital period suggested in our study, we believe that the possibility that the origin of V2540 Oph is a dwarf nova is weak.
As a concluding remark, we can say that the nova V2540 Oph may be: a high inclination cataclysmic variable with an irradiated secondary star or a spiral structure in its accretion disc, a high inclination intermediate polar system, or a polar. It should be noted that the last possibility is fairly weak considering the orbital period distribution of polars.
Acknowledgments
The authors would like to thank the anonymous referee for useful comments that helped improving an early version of the paper.
This work was partially supported by a postdoctoral fellowship from Penn State University. Part of this work was also supported by the Research Fund of the University of Istanbul, Project Numbers: BYP-724/24062005 and BYP-738/07072005. We acknowledge the observers of the AAVSO and AFOEV who made the observations that comprise the long-term light curve of the nova V2540 Oph used in this study.
References
- Ak, Retter & Liu (2004) Ak, T., Retter, A., Liu, A. 2004, IAUC, No.8449
- Anupama et al. (1992) Anupama, G.C., Duerbeck, H.W., Prabhu, T.P., Jain, S.K. 1992, AA, 263, 87
- Baptista et al. (1993) Baptista, R., Jablonski, F.J., Cieslinski, D., Steiner, J.E. 1993, ApJ, 406, L67
- Bianchini, Friedjung & Brinkmann (1992) Bianchini, A., Friedjung, M., Brinkmann, W. 1992, AA, 257, 599
- Bode & Evans (1989) Bode, M.F. Evans, A. 1989, Classical Novae, Alden Press, Oxford
- Breger et al. (1993) Breger, M., Stich, J., Garrido, R., Martin, B., Jiang, S.Y., Li, Z.P., Hube, D.P., Ostermann, W., Paparo, M., Scheck, M. 1993, AA, 271, 482
- Capaccioli et al. (1989) Capaccioli, M., Della Valle, M., D’onofrio, M., Rosino, L. 1989, AJ, 97, 1622
- Cohen (1985) Cohen, J.G. 1985, ApJ, 292, 90
- Cropper, Menzies & Tapia (1986) Cropper, M., Menzies, J.W., Tapia, S. 1986, MNRAS, 218, 201
- Csák et al. (2005) Csák, B., Kiss, L.L., Retter, A., Jacob, A., Kaspi, S. 2005, AA, 429, 599
- Della Valle & Livio (1995) Della Valle, M. Livio, M. 1995, ApJ, 452, 704
- Downes & Duerbeck (2000) Downes, R.A. Duerbeck, H.W. 2000, AJ, 120, 2007
- Drake et al. (2003) Drake, J.J., Wagner, R.M., Starrfield, S., Butt, Y., Krautter, J., et al. 2003, ApJ, 584, 448
- Ferraz-Mello (1981) Ferraz-Mello, S., 1981, AJ, 86, 619
- Foster (1995) Foster, G. 1995, AJ, 109, 1889
- Hachisu, Kato & Kato (2004) Hachisu, I., Kato, M., Kato, T. 2004, ApJ, 606, L139
- Haseda et al. (2002) Haseda, K., Nakamura, Y., Soma, M., Kadota, K., West, D. 2002, IAUC, No.7808
- Hellier (1999) Hellier, C. 1999, Annpolis Workshop on Magnetic Cataclysmic Variables, ASP Conf. Ser. Vol.157, p.1
- Ioannou et al. (1999) Ioannou, Z., Naylor, T., Welsh, W.F., Catalan, M.S., Worraker, W.J., James, N.D. 1999, MNRAS, 310, 398
- Kato, Yamaoka & Ishioka (2002) Kato, T., Yamaoka, H., Ishioka, R. 2002, IBVS, No.5309
- Kato et al. (2004) Kato, T., Ishioka, R., Uemura, M., Starkey, D.R., Krajci, T. 2004, PASJ, 56, 125
- Kiss & Thomson (2000) Kiss, L.L. Thomson, J.R. 2000, AA, 355, L9
- Leibowitz (1993) Leibowitz, E.M. 1993, ApJ, 411, L29
- Ness et al. (2003) Ness, J.U., Starrfield, S., Burwitz, V., Wichmann, R., Hauschildt, P., et al. 2003, ApJ, 594, L127
- Patterson et al. (1997) Patterson, J., Kemp, J., Saad, J., Skilman, D.R., Harvey, D., Fried, R., Thorstensen, J.R., Ashley, R. 1997, PASP, 109, 468
- Patterson (1999) Patterson, J. 1999, in Mineshige S., Wheeler C., eds, Disk Instabilities in Close Binary Systems. Universal Academic Press, Tokyo, p.61
- Patterson (2001) Patterson, J. 2001, PASP, 113, 736
- Puetter et al. (2002) Puetter, R.C., Lynch, K., Mazuk, S., Rudy, R.J., Venturini, C.C. 2002, IAUC, No.7938
- Retter, Leibowitz & Ofek (1997) Retter, A., Leibowitz, E.M., Ofek, E.O. 1997, MNRAS, 286, 745
- Retter, Leibowitz & Naylor (1999) Retter, A., Leibowitz, E.M., Naylor, T. 1999, MNRAS, 308, 140
- Retter & Naylor (2000) Retter, A. Naylor, T. 2000, MNRAS, 319, 510
- Retter (2002) Retter, A. 2002, Classical Nova Explosions: International Conference on Classical Nova Explotions, AIP Conf. Proc. Vol.637, p.279
- Retter et al. (2002a) Retter, A., O’Toole, S., Stathakis, R., Pogson, J., Naylor, T. 2002a, IAUC, No.7809
- Retter et al. (2002b) Retter, A., Chou, Y., Bedding, T.R., Naylor, T. 2002b, MNRAS, 330, L37
- Retter et al. (2003) Retter, A., Hellier, C., Augusteijn, T., Naylor, T., Bedding, T. R., Bembrick, C., McCormick, J., Velthuis, F. 2003, MNRAS, 340, 679
- Roberts, Lehar & Dreher (1987) Roberts, D.H., Lehar, J., Dreher, J.W. 1987, AJ, 93, 968
- Schlegel, Finkbeiner & Davis (1998) Schlegel, D.J., Finkbeiner, D.P., Davis, M. 1998, ApJ, 500, 525
- Schmidtobreick et al. (2005) Schmidtobreick, L., Tappert, C., Bianchini, A., Mennickent, R.E. 2005, AA, 432, 199
- Seki et al. (2002) Seki, T., Sato, H., Kato, T., Nishimura, H., Muraoka, Y., Garcia, J., Linnolt, M., Pearce, A. 2002, IAUC, No.7809
- Shaviv (2001) Shaviv, N.J. 2001, MNRAS, 326, 126
- Smith & Dhillon (1998) Smith, D.A. Dhillon, V.S. 1998, MNRAS, 301, 767
- Somers, Mukai & Naylor (1996) Somers, M.W., Mukai, K., Naylor, T. 1996, MNRAS, 278, 845
- Sperl (1998) Sperl, M. 1998, Comm. Astr. Seis., 111
- Warner (1995) Warner, B. 1995, Cataclysmic Variable Stars, Cambridge Univ. Press, Cambridge
- Warner (2002) Warner, B. 2002, in Classical Nova Explosions: International Conference on Classical Nova Explosions , AIP Conference Proceedings, Vol. 637, p.3-15
- Woudt & Warner (2003) Woudt, P.A. Warner, B. 2003, MNRAS, 339, 731