Evidence for Harmonic Content and Frequency Evolution of Oscillations during the Rising Phase of X-ray Bursts from 4U 1636–536
Abstract
We report on a study of the evolution of burst oscillation properties during the rising phase of X-ray bursts from 4U 1636–536 observed with the proportional counter array (PCA) onboard the Rossi X-Ray Timing Explorer (RXTE). We present evidence for significant harmonic structure of burst oscillation pulses during the early rising phases of bursts. This is the first such detection in burst rise oscillations, and has interesting implications for constraining neutron star structure parameters and the equation of state models of matter at the core of a neutron star. The detection of harmonic content only during the initial portions of the burst rise appears consistent with the theoretical expectation that with time the thermonuclear burning region becomes larger, and hence the fundamental and harmonic amplitudes both diminish. We also find, for the first time from this source, strong evidence of frequency increases during burst rise. The timing behavior of harmonic content, amplitude, and frequency of burst rise oscillations may be important in understanding the spreading of thermonuclear flames under the extreme physical conditions on neutron star surfaces.
1 Introduction
Millisecond period brightness oscillations, “burst oscillations”, during thermonuclear (type I) X-ray bursts from the surfaces of neutron stars in low mass X-ray binary (LMXB) systems result from an asymmetric brightness pattern on the rotating stellar surface (Chakrabarty et al. 2003; Strohmayer, & Bildsten 2003). This timing feature reveals the stellar spin period and can provide important information about the other stellar parameters (radius, mass, etc.; Miller, & Lamb 1998; Nath, Strohmayer, & Swank 2002; Muno, Özel, & Chakrabarty 2002). Theoretical modelling of these oscillations has the potential to constrain the equation of state (EOS) of the dense matter at the core of a neutron star (see, for example Bhattacharyya et al. 2005). This can be most effectively done if the burst oscillation has some harmonic content, as the fitting of a pure sinusoidal lightcurve does not put strong constraints on the stellar parameters. Although burst oscillations have been discovered from more than a dozen LMXBs, only one source (the accreting millisecond pulsar XTE J1814-338) has shown significant harmonic content (during burst decay; see Strohmayer et al. 2003; Watts, Strohmayer, & Markwardt 2005). In this Letter we focus on oscillations during burst rise, because at the beginning of the burst, the size of the burning region is theoretically expected to be at its smallest, and the harmonic content should theoretically be larger, and hence might be detected.
The study of burst oscillations during burst rise is important for another reason. At the onset of the burst, a small portion of the stellar surface is ignited, and then the burning region spreads and engulfs the whole stellar surface during the burst rise (Spitkovsky, Levin, & Ushomirsky 2002). This is natural, because simultaneous ignition of the whole stellar surface would require very fine tuning. Understanding this spreading is important, as it involves complex nuclear physics and geophysical fluid dynamics (with significant stellar spin), under conditions of extreme gravity, magnetic field and radiation pressure. Other than the burst rise lightcurve, the time evolution of three properties (frequency, amplitude, and harmonic content) of burst oscillations are the most useful observational tools to investigate this problem. Studies to date have not found harmonic content during burst rise. Strohmayer, Zhang, & Swank (1997) found evidence for a decrease in amplitude during burst rise from an analysis of RXTE data from the LMXB 4U 1728-34, and frequency increase during the burst rise from the accreting millisecond pulsar SAX J1808.4–3658 has also been reported (Chakrabarty et al. 2003). In this Letter, we report the finding of frequency evolution during the rise of several bursts, as well as evidence for significant harmonic content of burst oscillations at the beginning of burst rise.
2 Data Analysis and results
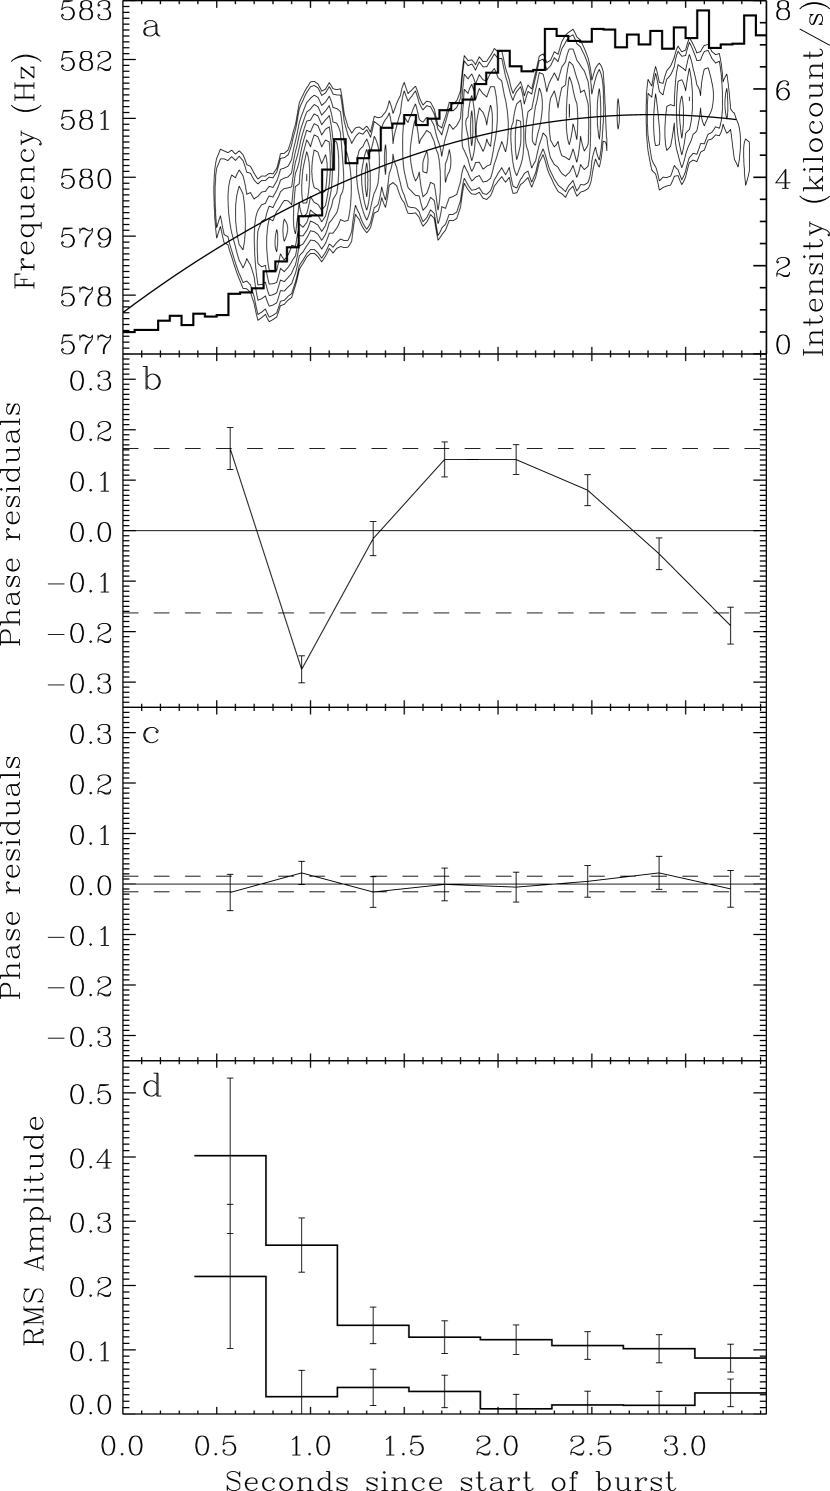
More than a hundred bursts have so far been observed from the LMXB 4U 1636–536 by the proportional counter array (PCA) on board RXTE. By analysing the archival data we find that 23 of them show at least moderately strong oscillations during burst rise. In order to search sensitively for harmonic content, it is necessary to maximize the fundamental power by taking any frequency evolution into account (see Miller 1999; Strohmayer & Markwardt 1999; Muno et al. 2002). Therefore, first we explore frequency evolution during burst rise using the following procedures: (1) we calculate dynamic power spectra (Strohmayer & Markwardt 1999) using a time duration that is small enough to resolve the burst rise, but is still large enough to accumulate significant signal power. The resulting dynamic spectra (panel a of Fig. 1, and Fig. 2) provide an indication of the frequency evolution behavior. (2) We carry out a phase timing analysis (Muno et al. 2000) to confirm the indications in the dynamic spectra. We divide the burst rise time interval into several bins of a fixed chosen length, and then assuming a frequency evolution model, we calculate the average phase in each bin . The corresponding is calculated using the formula (Strohmayer & Markwardt 2002), where is the number of bins, and is the fundamental power in the corresponding bin. We find the best fit parameter values for a particular frequency evolution model by minimizing this and we calculate the uncertainty in each parameter by increasing the value by the appropriate amount (Press et al. 1992). (3) To confirm these results, we calculate the total fundamental power during the burst rise time interval using these best fit frequency evolution model parameter values, and ensure that this power is close to the maximum power obtained from any parameter values.
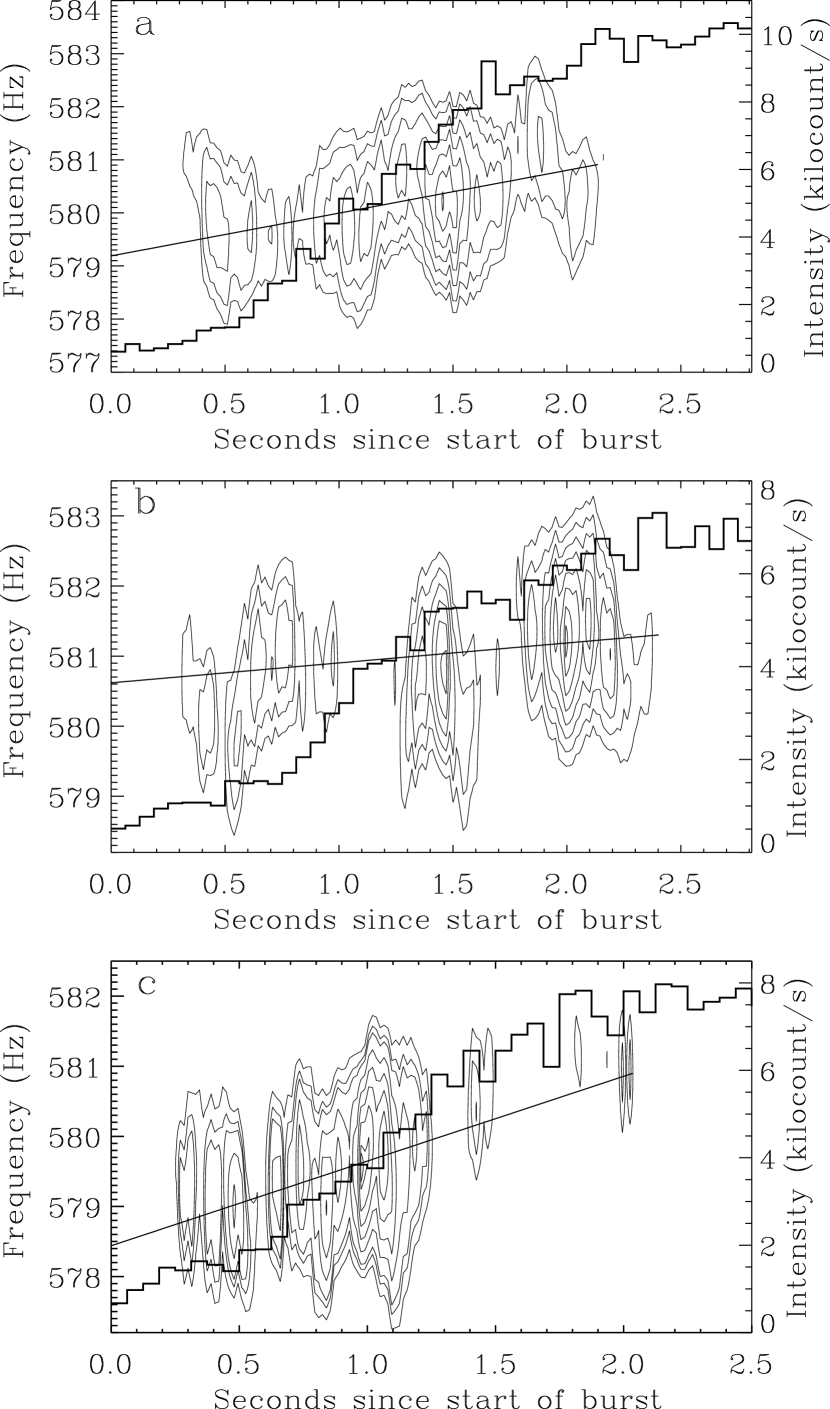
We found four bursts with significant frequency evolution during the rise. These are listed in Table 1. For burst A (panel a, Fig. 1), a constant frequency model gives a reduced and fundamental power . We also calculated the phase residuals (see Strohmayer & Markwardt 2002 for details) for this model. The large systematic deviations from the mean value (panel b, Fig. 1), and the very high indicate that a constant frequency model for burst A can be strongly rejected. Next, we add a linear term to the frequency model, and find that the corresponding reduced , and . This is a better fit, but still not statistically acceptable. Therefore, we include a nonlinear term to the frequency model. This model has a reduced , and , and the corresponding phase residuals have small random deviations from the mean value (panel c, Fig. 1). Hence, we conclude, that for burst A, the data strongly indicate a nonlinear frequency increase (Table 1). We fit constant frequency models to the other bursts listed in Table 1. For bursts B, C, & D, the reduced values for this model are 225.58/6 (86.91), 43.84/6 (86.16), & 142.11/5 (20.42) respectively. These are all poor fits, and hence the constant frequency model for these bursts can also be strongly rejected. Next, we include a linear term in the frequency models for these bursts. The corresponding reduced values are 7.16/5 (200.35), 12.70/5 (173.18), & 5.11/4 (89.75) respectively. These fits are acceptable for bursts B & D. For burst C, the high power value and the good visual fit of this frequency model to the power contours (panel b, Fig. 2) suggest that this model is on average correct, and the high reduced value may be caused by fluctuation of the frequency on short time scales. Therefore, for bursts B, C, & D, a linear frequency increase (Table 1 & Fig. 2) is acceptable. In panel d of Fig. 1, we show the rms amplitude variation with time during the rise of burst A. The fundamental amplitude shows an initially fast and then a slower decrease. Moreover, there is some weak indication of a significant 1st harmonic amplitude during the first second of this burst.
Using our best fitting frequency evolution models, we next searched for harmonic content in the burst oscillations. Individually, none of the bursts shows strong harmonic power, therefore, we added the bursts coherently to get more signal. For this purpose, we chose the bursts with fundamental power (for the constant frequency model) during burst rise, and added them (nine in number; listed in Table 2) coherently (i.e., we found the constant phase offset for each burst which maximized the total fundamental power). The total co-added, phase-folded lightcurve does not give a significant harmonic power. A possible reason for this may be that during a significant portion of the burst rise interval, the size of the burning region is large enough that the harmonic amplitude is too small to be detected. To address this possibility we consider five time intervals (starting at the time of burst onset) of length; 1/4th, 1/3rd, half, 2/3rd, and all of the rise time. For each interval fraction, and for each burst, we consider that fraction of the total rise time, fit it with our frequency evolution model to get best fit parameter values, and use these best fit values to calculate the phases. We do this for all the nine bursts and then add them coherently (separately for each interval fraction). We find that the interval comprising 1/3rd of the rise time gives the highest harmonic power . The search at the harmonic frequency in any independent subinterval is essentially a single trial search (see Miller 1999), so we can estimate the significance of this value using a distribution with 2 degrees of freedom. This gives a single-trial probability of to find a power as high by chance. We searched 5 intervals, but they are not all independent, so the number of trials is between 1 and 5. Using 5 to get a conservative, lower bound on the probability gives , which is still a bit better than a detection. As we increase the time interval, (that is, use more of the rise), the harmonic power decreases gradually, which is consistent with the expectation that the burning region becomes larger, and hence the harmonic content diminishes. Due to the consistency with this theoretical expectation, and the better than harmonic power for 1/3rd of the rise interval, we conclude that harmonic content in the burst rise oscillations has been marginally detected.
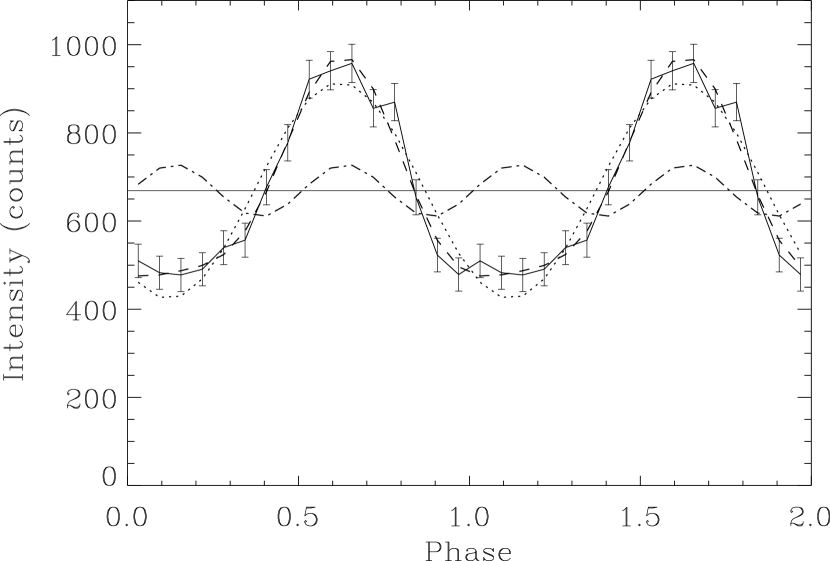
We extracted the corresponding (i.e., for 1/3rd of the rise time interval) phase-folded lightcurve from the data (after subtraction of the persistent emission) of the nine bursts. We fit it with two models: (1) a single sinusoid (the fundamental) around a constant level, and (2) two sinusoids (fundamental and 1st harmonic) around a constant level. The former one gives a reduced value , while this value for the latter model is (Table 2). These results support our finding that the addition of a 1st harmonic provides a better description of the data. Fig. 3 shows the data, the best fit model (model 2 of Table 2), and all the components of the model.
3 Discussion
In this Letter, we report two new observational results: (1) the first detection of frequency evolution (increase) of burst rise oscillations from 4U 1636–536, and (2) the first evidence for harmonic content of burst rise oscillations (from any source). These effects may be a direct result of thermonuclear flame propagation on the stellar surface (Bhattacharyya & Strohmayer 2005a; 2005b). For example, consider ignition of a burst off of the equator in the northern hemisphere. Initially the small burning region (Spitkovsky et al. 2002) can produce both a large fundamental and harmonic amplitude, more or less consistent with the observations. The frequency, when first observed, is at its lowest value and then increases monotonically. At least two effects can account for this behavior; hydrostatic expansion—and subsequent spin-down—makes the burning region slip westward (on a star rotating eastward; see Strohmayer, Jahoda, Giles, & Lee 1997; Cumming & Bildsten 2001; Cumming et al. 2002; Spitkovsky et al. 2002; Bhattacharyya & Strohmayer 2005b), and the southbound front will slip even further westward due to conservation of angular momentum (Bhattacharyya & Strohmayer 2005b). Thus, the hot region initially has a net retrograde drift in the frame of the neutron star, so the observed frequency is less than the spin frequency. As the front approaches the equator it spreads faster, eventually forming a more or less symmetric equatorial belt (Spitkovsky et al. 2002). This can plausibly reduce the pulsation amplitude in both the fundamental and harmonic, and the westward drift slows because mass elements moving southward below the equator now drift eastward, conserving angular momentum. Thus, the frequency increases from its initial (low) value. Once the equatorial belt has been ignited, it seems likely that residual asymmetry associated with the initial, northbound burning front is responsible for the observed, lower amplitude oscillations. Detailed calculations of the flux from such a spreading burning front are required to explore this scenario quantitatively, but the discussion above provides a plausible qualitative understanding of many of the observed properties (more detailed discussions are in Bhattacharyya & Strohmayer 2005b).
As noted above, the harmonic content found at the beginning of the bursts is consistent with the expected size of the burning region. We have computed theoretical models to show that the inferred harmonic content is theoretically possible. For example, the harmonic to fundamental amplitude ratio , and the relative phase difference of the components can be reproduced reasonably well with a model assuming emission from a circular hot spot (Bhattacharyya et al. 2005). Using a dimensionless stellar radius-to-mass ratio , stellar mass , observer’s inclination angle , -position of the center of the circular burning region , angular radius of the burning region , beaming parameter , and blackbody temperature of the burning region keV, we can explain the relative strength and phasing of the fundamental and harmonic components. Here, we have assumed a Schwarzschild spacetime, and the beaming parameter gives a measure of the beaming in the frame corotating with the star (Bhattacharyya et al. 2005). These model parameter values give and , while for the data (Fig. 3), and . The constant level, required by the observed lightcurve, can plausibly be supplied by a symmetric belt-like component of the burning region (as mentioned earlier). We note that waves in the surface layers of a neutron star (Heyl 2005; Lee & Strohmayer 2005) are unlikely to produce a significant harmonic content, and hence at least for the rising phases of these bursts, a wave interpretation of oscillations seems disfavored.
Our results suggest that detailed studies of the onset of bursts can, in principle, provide insight into the structure of neutron stars, and how thermonuclear flames propagate on their surfaces. Moreover, the studies of bursts with oscillations during both rise and tail can determine whether these two oscillations are phase-connected, and hence of the same origin. Unfortunately, current studies are observationally limited by the detected count rates. However, a way out of this is to add a number of bursts to increase the signal to noise ratio, as we have done in this Letter to detect the harmonic content.
References
- (1) Bhattacharyya, S., & Strohmayer, T. E. 2005a, ApJ, in press (astro-ph/0509369).
- (2) Bhattacharyya, S., & Strohmayer, T. E. 2005b, in preparation.
- (3) Bhattacharyya, S., Strohmayer, T. E., Miller, M. C., & Markwardt, C. B. 2005, ApJ, 619, 483.
- (4) Chakrabarty, D. et al. 2003, Nature, 424, 42.
- (5) Cumming, A., & Bildsten, L. 2001, ApJ, 559, L127.
- (6) Cumming, A., Morsink, S. M., Bildsten, L., Friedman, J. L., & Holz, D. E. 2002, ApJ, 564, 343.
- (7) Heyl, J. S. 2005, MNRAS, 361, 504.
- (8) Lee, U., & Strohmayer, T. E. 2005, MNRAS, 361, 659.
- (9) Miller, M. C. 1999, ApJ, 515, L77.
- (10) Miller, M. C. & Lamb, F. K. 1998, ApJ, 499, L37.
- (11) Muno, M. P., Fox, D. W., Morgan, E. H., & Bildsten, L. 2000, ApJ, 542, 1016.
- (12) Muno, M. P., Özel, F., & Chakrabarty, D. 2002, ApJ, 581, 550.
- (13) Nath, N. R., Strohmayer, T. E., & Swank, J. H. 2002, ApJ, 564, 353.
- (14) Press, W. H., Teukolsky, S. A., Vetterling, W. T., & Flannery, B. P. 1992, Numerical Recepies in FORTRAN (New York: Cambridge University Press), 687-693.
- (15) Spitkovsky, A., Levin, Y. & Ushomirsky, G. 2002, ApJ, 566, 1018.
- (16) Strohmayer, T.E., & Bildsten, L. 2003, in Compact Stellar X-ray Sources, Eds. W.H.G. Lewin and M. van der Klis, (Cambridge University Press: Cambridge), (astro-ph/0301544).
- (17) Strohmayer, T.E., Jahoda, K., Giles, A. B., & Lee, U. 1997, ApJ, 486, 355.
- (18) Strohmayer, T. E., & Markwardt, C. B. 1999, ApJ, 516, L81.
- (19) Strohmayer, T. E., & Markwardt, C. B. 2002, ApJ, 577, 337.
- (20) Strohmayer, T. E., Markwardt, C.B., Swank, J. H., & in ’t Zand, J. 2003, ApJ, 596, L67.
- (21) Strohmayer, T. E., Zhang, W., & Swank, J. H. 1997, ApJ, 487, L77.
- (22) Watts, A. L., Strohmayer, T. E., & Markwardt, C. B. 2005, ApJ, 634, 547.
| ObsId | Start date | Burst | bbFundamental power during burst rise. | ||||
|---|---|---|---|---|---|---|---|
| 60032-05-03-00 | 2002 Jan 12 | A | |||||
| 60032-05-03-00 | 2002 Jan 13 | B | – | ||||
| 60032-05-05-00 | 2002 Jan 14 | C | – | ||||
| 60032-05-10-00 | 2002 Jan 22 | D | – |
| Model | /dof | |||||
|---|---|---|---|---|---|---|
| 1ccOnly fundamental. | – | – | ||||
| 2ddFundamental + 1st harmonic. |